| Param | Original file | Final file |
|---|---|---|
| Filename | modeM0/AS1A14_083T16_9000006580_57787cztM0_level2.fits | modeM0/AS1A14_083T16_9000006580_57787cztM0_level2_quad_clean.evt |
| Size (bytes) | 524,185,920 | 92,280,960 |
| Size | 499.9 MB | 88.0 MB |
| Events in quadrant A | 2,796,161 | 628,956 |
| Events in quadrant B | 3,312,540 | 676,848 |
| Events in quadrant C | 8,141,961 | 516,501 |
| Events in quadrant D | 4,661,712 | 530,259 |
| Mode SS | |||
|---|---|---|---|
| Quadrant | BADHDUFLAG | Total packets | Discarded packets |
| A | 0 | 128 | 0 |
| B | 0 | 128 | 0 |
| C | 0 | 128 | 0 |
| D | 0 | 128 | 0 |
| Mode M0 | |||
|---|---|---|---|
| Quadrant | BADHDUFLAG | Total packets | Discarded packets |
| A | 0 | 12940 | 1 |
| B | 0 | 14280 | 1 |
| C | 0 | 28674 | 1 |
| D | 0 | 18257 | 1 |
| Mode M9 | |||
|---|---|---|---|
| Quadrant | BADHDUFLAG | Total packets | Discarded packets |
| A | 0 | 11 | 0 |
| B | 0 | 11 | 0 |
| C | 0 | 11 | 0 |
| D | 0 | 11 | 0 |
| Quadrant | Total seconds | Saturated seconds | Saturation percentage |
|---|---|---|---|
| A | 6331 | 25 | 0.394882% |
| B | 6331 | 63 | 0.995103% |
| C | 6331 | 1093 | 17.264255% |
| D | 6332 | 401 | 6.332912% |
Noise dominated data is calculated using 1-second bins in cleaned event files. If a bin has >2000 counts, and if more than 50% of those come from <1% of pixels, then it is considered to be noise-dominated and hence unusable.
| Quadrant | # 1 sec bins | Bins with >0 counts | Bins with >2000 counts | High rate bins dominated by noise | Noise dominated (total time) | Noise dominated (detector-on time) | Marked lightcurve |
|---|---|---|---|---|---|---|---|
| A | 7471 | 6332 | 0 | 0 | 0.00% | 0.00% | 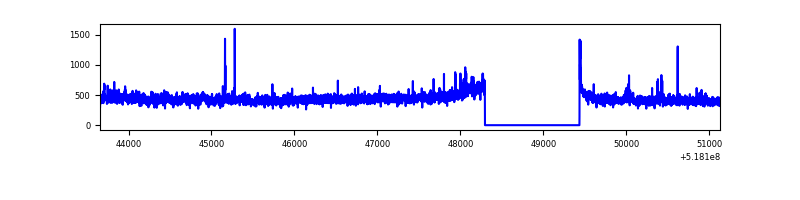 |
| B | 7471 | 6332 | 15 | 15 | 0.20% | 0.24% | 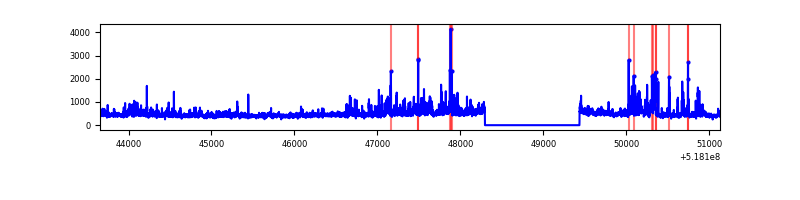 |
| C | 7471 | 6332 | 913 | 913 | 12.22% | 14.42% | 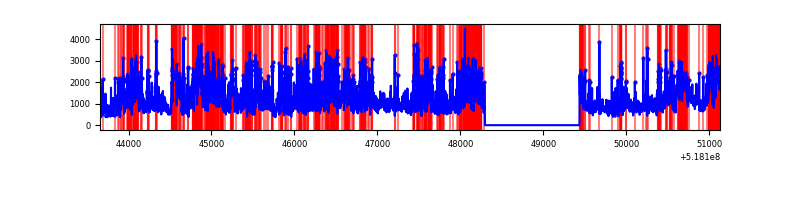 |
| D | 7472 | 6333 | 362 | 362 | 4.84% | 5.72% | 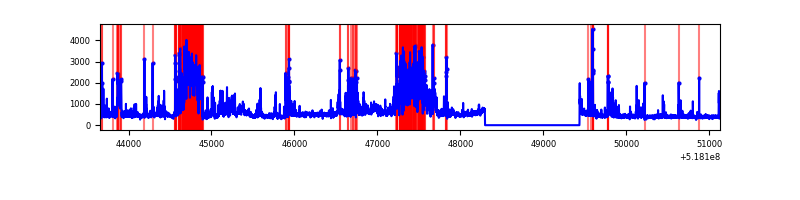 |
Top three noisy pixels from each quadrant. If the there are fewer than three noisy pixels in the level2.evt file, extra rows are filled as -1
| Pixel properties | Quadrant properties | ||||||
|---|---|---|---|---|---|---|---|
| Quadrant | DetID | PixID | Counts | Sigma | Mean | Median | Sigma |
| A | 3 | 128 | 99179 | 591.25 | 672 | 656 | 166.6 |
| A | 3 | 14 | 57974 | 343.97 | 672 | 656 | 166.6 |
| A | 4 | 158 | 17215 | 99.37 | 672 | 656 | 166.6 |
| B | 4 | 80 | 335874 | 2353.67 | 669 | 645 | 142.4 |
| B | 10 | 247 | 148821 | 1040.36 | 669 | 645 | 142.4 |
| B | 0 | 63 | 39859 | 275.32 | 669 | 645 | 142.4 |
| C | 9 | 38 | 4328987 | 25596.62 | 620 | 614 | 169.1 |
| C | 15 | 224 | 1076539 | 6362.68 | 620 | 614 | 169.1 |
| C | 12 | 2 | 147134 | 866.47 | 620 | 614 | 169.1 |
| D | 8 | 160 | 975549 | 5439.0 | 634 | 605 | 179.3 |
| D | 2 | 153 | 778149 | 4337.75 | 634 | 605 | 179.3 |
| D | 2 | 172 | 116631 | 647.28 | 634 | 605 | 179.3 |
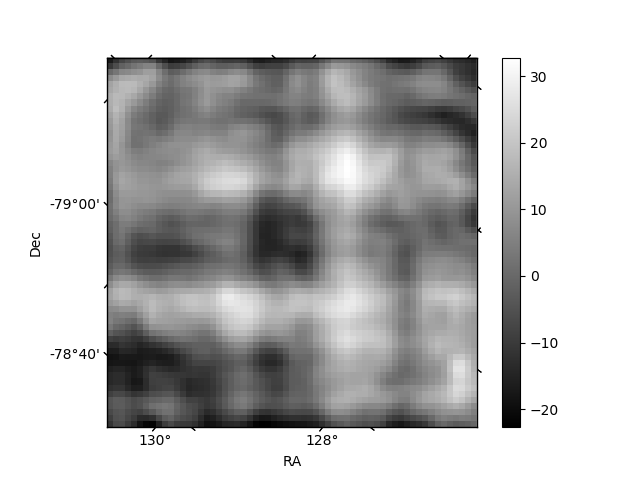
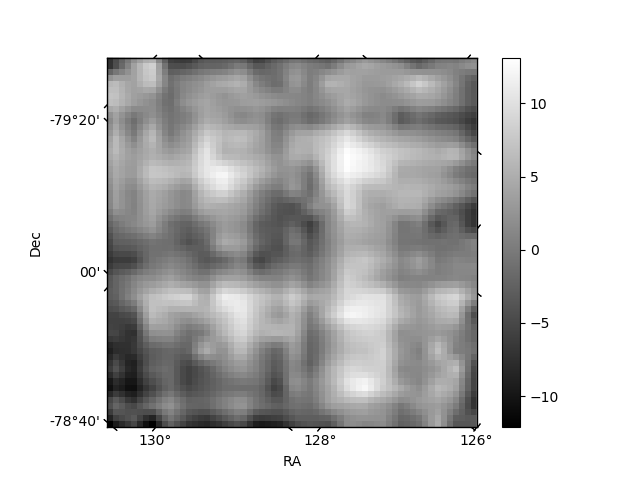
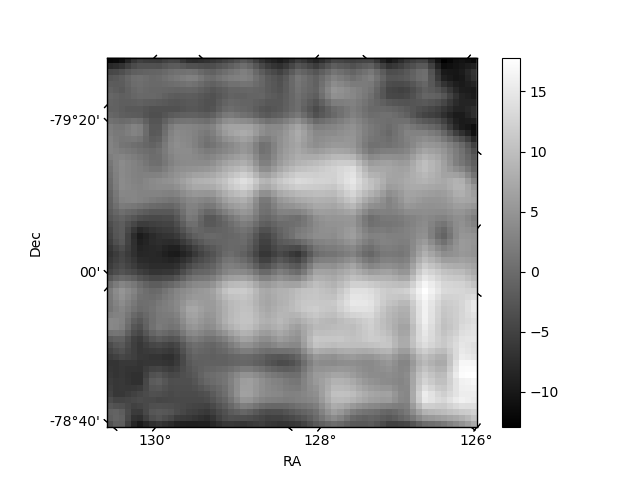
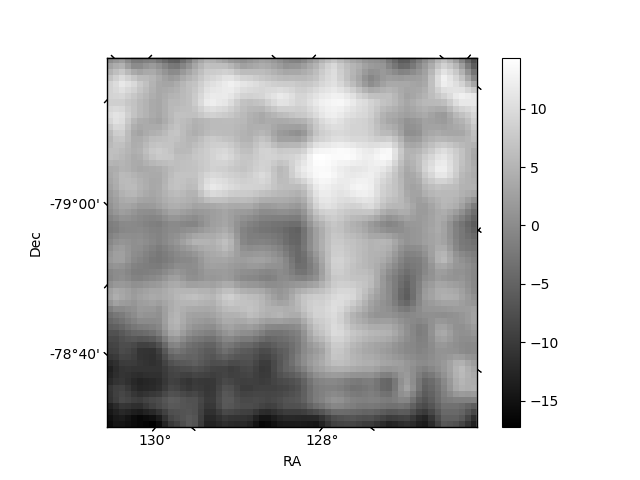
Histogram calculated using DETX and DETY for each event in the final _common_clean file
| Quadrant A | 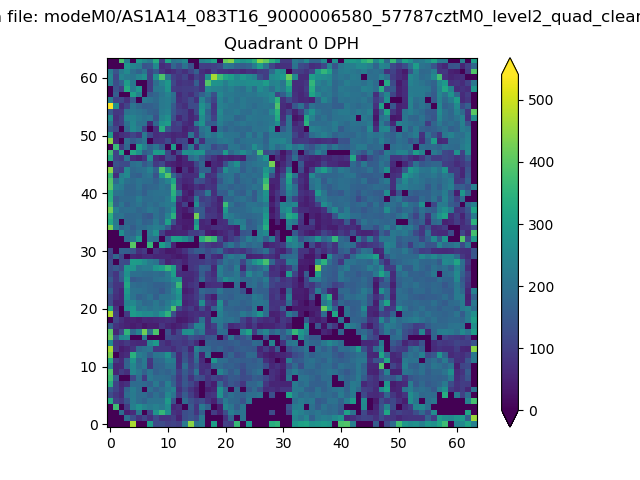 |
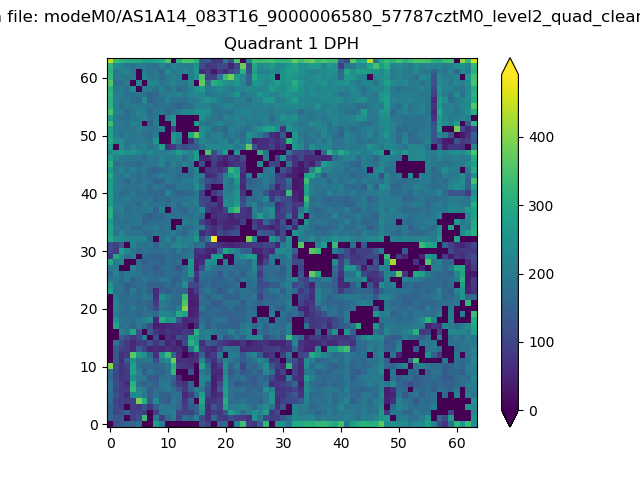 |
Quadrant B |
|---|---|---|---|
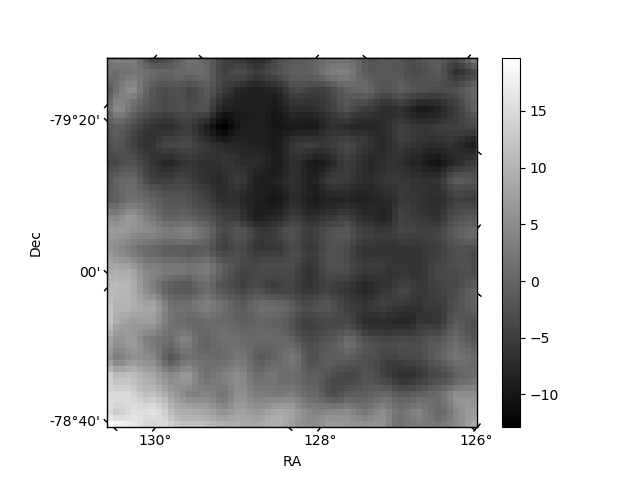
| Quadrant D | 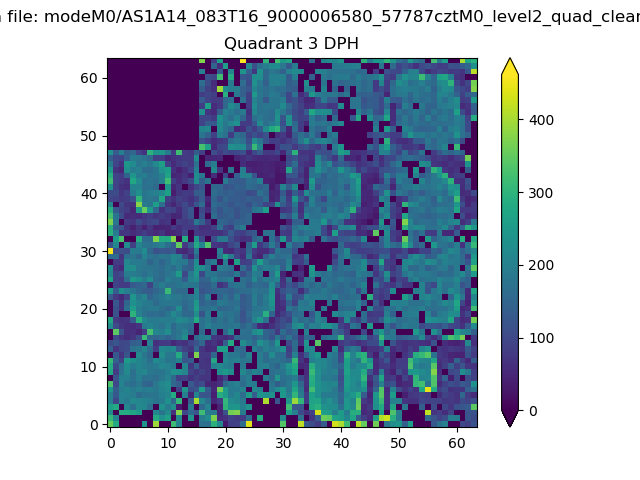 |
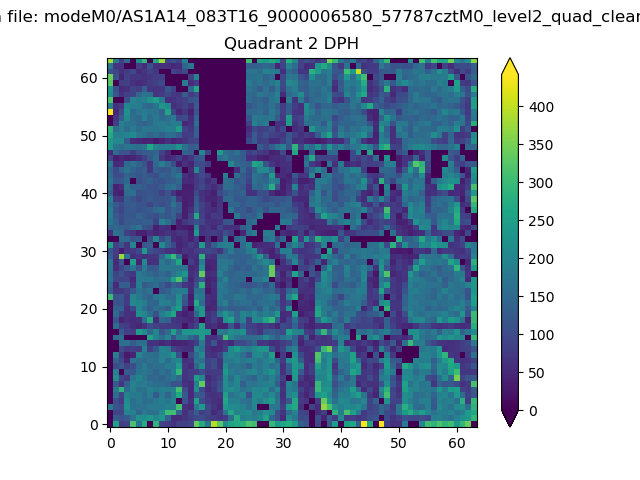 |
Quadrant C |
| Plot type | Count rate plots | Images |
|---|---|---|
| Comparison with Poisson distribution Blue bars denote a histogram of data divided into 1 sec bins. Red curve is a Poisson curve with rate = median count rate of data. |
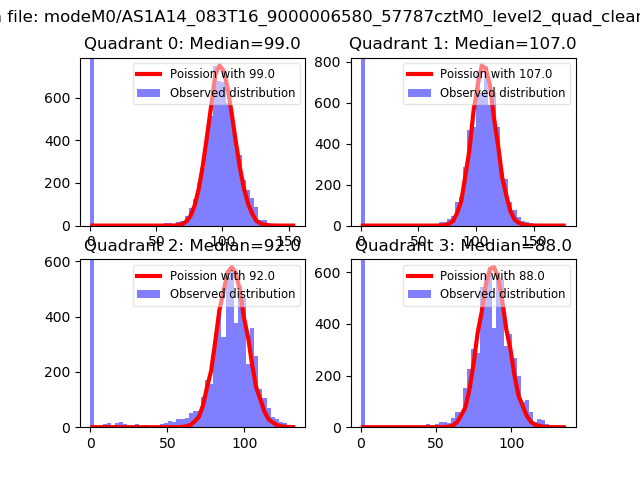 |
 |
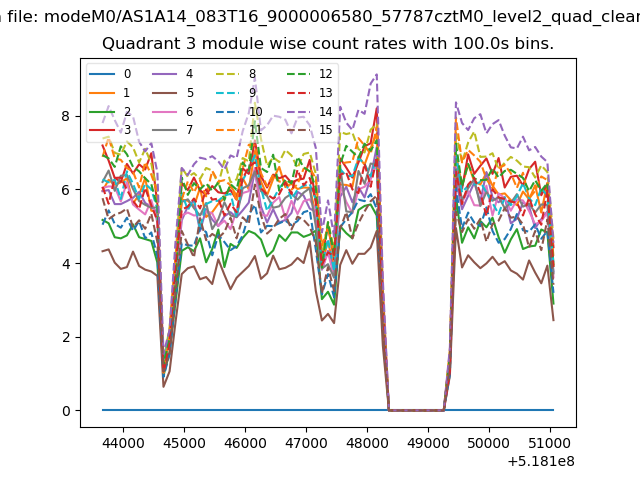
| Quadrant-wise count rates Data is divided into 100 sec bins |
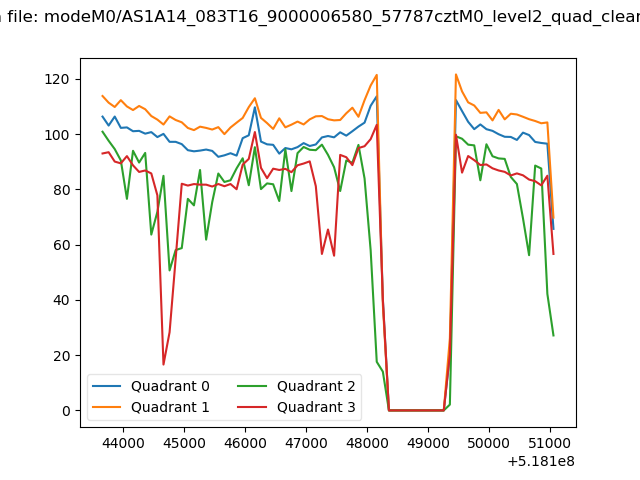 |
|
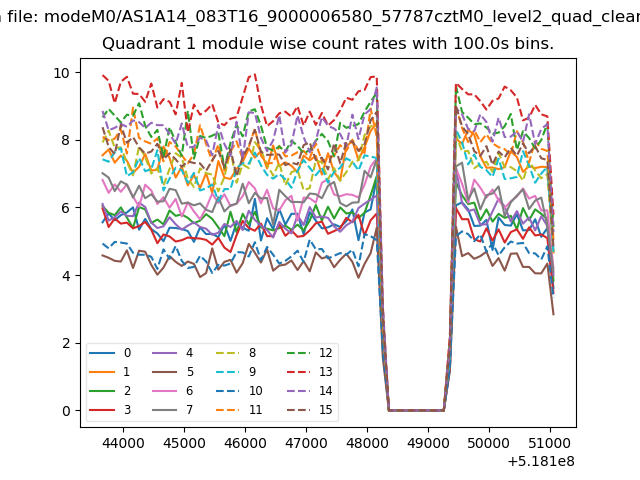
| Module-wise count rates for Quadrant A Data is divided into 100 sec bins |
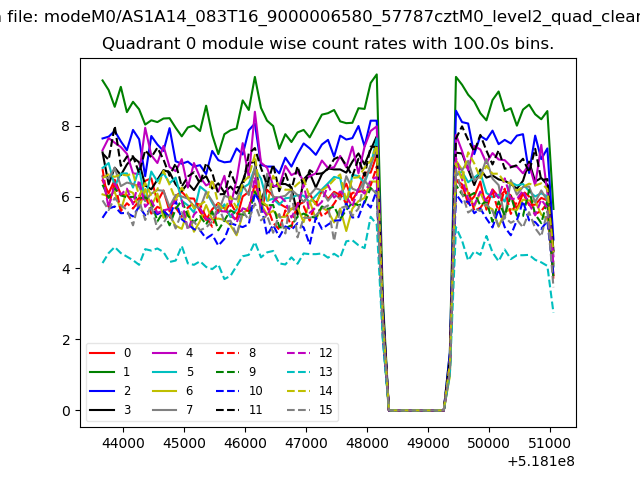 |
 |
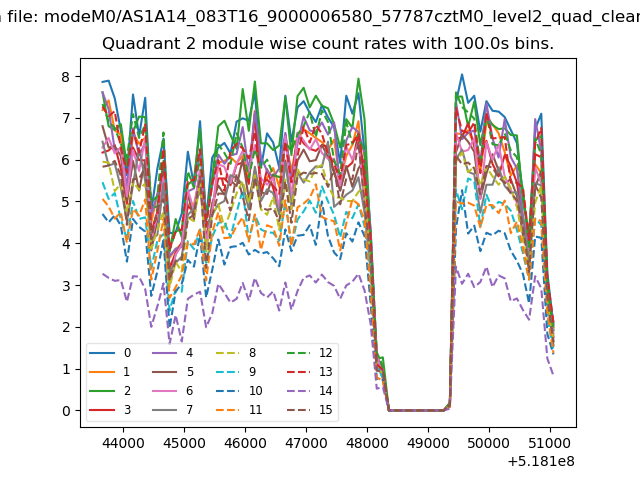
| Module-wise count rates for Quadrant B Data is divided into 100 sec bins |
 |
 |
| Module-wise count rates for Quadrant C Data is divided into 100 sec bins |
 |
 |
| Module-wise count rates for Quadrant D Data is divided into 100 sec bins |
 |
 |
| Parameter | Plot |
|---|---|
| CZT HV Monitor | 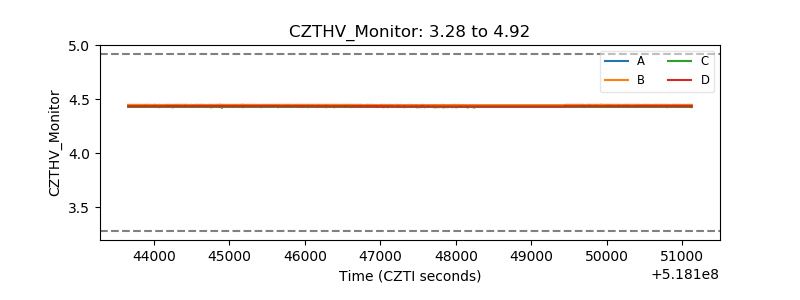 |
| D_VDD | 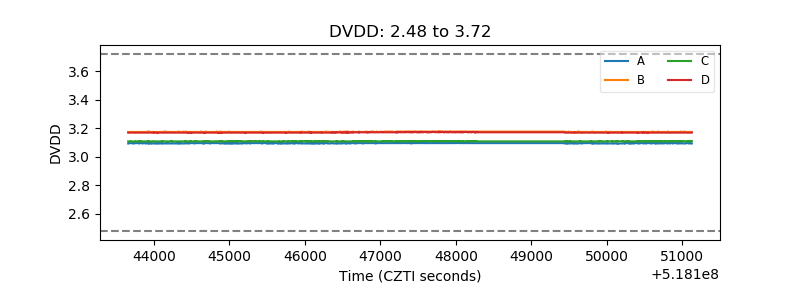 |
| Temperature 1 | 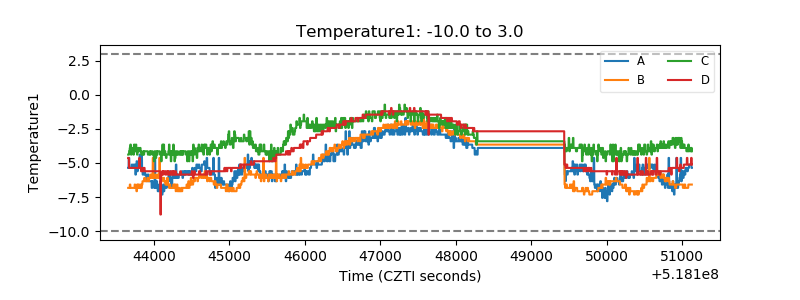 |
| Veto HV Monitor | 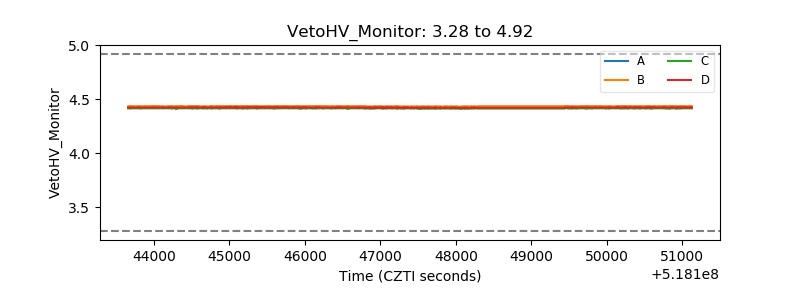 |
| Veto LLD | 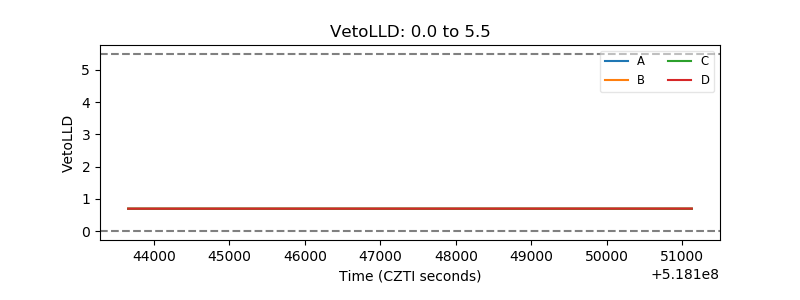 |
| Alpha Counter | 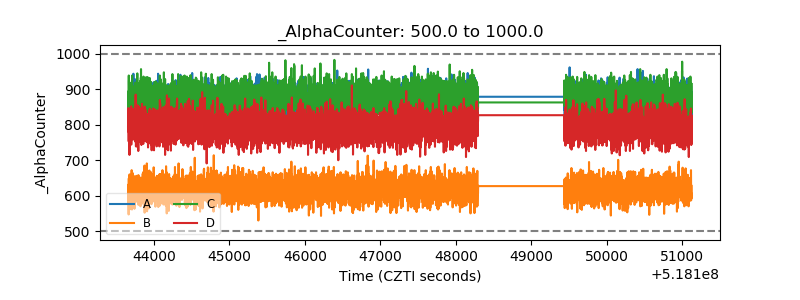 |
| _CPM_Rate | 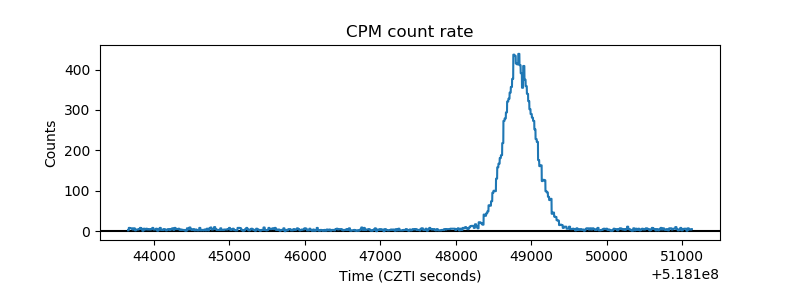 |
| CZT Counter | 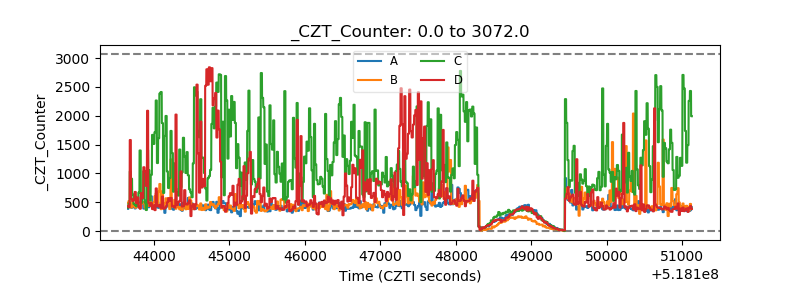 |
| +2.5 Volts monitor | 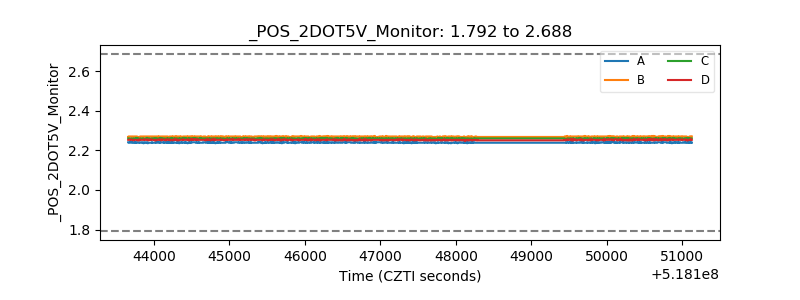 |
| +5 Volts monitor | 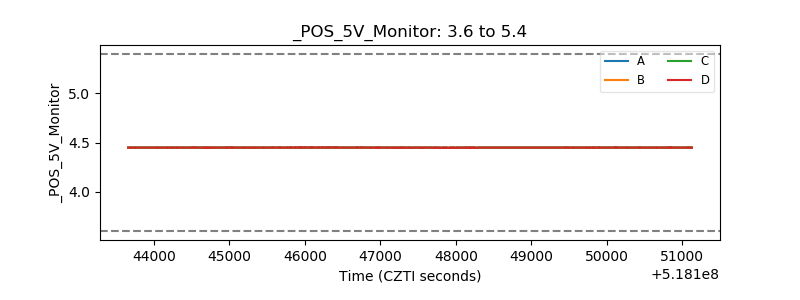 |
| _ROLL_ROT | 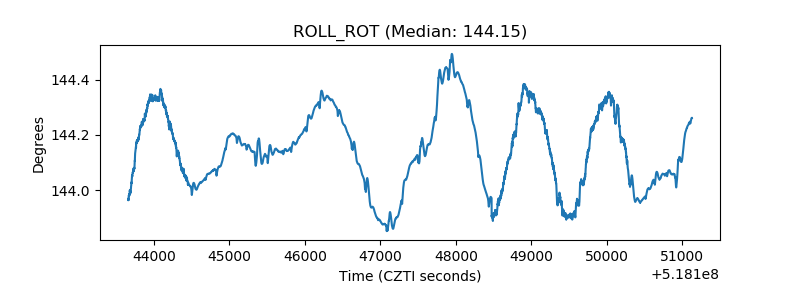 |
| _Roll_DEC | 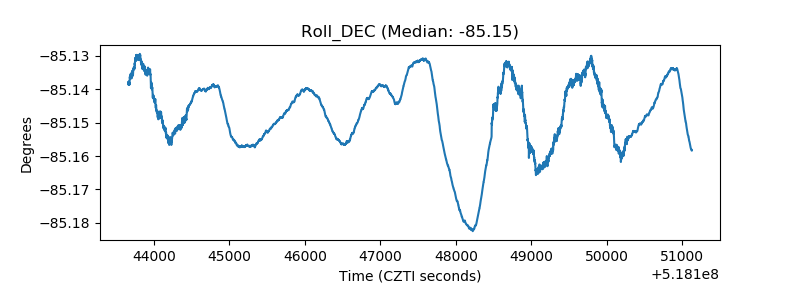 |
| _Roll_RA | 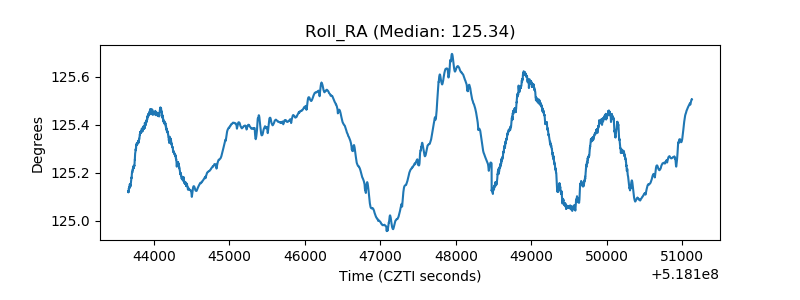 |
| Veto Counter | 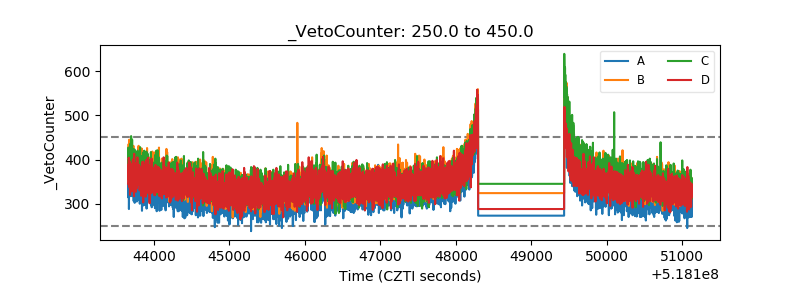 |