| Param | Original file | Final file |
|---|---|---|
| Filename | modeM0/AS1A14_083T16_9000006580_57788cztM0_level2.fits | modeM0/AS1A14_083T16_9000006580_57788cztM0_level2_quad_clean.evt |
| Size (bytes) | 501,937,920 | 95,564,160 |
| Size | 478.7 MB | 91.1 MB |
| Events in quadrant A | 2,821,112 | 643,372 |
| Events in quadrant B | 4,022,091 | 684,568 |
| Events in quadrant C | 7,855,140 | 537,894 |
| Events in quadrant D | 3,365,030 | 564,108 |
| Mode SS | |||
|---|---|---|---|
| Quadrant | BADHDUFLAG | Total packets | Discarded packets |
| A | 0 | 134 | 0 |
| B | 0 | 134 | 0 |
| C | 0 | 134 | 0 |
| D | 0 | 134 | 0 |
| Mode M0 | |||
|---|---|---|---|
| Quadrant | BADHDUFLAG | Total packets | Discarded packets |
| A | 0 | 13496 | 1 |
| B | 0 | 16652 | 1 |
| C | 0 | 28083 | 4 |
| D | 0 | 14944 | 1 |
| Mode M9 | |||
|---|---|---|---|
| Quadrant | BADHDUFLAG | Total packets | Discarded packets |
| A | 0 | 9 | 0 |
| B | 0 | 9 | 0 |
| C | 0 | 9 | 0 |
| D | 0 | 9 | 0 |
| Quadrant | Total seconds | Saturated seconds | Saturation percentage |
|---|---|---|---|
| A | 6654 | 52 | 0.781485% |
| B | 6654 | 167 | 2.509769% |
| C | 6654 | 1025 | 15.404268% |
| D | 6654 | 131 | 1.968741% |
Noise dominated data is calculated using 1-second bins in cleaned event files. If a bin has >2000 counts, and if more than 50% of those come from <1% of pixels, then it is considered to be noise-dominated and hence unusable.
| Quadrant | # 1 sec bins | Bins with >0 counts | Bins with >2000 counts | High rate bins dominated by noise | Noise dominated (total time) | Noise dominated (detector-on time) | Marked lightcurve |
|---|---|---|---|---|---|---|---|
| A | 7554 | 6655 | 0 | 0 | 0.00% | 0.00% | 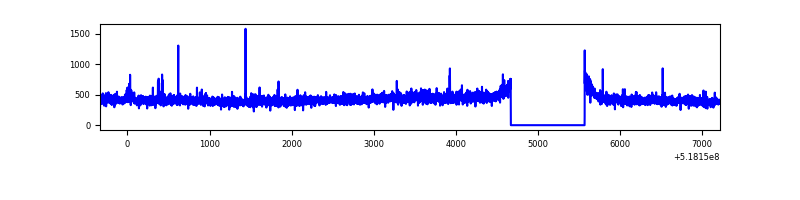 |
| B | 7554 | 6655 | 56 | 56 | 0.74% | 0.84% | 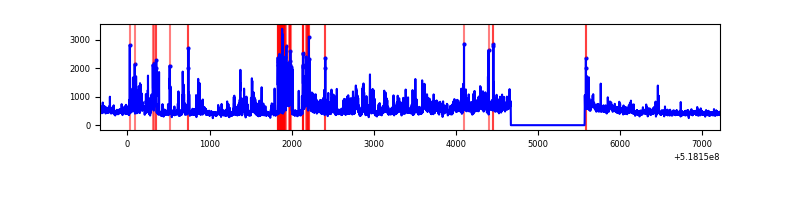 |
| C | 7554 | 6655 | 834 | 834 | 11.04% | 12.53% | 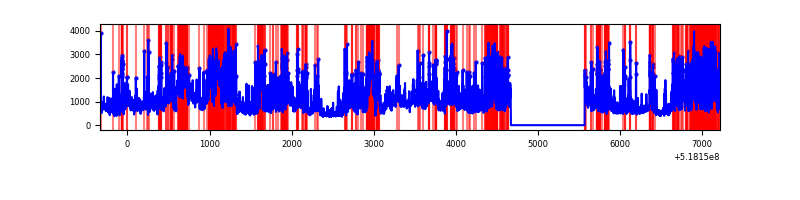 |
| D | 7554 | 6655 | 71 | 71 | 0.94% | 1.07% | 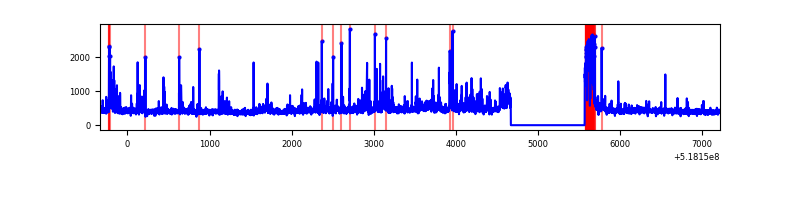 |
Top three noisy pixels from each quadrant. If the there are fewer than three noisy pixels in the level2.evt file, extra rows are filled as -1
| Pixel properties | Quadrant properties | ||||||
|---|---|---|---|---|---|---|---|
| Quadrant | DetID | PixID | Counts | Sigma | Mean | Median | Sigma |
| A | 3 | 128 | 37418 | 211.89 | 705 | 688 | 173.3 |
| A | 4 | 158 | 19907 | 110.87 | 705 | 688 | 173.3 |
| A | 7 | 64 | 9178 | 48.98 | 705 | 688 | 173.3 |
| B | 4 | 80 | 496867 | 3338.28 | 698 | 670 | 148.6 |
| B | 10 | 247 | 493624 | 3316.46 | 698 | 670 | 148.6 |
| B | 0 | 63 | 66760 | 444.64 | 698 | 670 | 148.6 |
| C | 9 | 38 | 3392953 | 19081.77 | 653 | 647 | 177.8 |
| C | 15 | 224 | 1670546 | 9393.21 | 653 | 647 | 177.8 |
| C | 14 | 254 | 90189 | 503.68 | 653 | 647 | 177.8 |
| D | 8 | 160 | 288688 | 1510.53 | 677 | 645 | 190.7 |
| D | 2 | 153 | 185327 | 968.49 | 677 | 645 | 190.7 |
| D | 3 | 12 | 98058 | 510.84 | 677 | 645 | 190.7 |
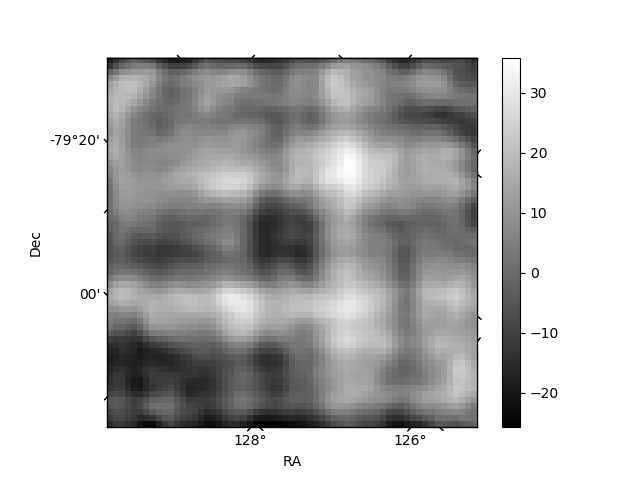
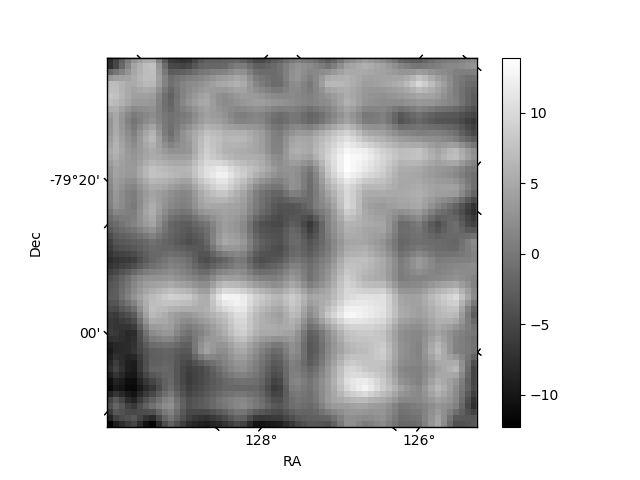
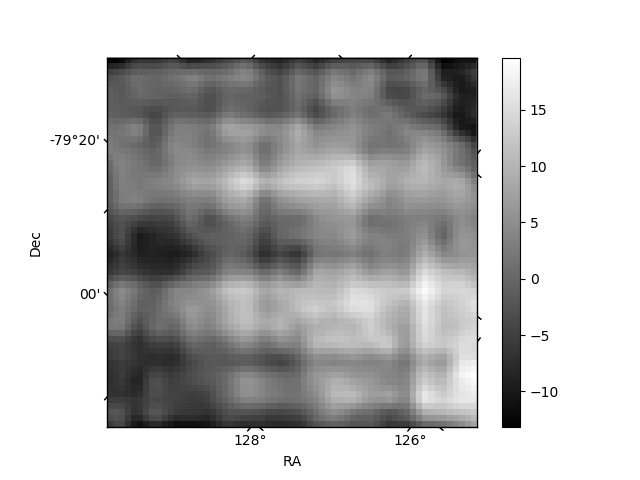
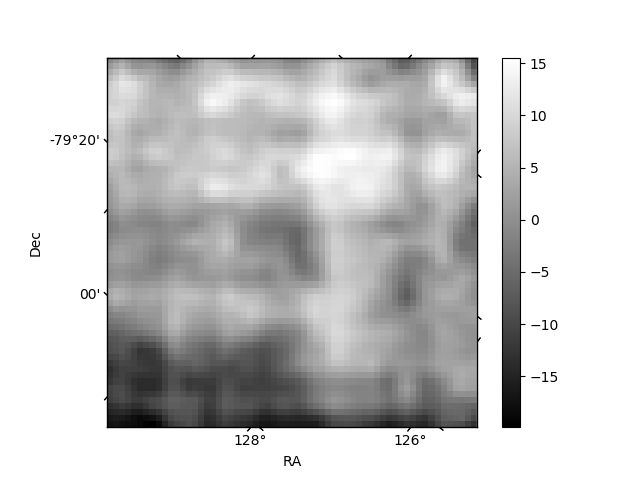
Histogram calculated using DETX and DETY for each event in the final _common_clean file
| Quadrant A | 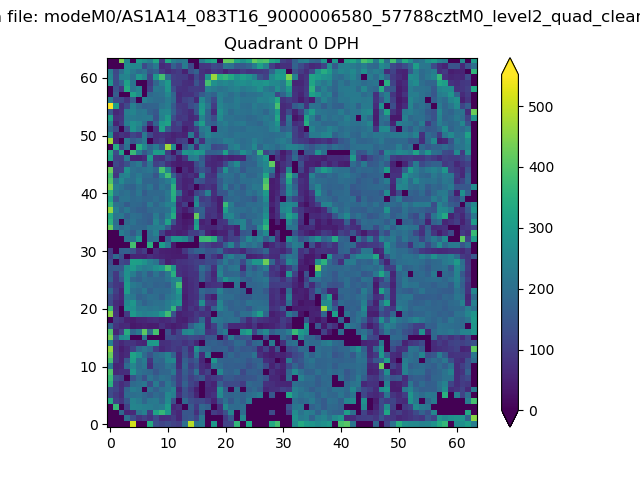 |
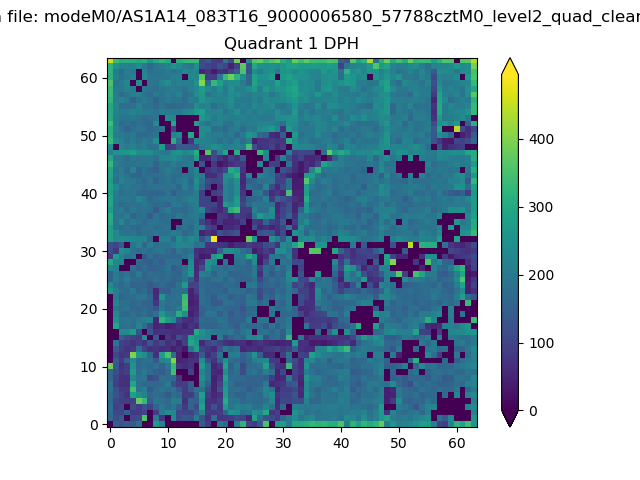 |
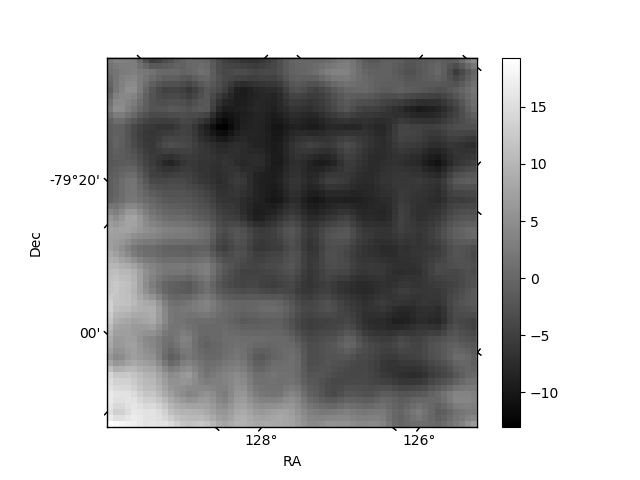
Quadrant B |
|---|---|---|---|
| Quadrant D | 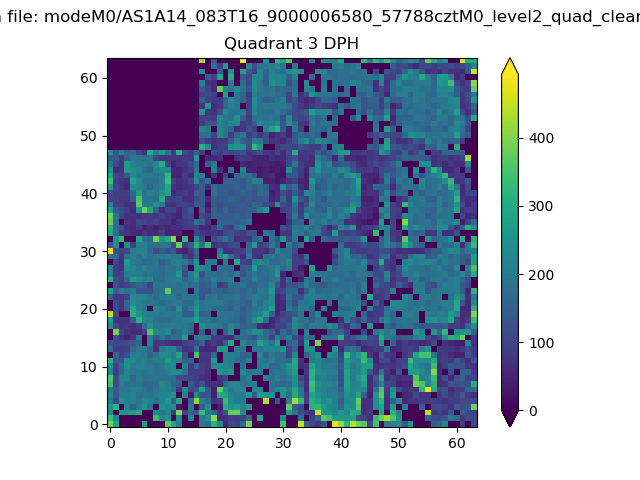 |
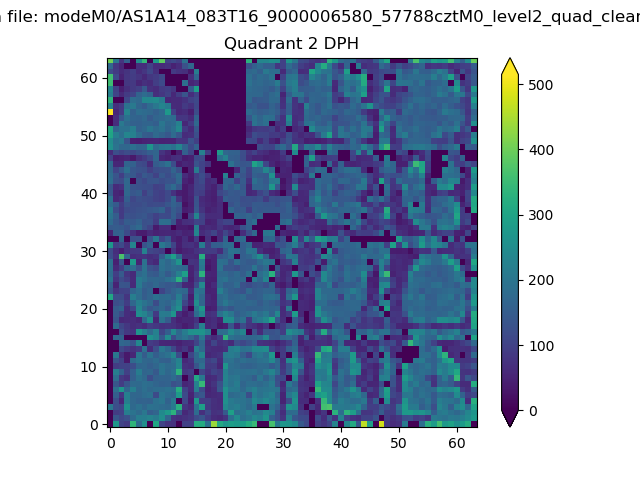 |
Quadrant C |
| Plot type | Count rate plots | Images |
|---|---|---|
| Comparison with Poisson distribution Blue bars denote a histogram of data divided into 1 sec bins. Red curve is a Poisson curve with rate = median count rate of data. |
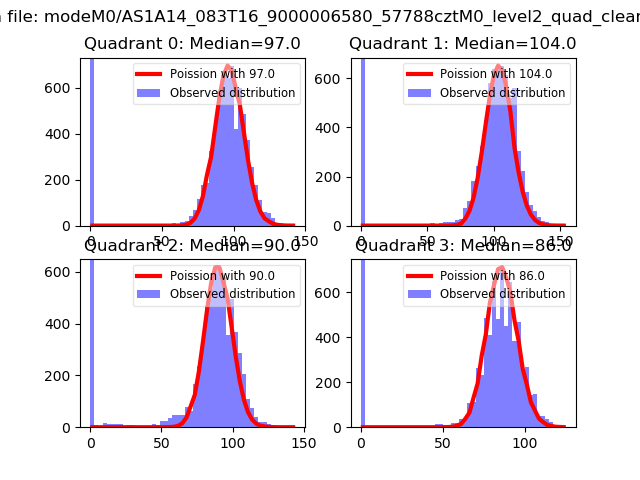 |
 |
| Quadrant-wise count rates Data is divided into 100 sec bins |
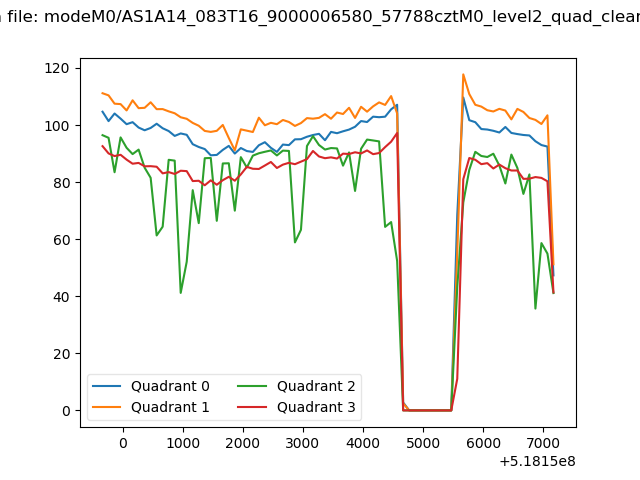 |
|
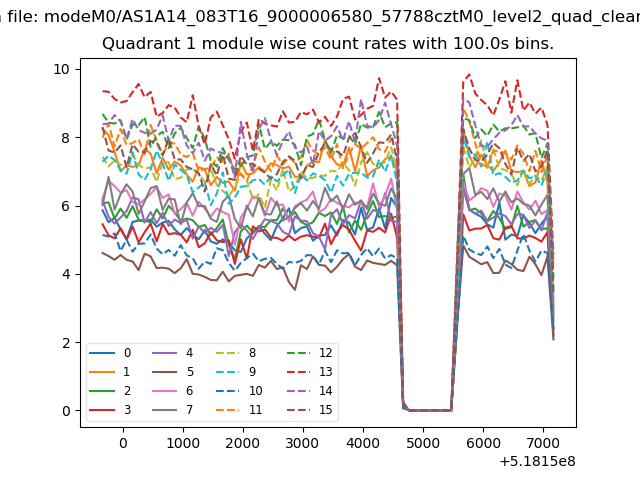
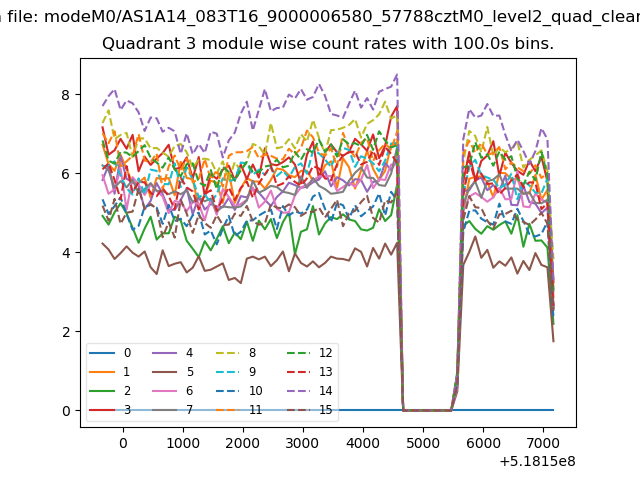
| Module-wise count rates for Quadrant A Data is divided into 100 sec bins |
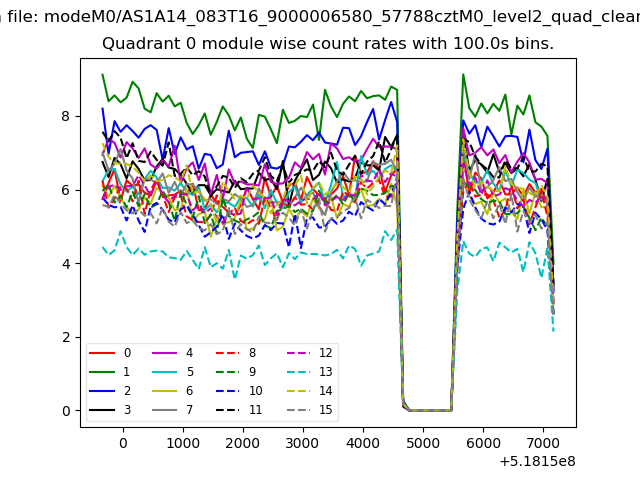 |
 |
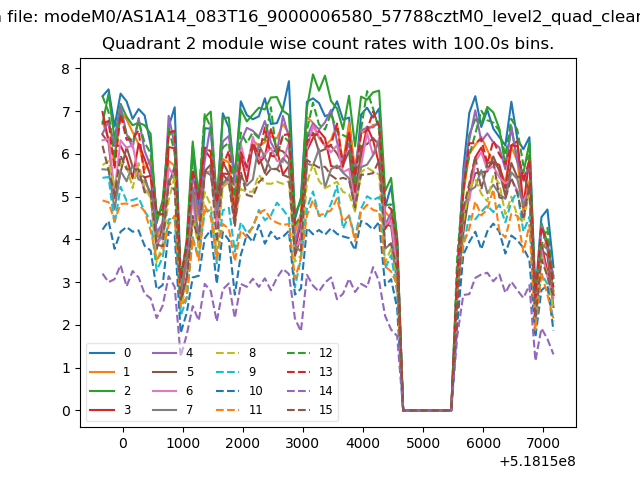
| Module-wise count rates for Quadrant B Data is divided into 100 sec bins |
 |
 |
| Module-wise count rates for Quadrant C Data is divided into 100 sec bins |
 |
 |
| Module-wise count rates for Quadrant D Data is divided into 100 sec bins |
 |
 |
| Parameter | Plot |
|---|---|
| CZT HV Monitor | 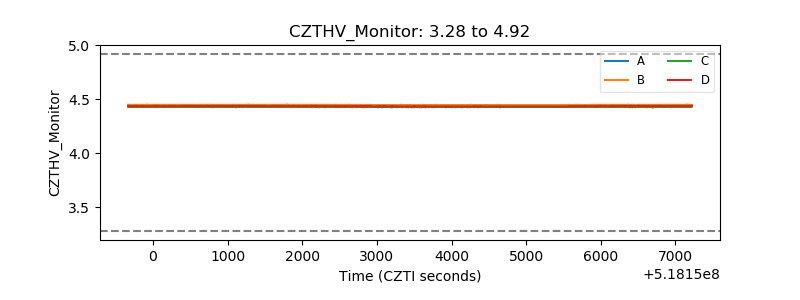 |
| D_VDD | 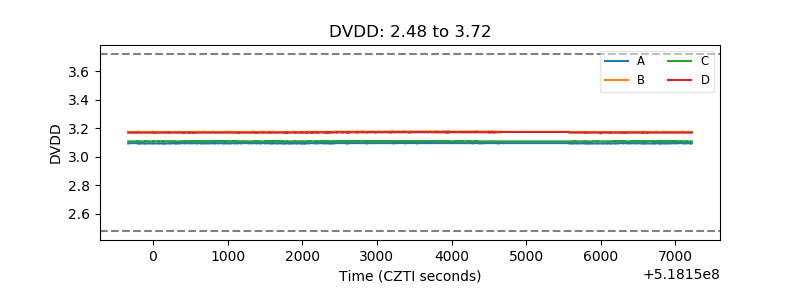 |
| Temperature 1 | 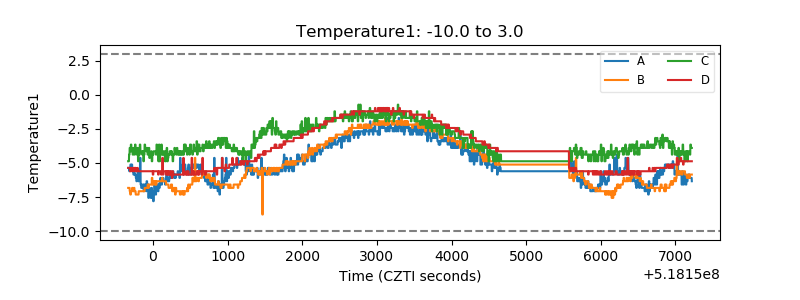 |
| Veto HV Monitor | 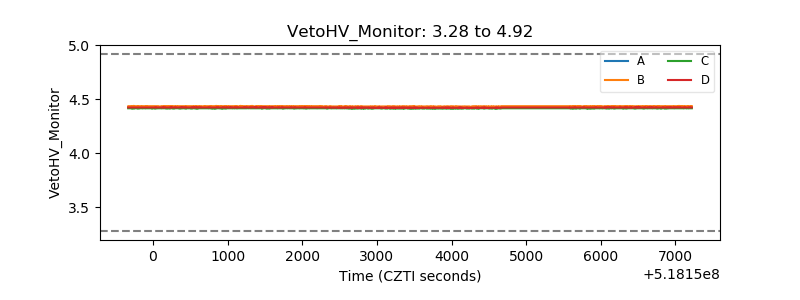 |
| Veto LLD | 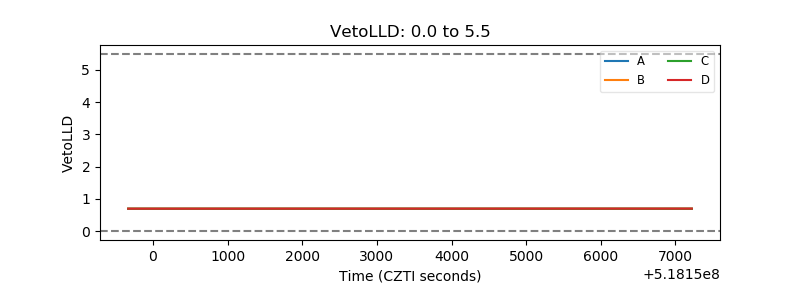 |
| Alpha Counter | 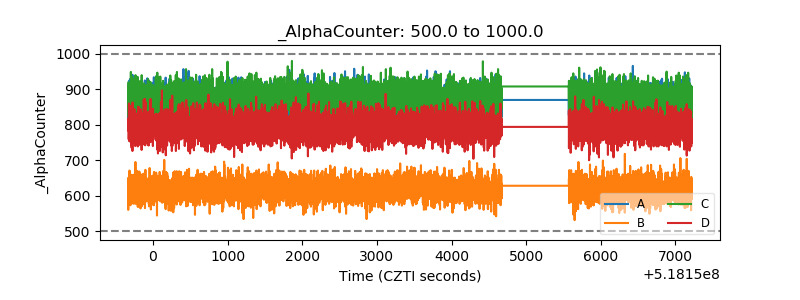 |
| _CPM_Rate | 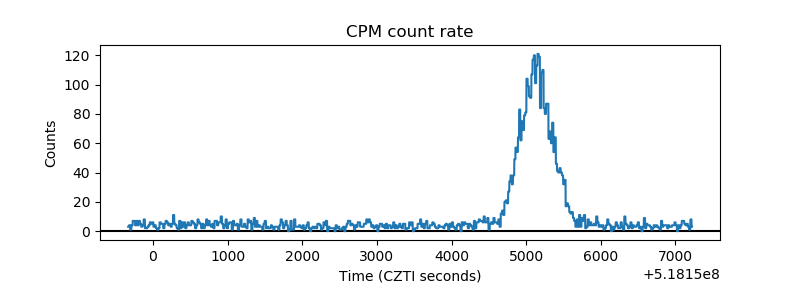 |
| CZT Counter | 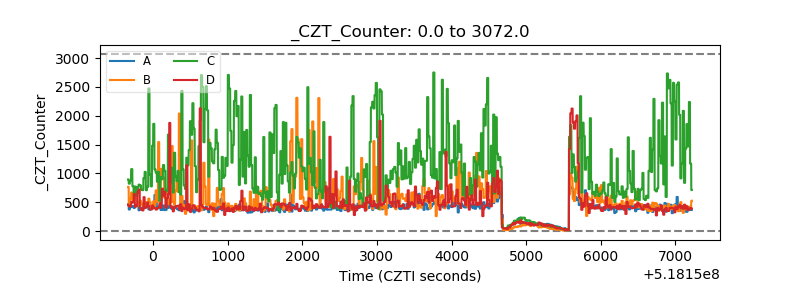 |
| +2.5 Volts monitor |  |
| +5 Volts monitor | 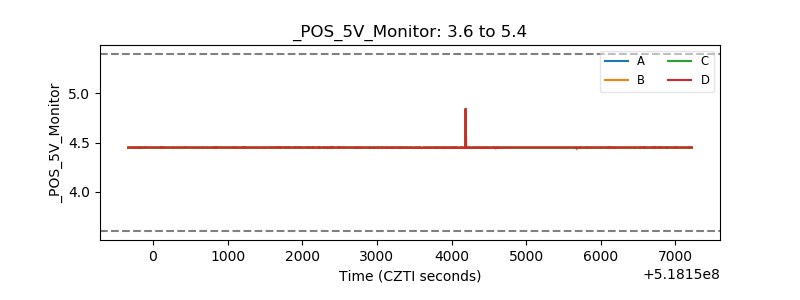 |
| _ROLL_ROT | 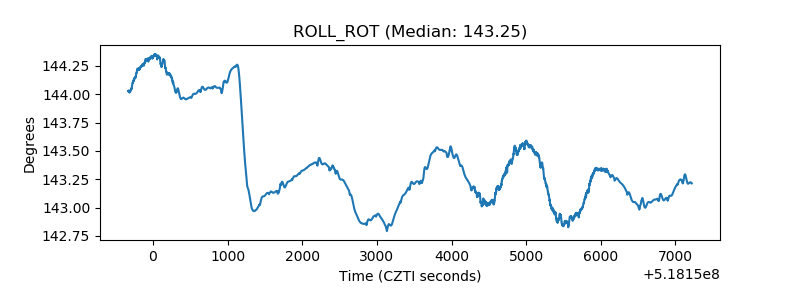 |
| _Roll_DEC | 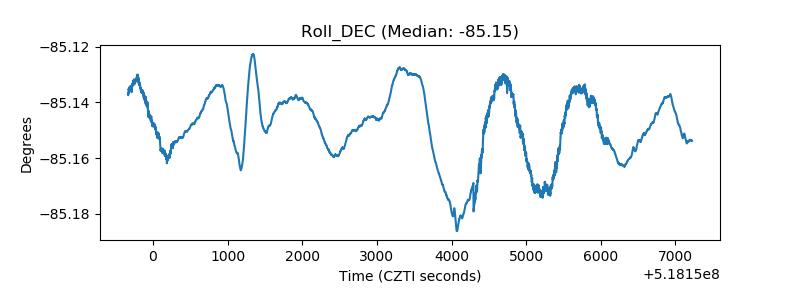 |
| _Roll_RA | 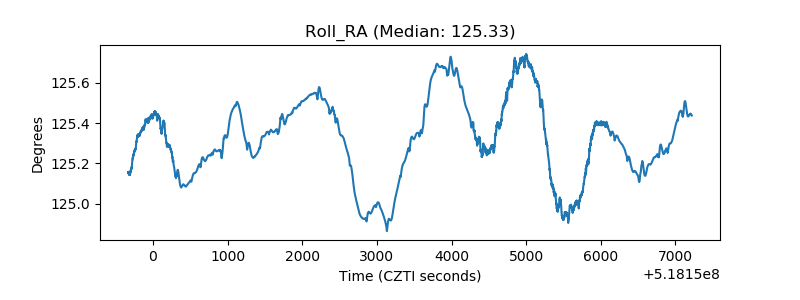 |
| Veto Counter | 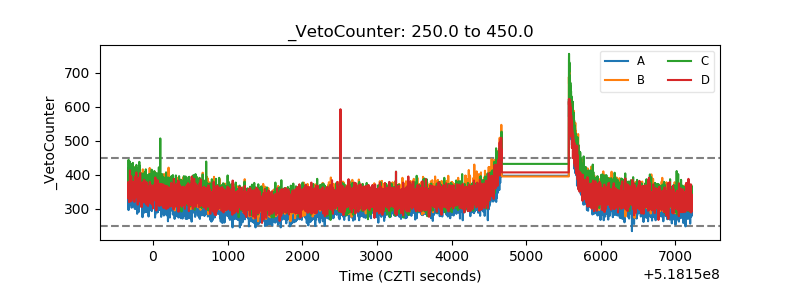 |