| Param | Original file | Final file |
|---|---|---|
| Filename | modeM0/AS1A14_083T16_9000006580_57790cztM0_level2.fits | modeM0/AS1A14_083T16_9000006580_57790cztM0_level2_quad_clean.evt |
| Size (bytes) | 664,678,080 | 99,357,120 |
| Size | 633.9 MB | 94.8 MB |
| Events in quadrant A | 3,221,236 | 704,319 |
| Events in quadrant B | 3,922,166 | 752,245 |
| Events in quadrant C | 12,429,329 | 411,572 |
| Events in quadrant D | 4,453,974 | 622,551 |
| Mode SS | |||
|---|---|---|---|
| Quadrant | BADHDUFLAG | Total packets | Discarded packets |
| A | 0 | 148 | 0 |
| B | 0 | 148 | 0 |
| C | 0 | 148 | 0 |
| D | 0 | 148 | 0 |
| Mode M0 | |||
|---|---|---|---|
| Quadrant | BADHDUFLAG | Total packets | Discarded packets |
| A | 0 | 15162 | 0 |
| B | 0 | 17006 | 0 |
| C | 0 | 42103 | 0 |
| D | 0 | 18574 | 0 |
| Quadrant | Total seconds | Saturated seconds | Saturation percentage |
|---|---|---|---|
| A | 7436 | 13 | 0.174825% |
| B | 7436 | 133 | 1.788596% |
| C | 7436 | 3351 | 45.064551% |
| D | 7436 | 173 | 2.326520% |
Noise dominated data is calculated using 1-second bins in cleaned event files. If a bin has >2000 counts, and if more than 50% of those come from <1% of pixels, then it is considered to be noise-dominated and hence unusable.
| Quadrant | # 1 sec bins | Bins with >0 counts | Bins with >2000 counts | High rate bins dominated by noise | Noise dominated (total time) | Noise dominated (detector-on time) | Marked lightcurve |
|---|---|---|---|---|---|---|---|
| A | 7436 | 7436 | 0 | 0 | 0.00% | 0.00% | 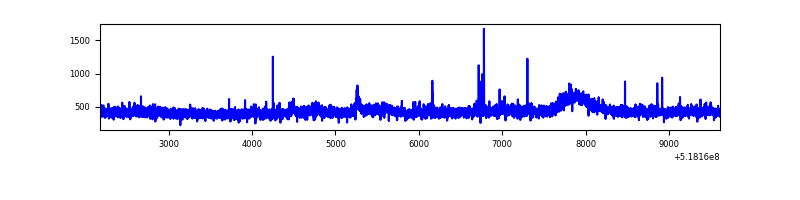 |
| B | 7436 | 7436 | 43 | 43 | 0.58% | 0.58% | 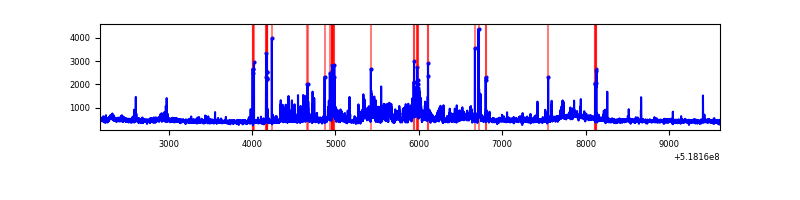 |
| C | 7436 | 7436 | 2854 | 2854 | 38.38% | 38.38% | 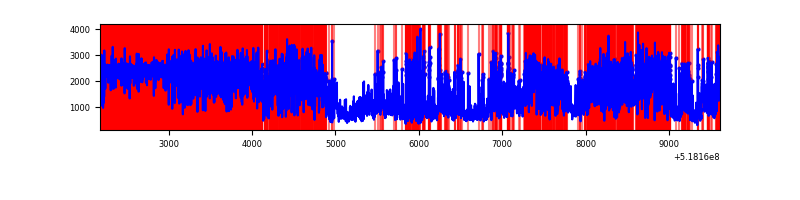 |
| D | 7436 | 7436 | 159 | 159 | 2.14% | 2.14% | 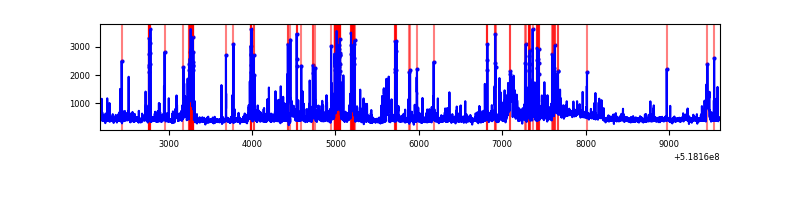 |
Top three noisy pixels from each quadrant. If the there are fewer than three noisy pixels in the level2.evt file, extra rows are filled as -1
| Pixel properties | Quadrant properties | ||||||
|---|---|---|---|---|---|---|---|
| Quadrant | DetID | PixID | Counts | Sigma | Mean | Median | Sigma |
| A | 3 | 128 | 114275 | 579.37 | 794 | 773 | 195.9 |
| A | 3 | 245 | 15575 | 75.56 | 794 | 773 | 195.9 |
| A | 7 | 64 | 15001 | 72.63 | 794 | 773 | 195.9 |
| B | 4 | 80 | 338762 | 2020.45 | 784 | 755 | 167.3 |
| B | 4 | 158 | 139555 | 829.68 | 784 | 755 | 167.3 |
| B | 10 | 247 | 82107 | 486.28 | 784 | 755 | 167.3 |
| C | 9 | 38 | 7044802 | 39860.39 | 649 | 643 | 176.7 |
| C | 15 | 224 | 2695576 | 15249.67 | 649 | 643 | 176.7 |
| C | 14 | 246 | 52580 | 293.89 | 649 | 643 | 176.7 |
| D | 2 | 153 | 603255 | 2819.75 | 764 | 730 | 213.7 |
| D | 3 | 12 | 219581 | 1024.2 | 764 | 730 | 213.7 |
| D | 12 | 0 | 165869 | 772.83 | 764 | 730 | 213.7 |
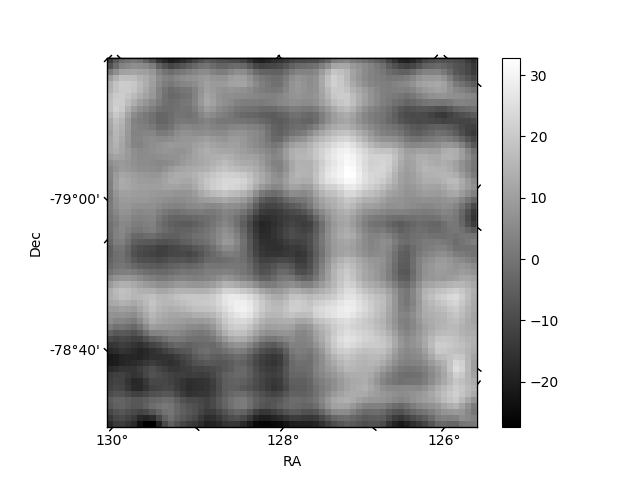
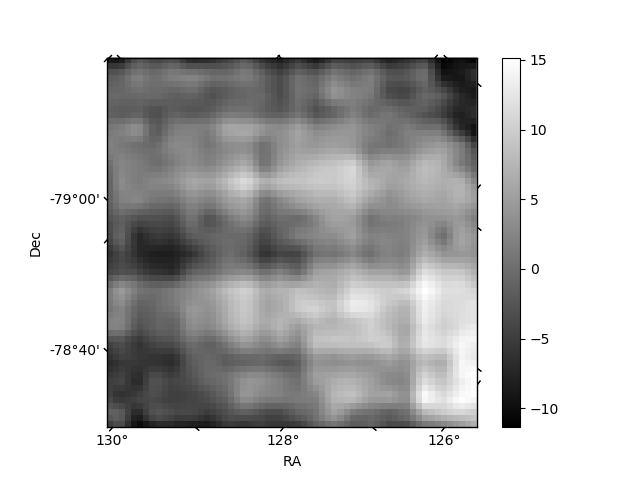
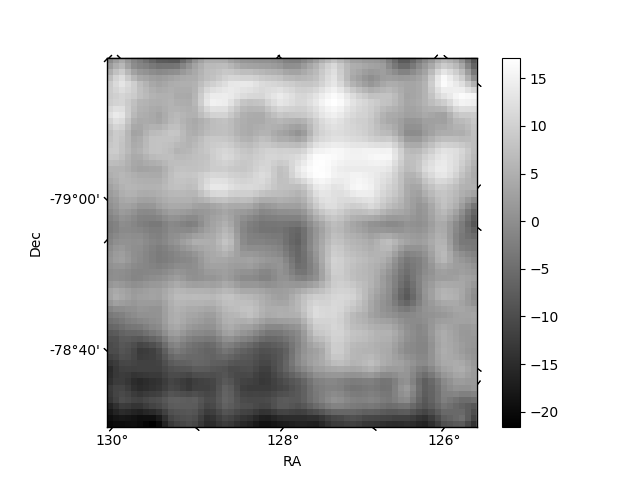
Histogram calculated using DETX and DETY for each event in the final _common_clean file
| Quadrant A | 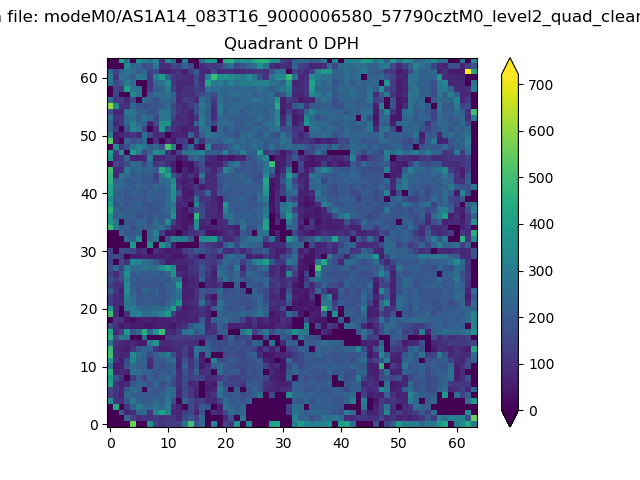 |
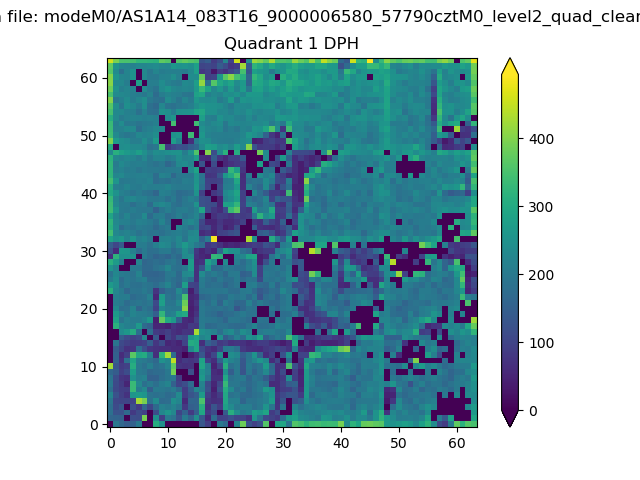 |
Quadrant B |
|---|---|---|---|
| Quadrant D | 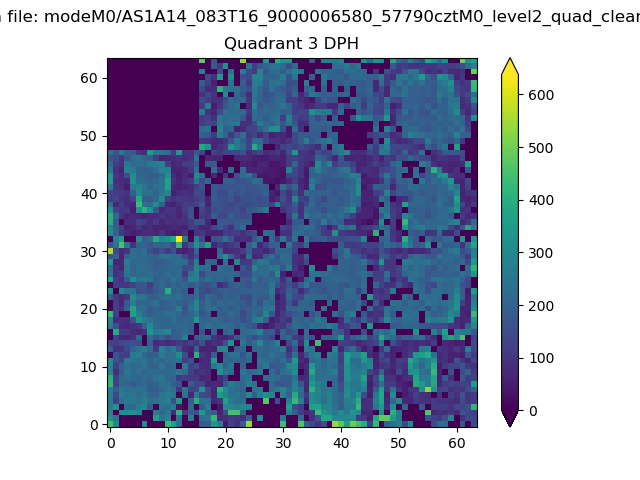 |
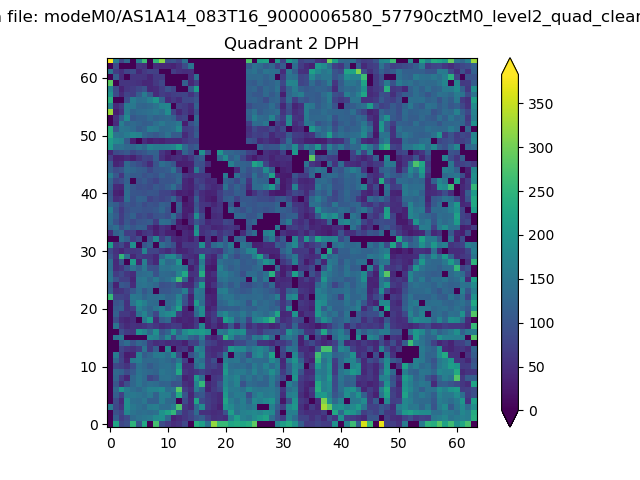 |
Quadrant C |
| Plot type | Count rate plots | Images |
|---|---|---|
| Comparison with Poisson distribution Blue bars denote a histogram of data divided into 1 sec bins. Red curve is a Poisson curve with rate = median count rate of data. |
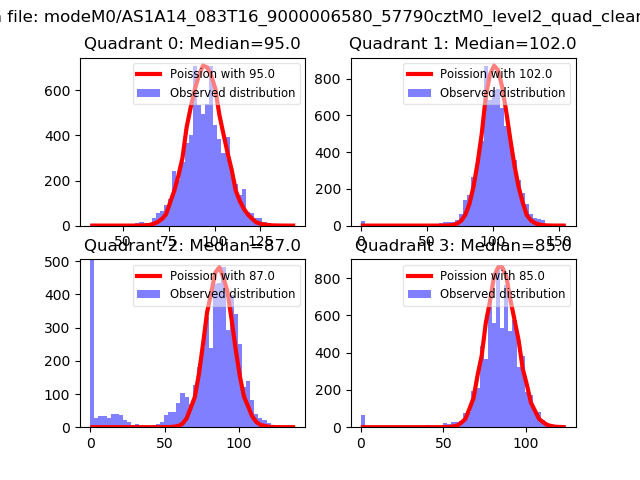 |
 |
| Quadrant-wise count rates Data is divided into 100 sec bins |
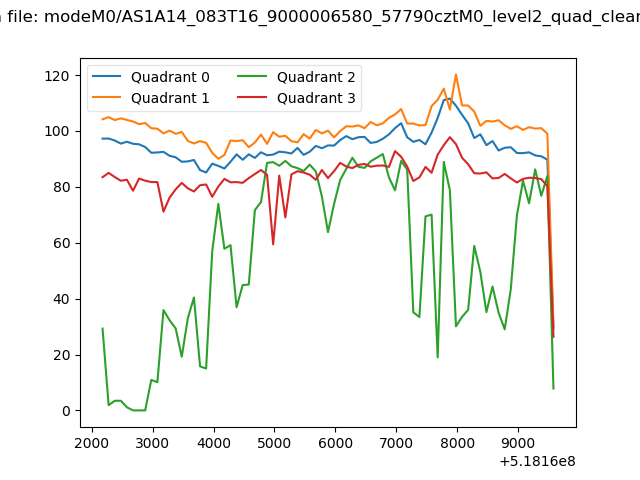 |
|
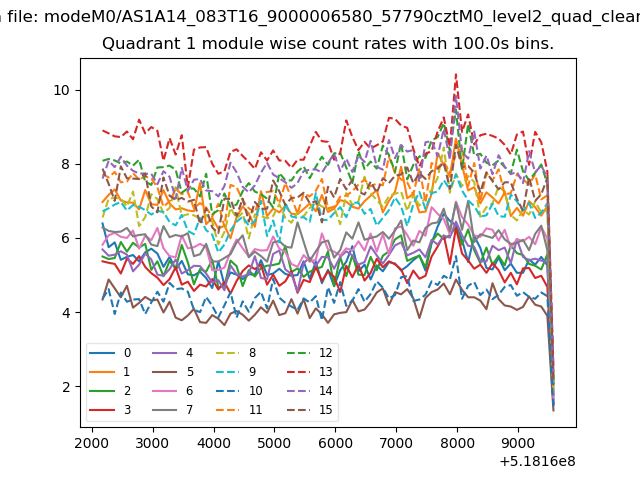
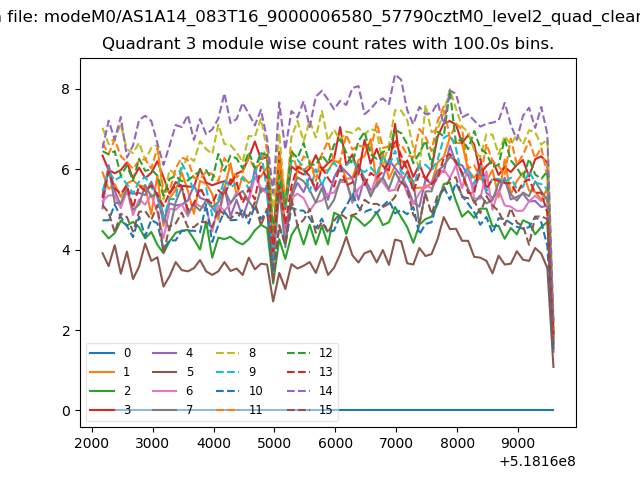
| Module-wise count rates for Quadrant A Data is divided into 100 sec bins |
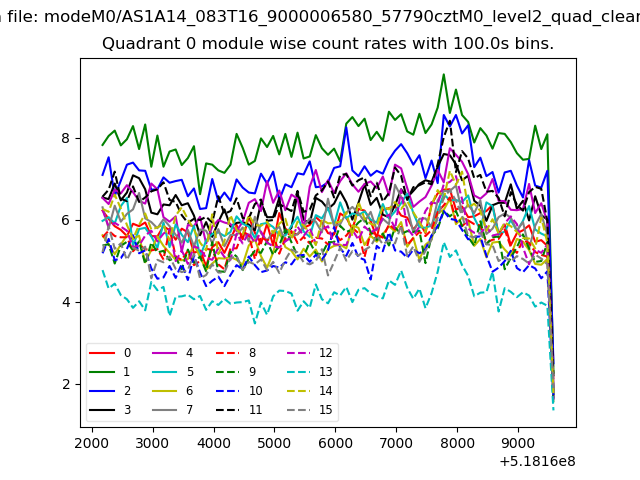 |
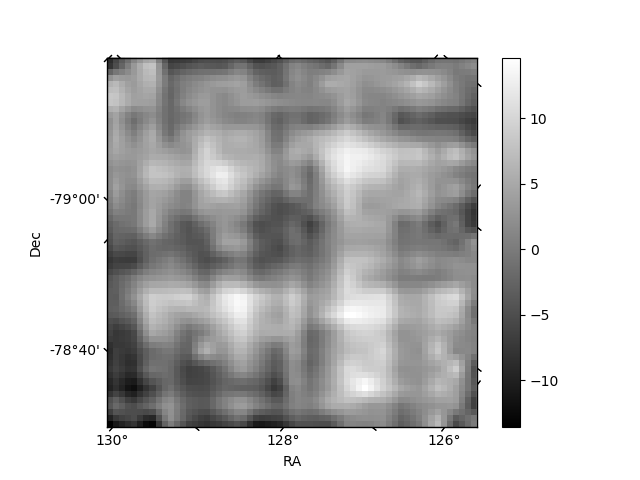 |
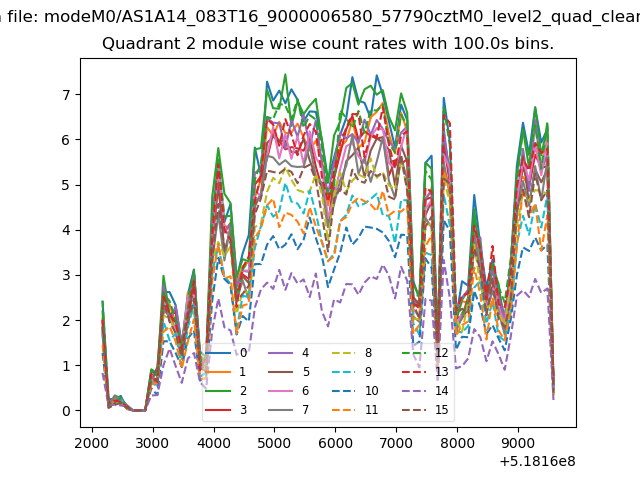
| Module-wise count rates for Quadrant B Data is divided into 100 sec bins |
 |
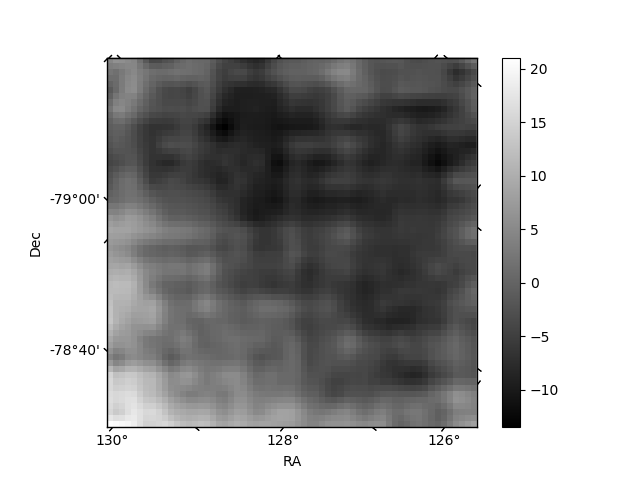 |
| Module-wise count rates for Quadrant C Data is divided into 100 sec bins |
 |
 |
| Module-wise count rates for Quadrant D Data is divided into 100 sec bins |
 |
 |
| Parameter | Plot |
|---|---|
| CZT HV Monitor | 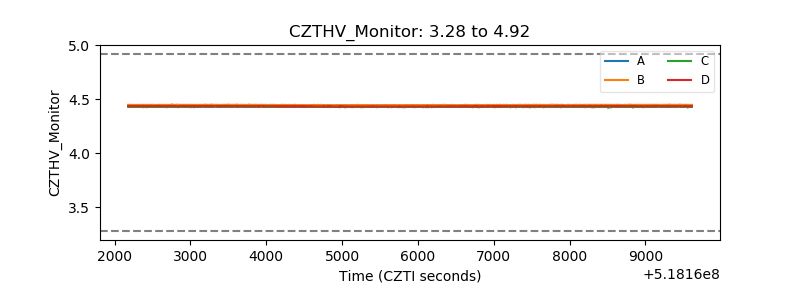 |
| D_VDD | 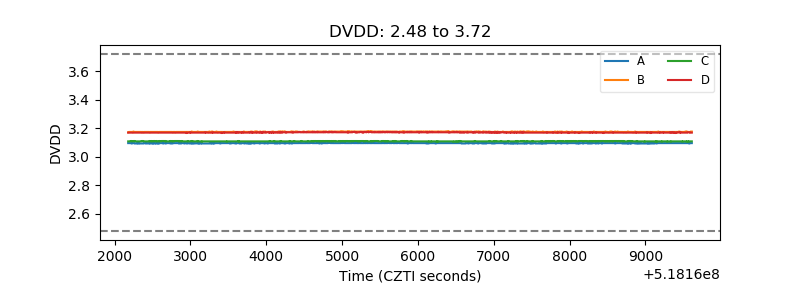 |
| Temperature 1 | 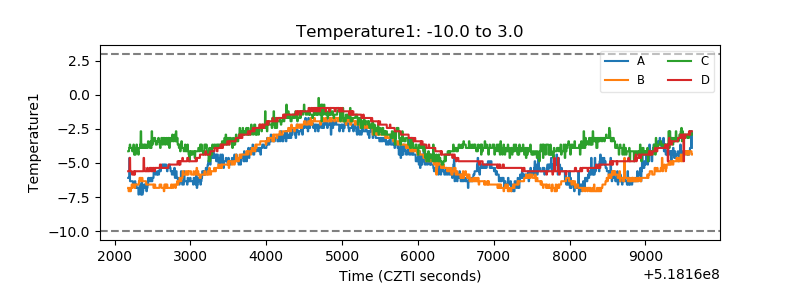 |
| Veto HV Monitor | 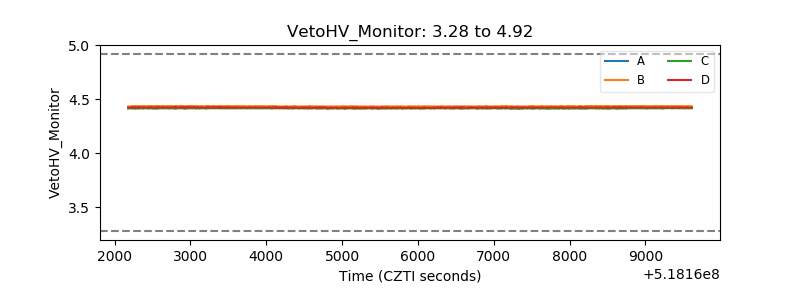 |
| Veto LLD | 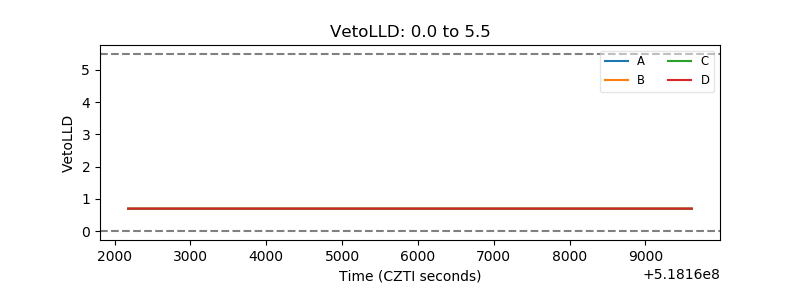 |
| Alpha Counter | 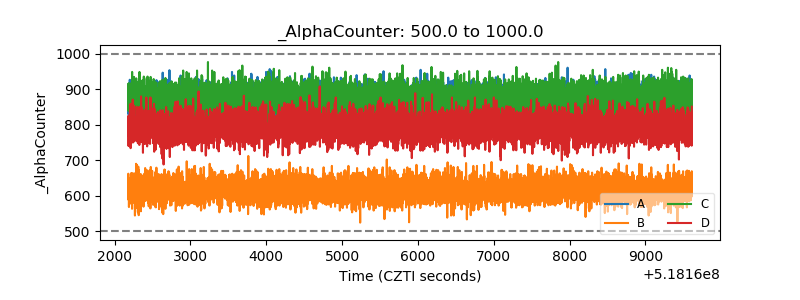 |
| _CPM_Rate | 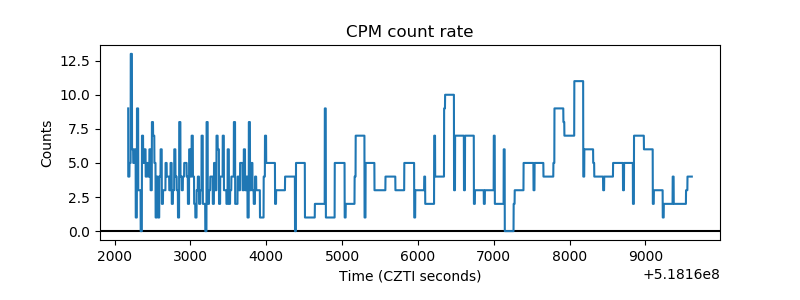 |
| CZT Counter | 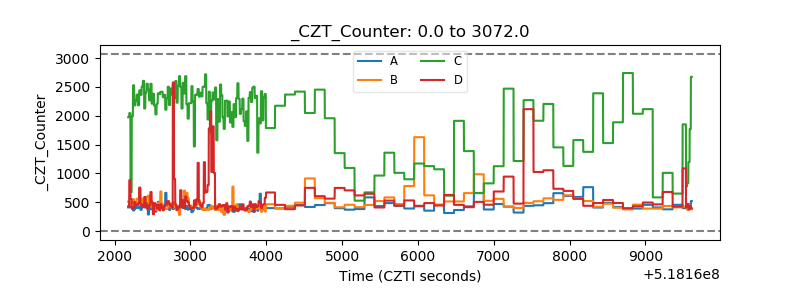 |
| +2.5 Volts monitor | 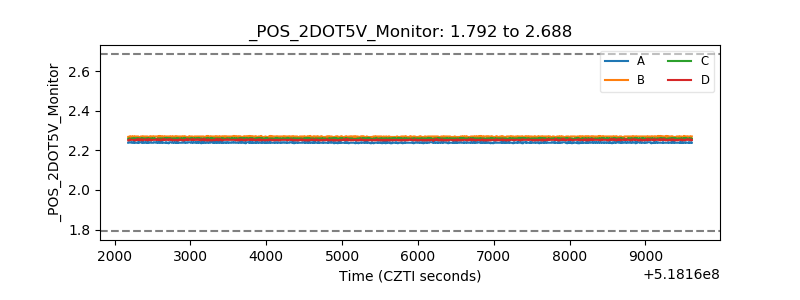 |
| +5 Volts monitor |  |
| _ROLL_ROT | 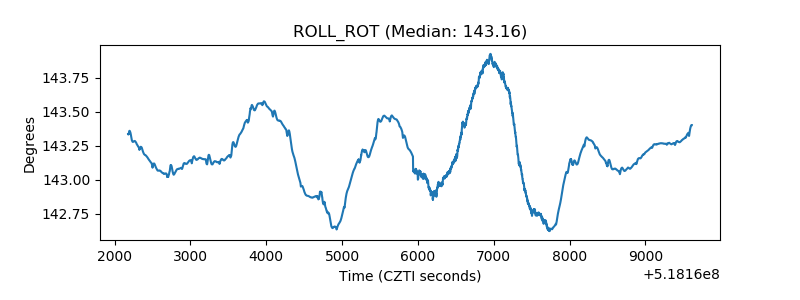 |
| _Roll_DEC | 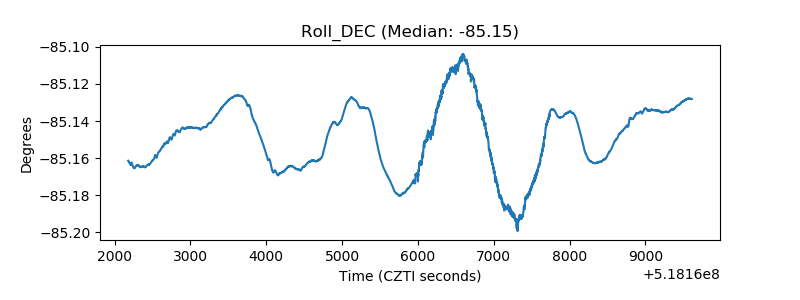 |
| _Roll_RA | 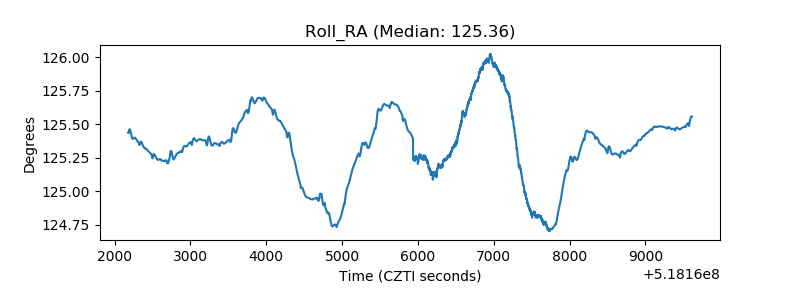 |
| Veto Counter |  |