| Param | Original file | Final file |
|---|---|---|
| Filename | modeM0/AS1A14_083T16_9000006580_57791cztM0_level2.fits | modeM0/AS1A14_083T16_9000006580_57791cztM0_level2_quad_clean.evt |
| Size (bytes) | 617,129,280 | 101,266,560 |
| Size | 588.5 MB | 96.6 MB |
| Events in quadrant A | 3,224,790 | 690,645 |
| Events in quadrant B | 4,443,721 | 712,681 |
| Events in quadrant C | 10,549,858 | 535,418 |
| Events in quadrant D | 4,055,511 | 615,569 |
| Mode SS | |||
|---|---|---|---|
| Quadrant | BADHDUFLAG | Total packets | Discarded packets |
| A | 0 | 146 | 0 |
| B | 0 | 146 | 0 |
| C | 0 | 146 | 0 |
| D | 0 | 146 | 0 |
| Mode M0 | |||
|---|---|---|---|
| Quadrant | BADHDUFLAG | Total packets | Discarded packets |
| A | 0 | 14917 | 0 |
| B | 0 | 18488 | 0 |
| C | 0 | 36489 | 0 |
| D | 0 | 17298 | 0 |
| Quadrant | Total seconds | Saturated seconds | Saturation percentage |
|---|---|---|---|
| A | 7353 | 12 | 0.163199% |
| B | 7353 | 330 | 4.487964% |
| C | 7353 | 1861 | 25.309398% |
| D | 7353 | 106 | 1.441588% |
Noise dominated data is calculated using 1-second bins in cleaned event files. If a bin has >2000 counts, and if more than 50% of those come from <1% of pixels, then it is considered to be noise-dominated and hence unusable.
| Quadrant | # 1 sec bins | Bins with >0 counts | Bins with >2000 counts | High rate bins dominated by noise | Noise dominated (total time) | Noise dominated (detector-on time) | Marked lightcurve |
|---|---|---|---|---|---|---|---|
| A | 7353 | 7353 | 2 | 2 | 0.03% | 0.03% | 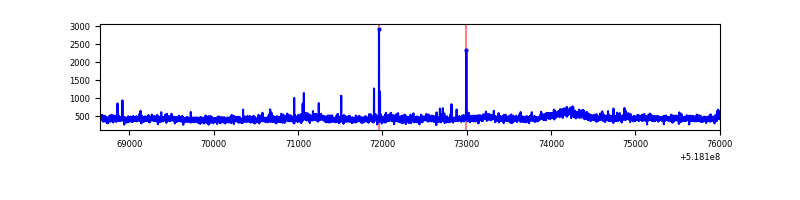 |
| B | 7353 | 7353 | 250 | 250 | 3.40% | 3.40% | 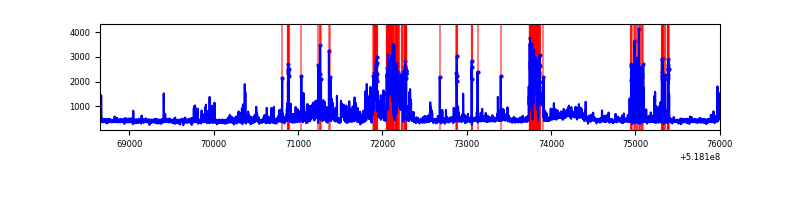 |
| C | 7353 | 7353 | 1540 | 1540 | 20.94% | 20.94% | 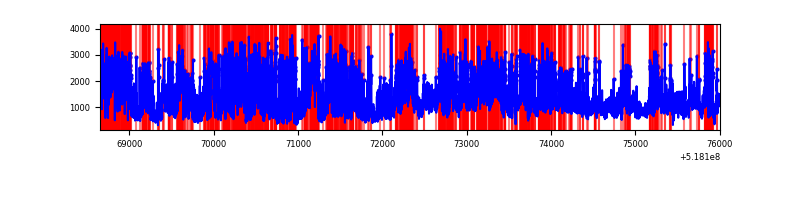 |
| D | 7353 | 7353 | 100 | 100 | 1.36% | 1.36% | 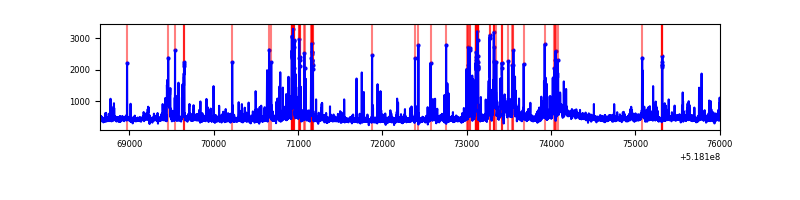 |
Top three noisy pixels from each quadrant. If the there are fewer than three noisy pixels in the level2.evt file, extra rows are filled as -1
| Pixel properties | Quadrant properties | ||||||
|---|---|---|---|---|---|---|---|
| Quadrant | DetID | PixID | Counts | Sigma | Mean | Median | Sigma |
| A | 3 | 128 | 180526 | 935.48 | 781 | 762 | 192.2 |
| A | 3 | 245 | 17605 | 87.65 | 781 | 762 | 192.2 |
| A | 3 | 137 | 9544 | 45.7 | 781 | 762 | 192.2 |
| B | 4 | 158 | 410512 | 2499.89 | 762 | 732 | 163.9 |
| B | 5 | 185 | 342647 | 2085.87 | 762 | 732 | 163.9 |
| B | 4 | 80 | 310290 | 1888.48 | 762 | 732 | 163.9 |
| C | 9 | 38 | 4324283 | 22941.73 | 696 | 689 | 188.5 |
| C | 15 | 224 | 2852055 | 15129.84 | 696 | 689 | 188.5 |
| C | 14 | 254 | 289129 | 1530.51 | 696 | 689 | 188.5 |
| D | 2 | 153 | 611928 | 2876.75 | 758 | 722 | 212.5 |
| D | 2 | 31 | 148684 | 696.41 | 758 | 722 | 212.5 |
| D | 3 | 12 | 80665 | 376.26 | 758 | 722 | 212.5 |
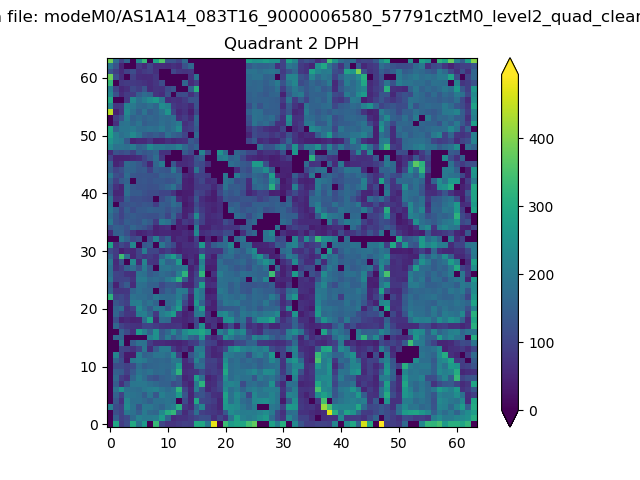
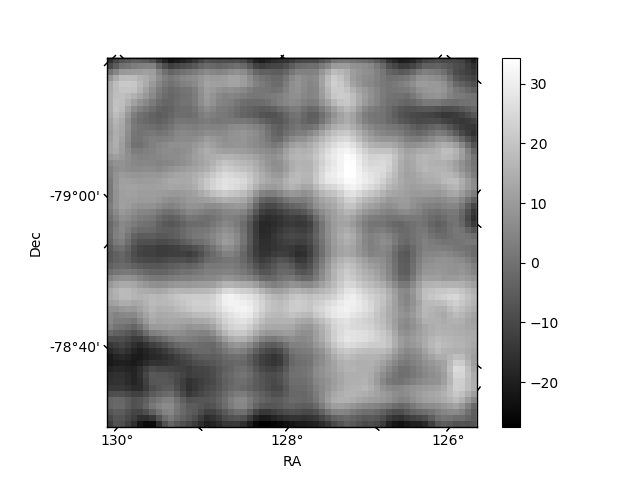
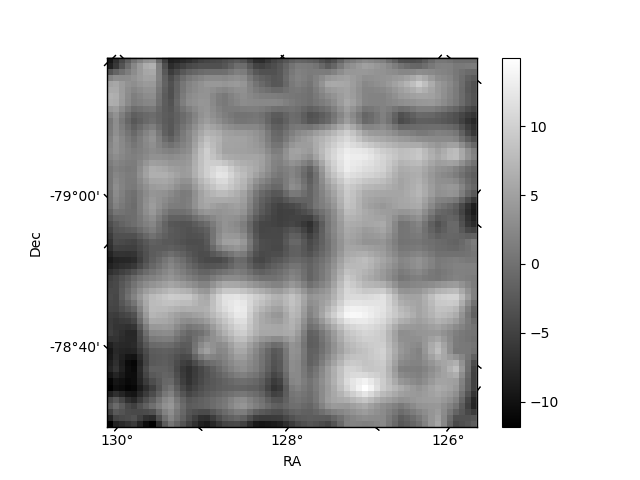
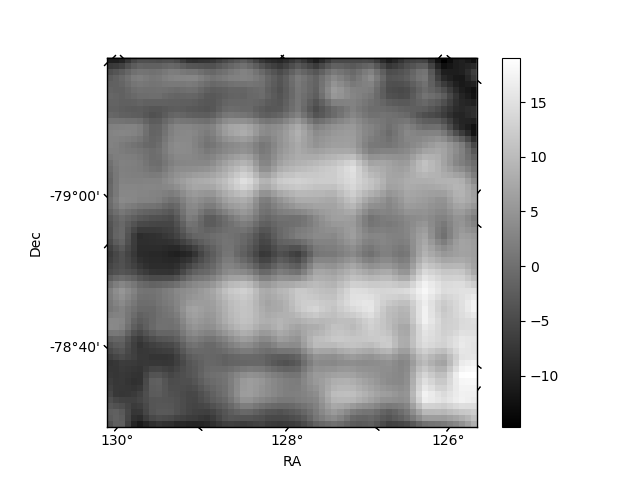
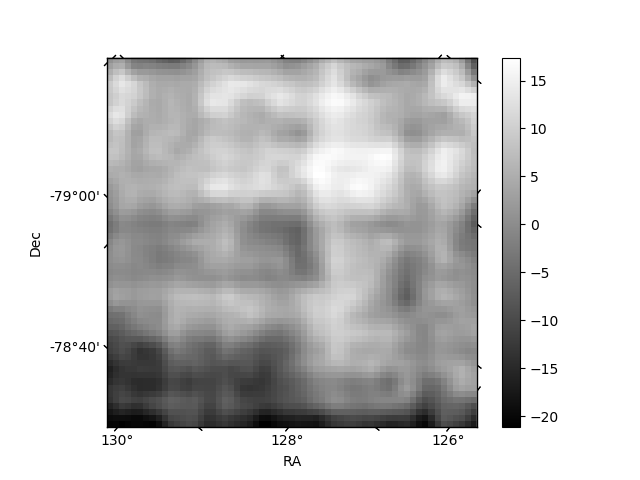
Histogram calculated using DETX and DETY for each event in the final _common_clean file
| Quadrant A | 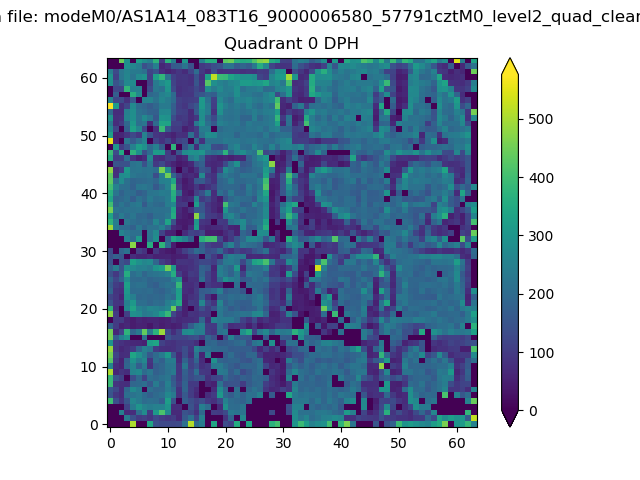 |
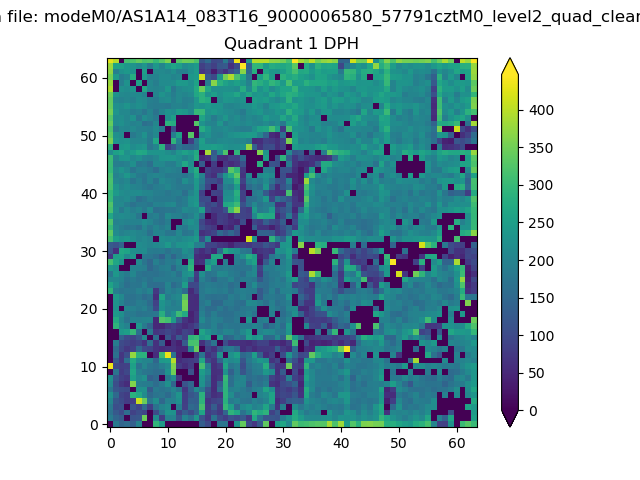 |
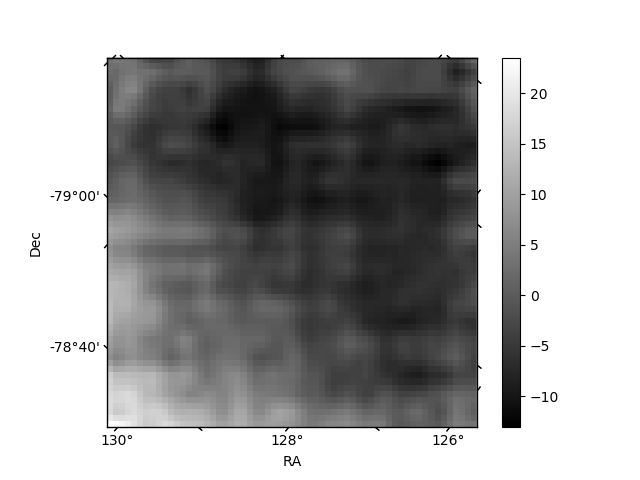
Quadrant B |
|---|---|---|---|
| Quadrant D | 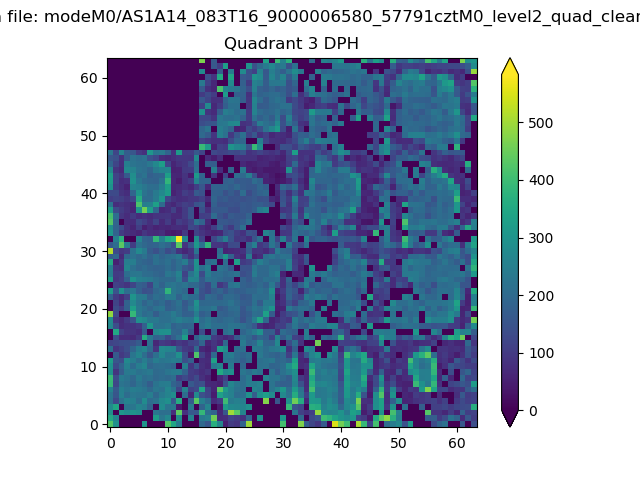 |
 |
Quadrant C |
| Plot type | Count rate plots | Images |
|---|---|---|
| Comparison with Poisson distribution Blue bars denote a histogram of data divided into 1 sec bins. Red curve is a Poisson curve with rate = median count rate of data. |
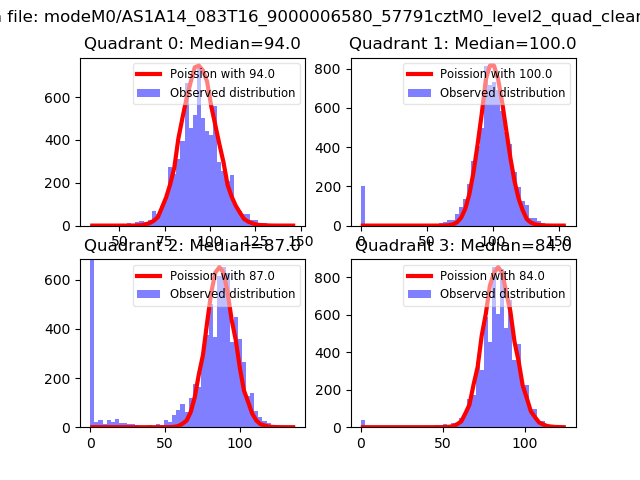 |
 |
| Quadrant-wise count rates Data is divided into 100 sec bins |
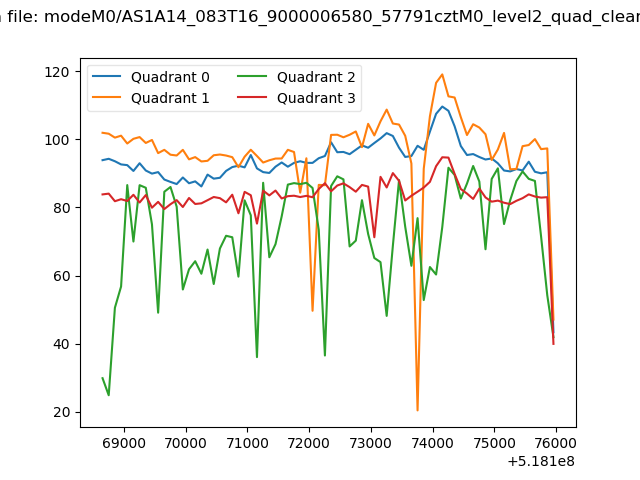 |
|
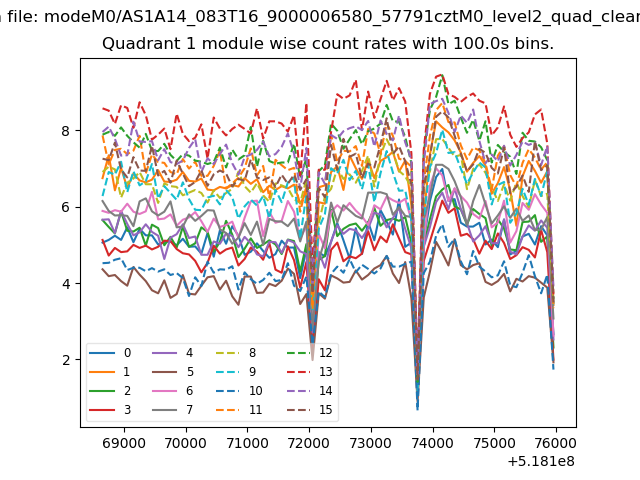
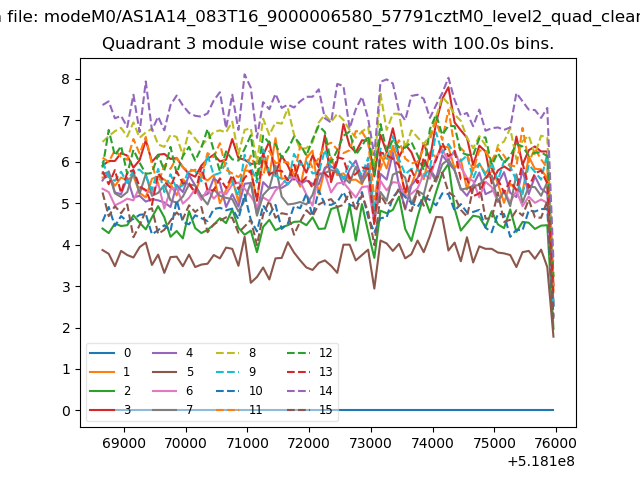
| Module-wise count rates for Quadrant A Data is divided into 100 sec bins |
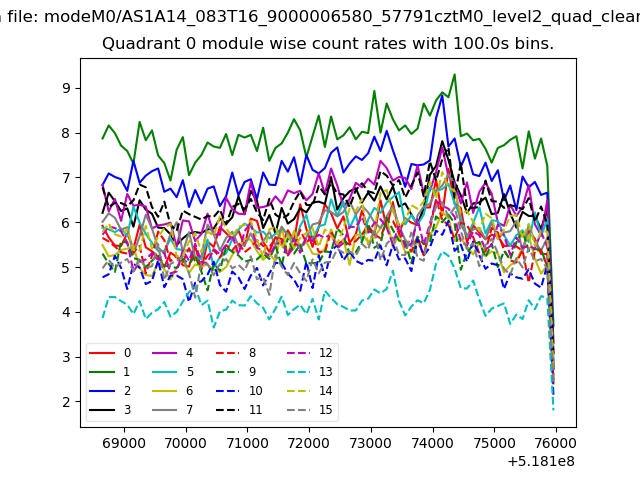 |
 |
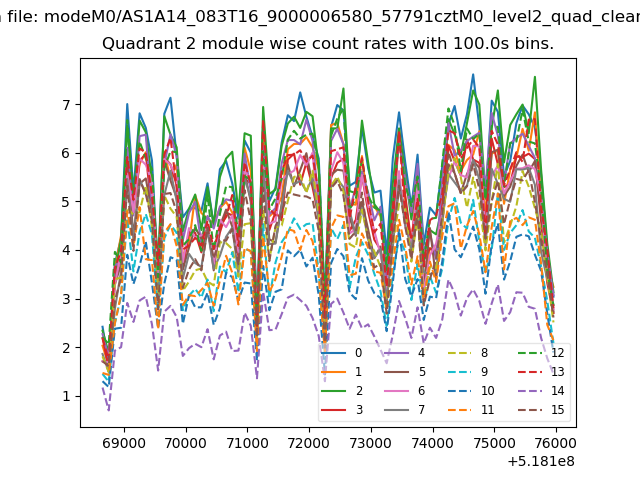
| Module-wise count rates for Quadrant B Data is divided into 100 sec bins |
 |
 |
| Module-wise count rates for Quadrant C Data is divided into 100 sec bins |
 |
 |
| Module-wise count rates for Quadrant D Data is divided into 100 sec bins |
 |
 |
| Parameter | Plot |
|---|---|
| CZT HV Monitor |  |
| D_VDD | 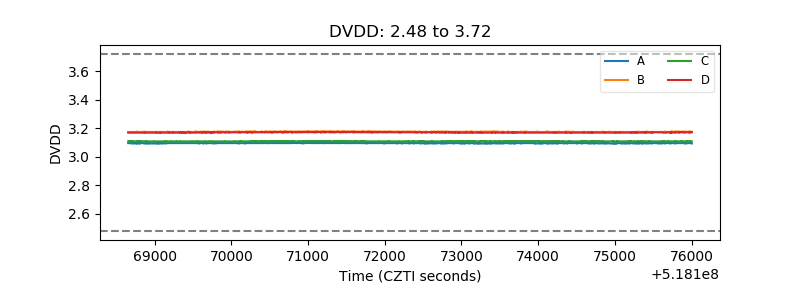 |
| Temperature 1 | 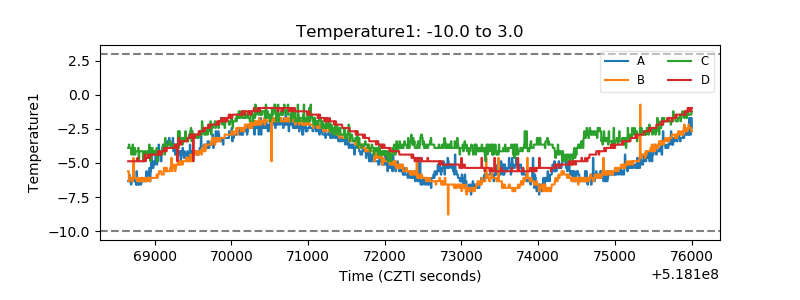 |
| Veto HV Monitor | 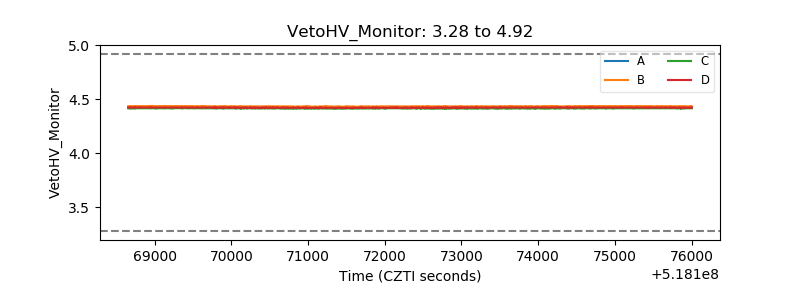 |
| Veto LLD | 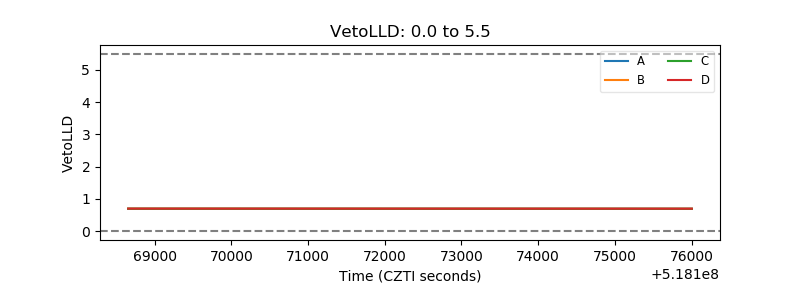 |
| Alpha Counter | 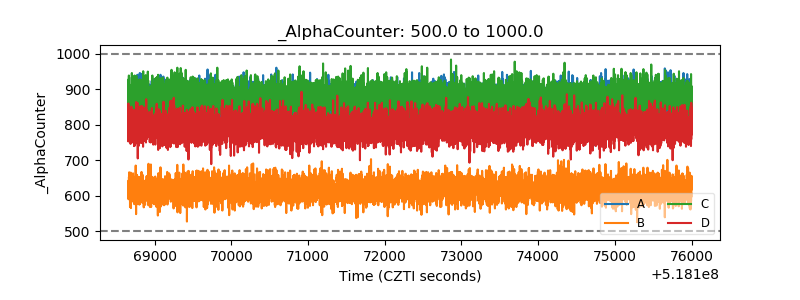 |
| _CPM_Rate | 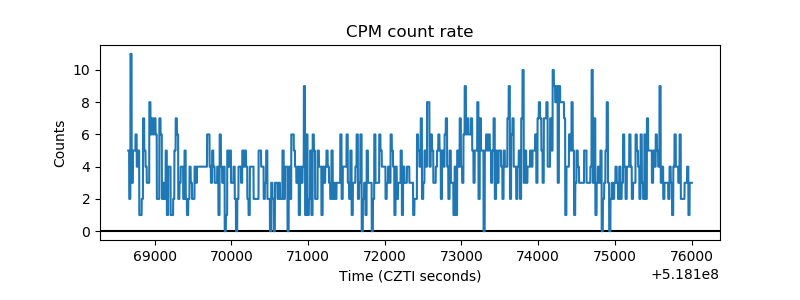 |
| CZT Counter | 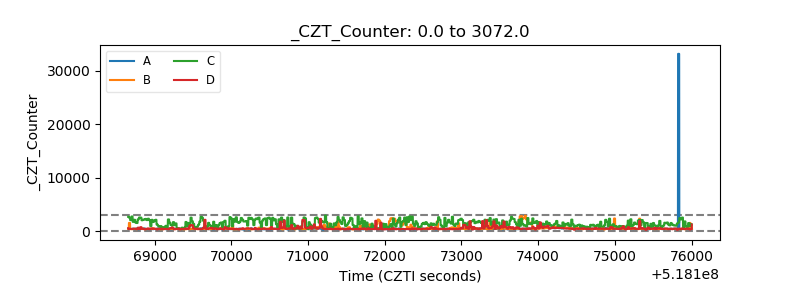 |
| +2.5 Volts monitor |  |
| +5 Volts monitor | 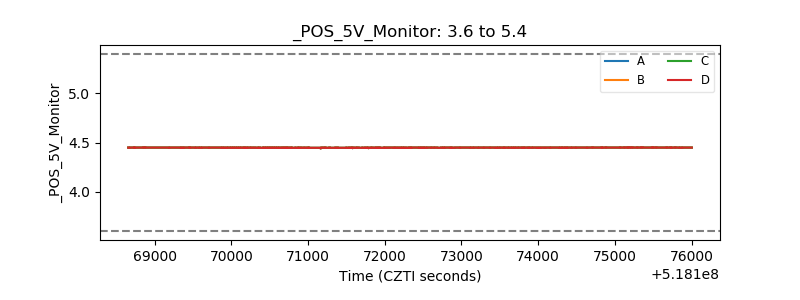 |
| _ROLL_ROT | 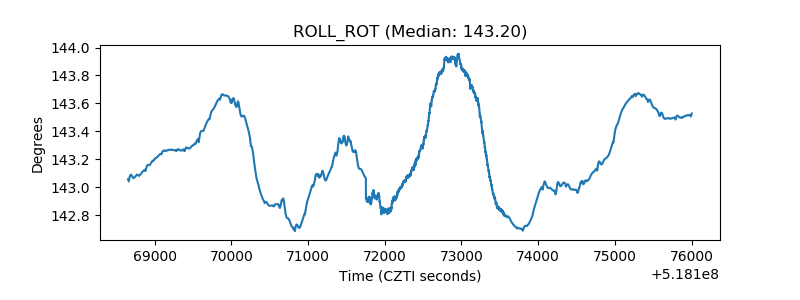 |
| _Roll_DEC | 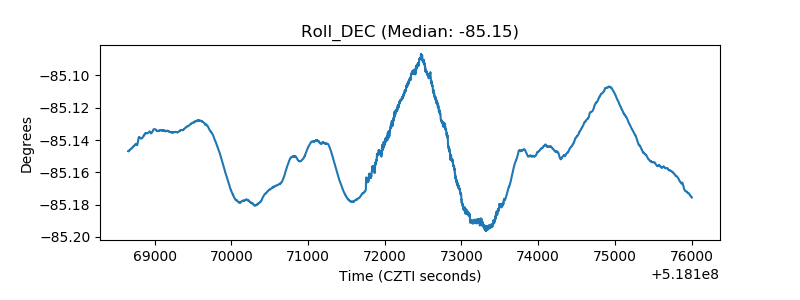 |
| _Roll_RA | 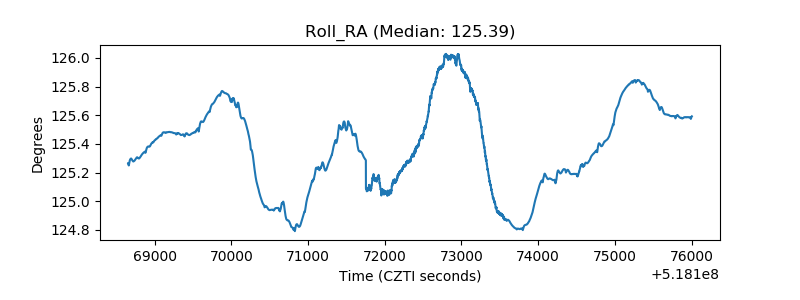 |
| Veto Counter | 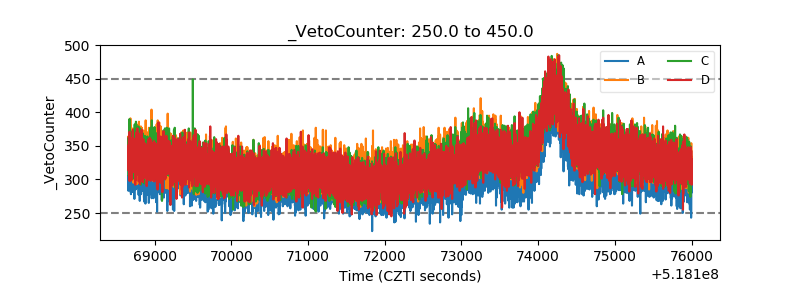 |