| Param | Original file | Final file |
|---|---|---|
| Filename | modeM0/AS1A14_083T16_9000006580_57794cztM0_level2.fits | modeM0/AS1A14_083T16_9000006580_57794cztM0_level2_quad_clean.evt |
| Size (bytes) | 1,794,162,240 | 243,633,600 |
| Size | 1.7 GB | 232.3 MB |
| Events in quadrant A | 8,185,105 | 1,746,808 |
| Events in quadrant B | 15,252,255 | 1,792,125 |
| Events in quadrant C | 30,544,565 | 1,001,571 |
| Events in quadrant D | 10,988,367 | 1,547,098 |
| Mode SS | |||
|---|---|---|---|
| Quadrant | BADHDUFLAG | Total packets | Discarded packets |
| A | 0 | 378 | 0 |
| B | 0 | 378 | 0 |
| C | 0 | 378 | 0 |
| D | 0 | 378 | 0 |
| Mode M0 | |||
|---|---|---|---|
| Quadrant | BADHDUFLAG | Total packets | Discarded packets |
| A | 0 | 38202 | 2 |
| B | 0 | 58463 | 2 |
| C | 0 | 103703 | 2 |
| D | 0 | 45864 | 3 |
| Mode M9 | |||
|---|---|---|---|
| Quadrant | BADHDUFLAG | Total packets | Discarded packets |
| A | 0 | 9 | 0 |
| B | 0 | 9 | 0 |
| C | 0 | 9 | 0 |
| D | 0 | 9 | 0 |
| Quadrant | Total seconds | Saturated seconds | Saturation percentage |
|---|---|---|---|
| A | 18690 | 335 | 1.792402% |
| B | 18691 | 1242 | 6.644909% |
| C | 18691 | 8064 | 43.143759% |
| D | 18690 | 590 | 3.156768% |
Noise dominated data is calculated using 1-second bins in cleaned event files. If a bin has >2000 counts, and if more than 50% of those come from <1% of pixels, then it is considered to be noise-dominated and hence unusable.
| Quadrant | # 1 sec bins | Bins with >0 counts | Bins with >2000 counts | High rate bins dominated by noise | Noise dominated (total time) | Noise dominated (detector-on time) | Marked lightcurve |
|---|---|---|---|---|---|---|---|
| A | 19560 | 18690 | 3 | 3 | 0.02% | 0.02% | 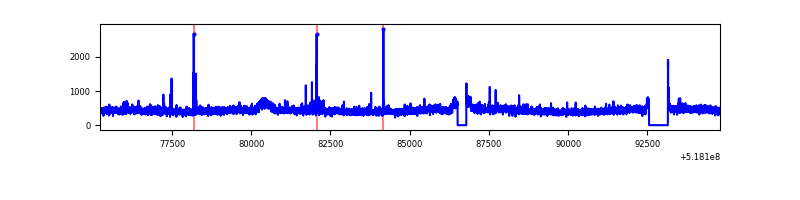 |
| B | 19561 | 18691 | 640 | 640 | 3.27% | 3.42% | 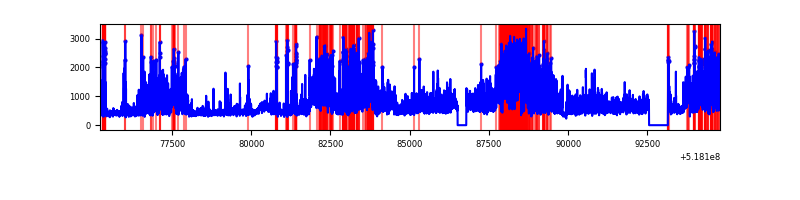 |
| C | 19561 | 18691 | 7032 | 7032 | 35.95% | 37.62% | 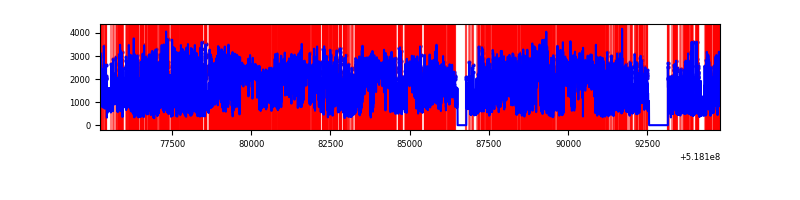 |
| D | 19560 | 18690 | 373 | 373 | 1.91% | 2.00% | 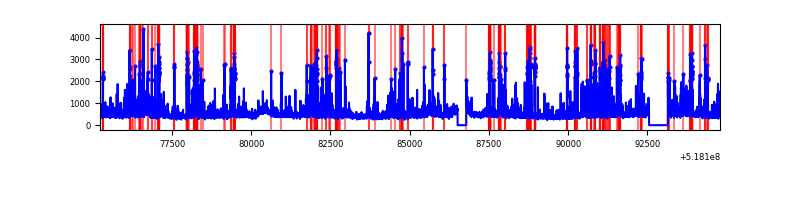 |
Top three noisy pixels from each quadrant. If the there are fewer than three noisy pixels in the level2.evt file, extra rows are filled as -1
| Pixel properties | Quadrant properties | ||||||
|---|---|---|---|---|---|---|---|
| Quadrant | DetID | PixID | Counts | Sigma | Mean | Median | Sigma |
| A | 3 | 128 | 265976 | 527.63 | 2023 | 1968 | 500.4 |
| A | 7 | 64 | 47345 | 90.69 | 2023 | 1968 | 500.4 |
| A | 3 | 245 | 35995 | 68.0 | 2023 | 1968 | 500.4 |
| B | 4 | 80 | 5944451 | 14221.23 | 1966 | 1887 | 417.9 |
| B | 10 | 247 | 395180 | 941.19 | 1966 | 1887 | 417.9 |
| B | 4 | 171 | 353327 | 841.04 | 1966 | 1887 | 417.9 |
| C | 9 | 38 | 16906051 | 39428.07 | 1586 | 1570 | 428.7 |
| C | 15 | 224 | 4288631 | 9999.16 | 1586 | 1570 | 428.7 |
| C | 15 | 208 | 2590366 | 6038.12 | 1586 | 1570 | 428.7 |
| D | 2 | 153 | 1078013 | 1980.01 | 1946 | 1859 | 543.5 |
| D | 12 | 0 | 599868 | 1100.27 | 1946 | 1859 | 543.5 |
| D | 3 | 12 | 452822 | 829.72 | 1946 | 1859 | 543.5 |
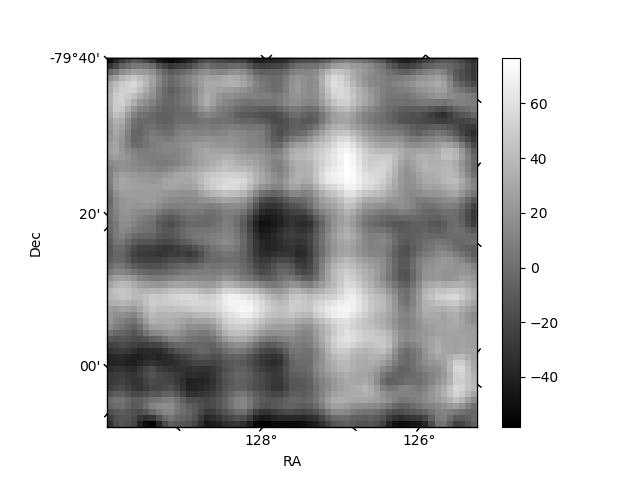
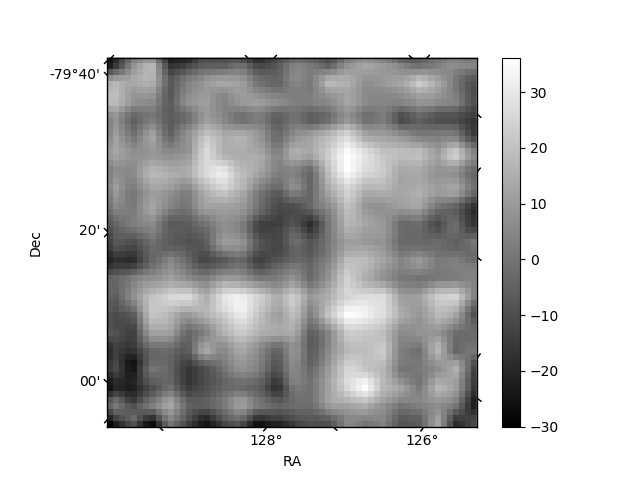
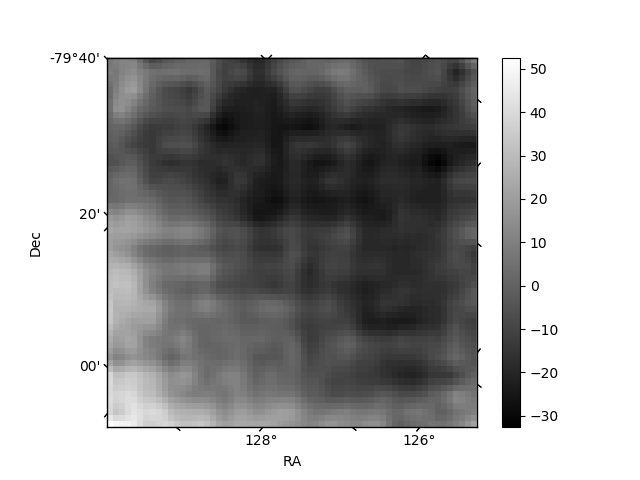
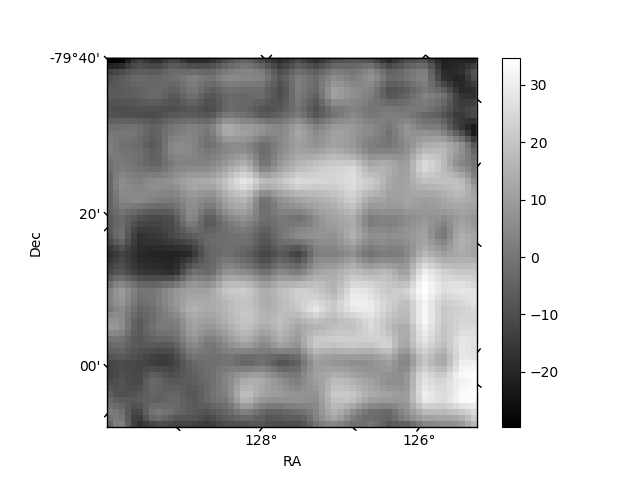
Histogram calculated using DETX and DETY for each event in the final _common_clean file
| Quadrant A | 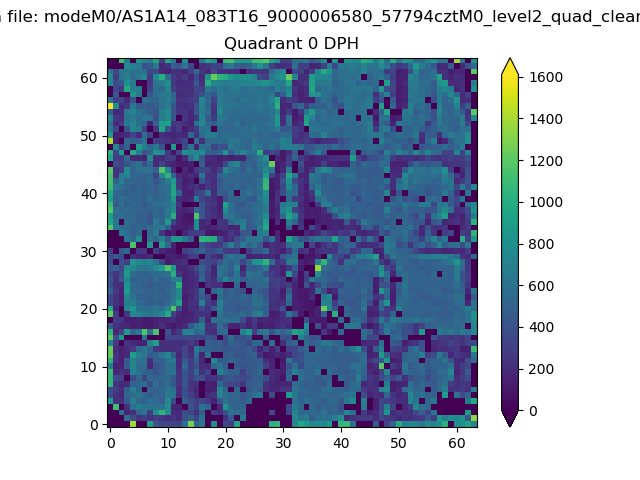 |
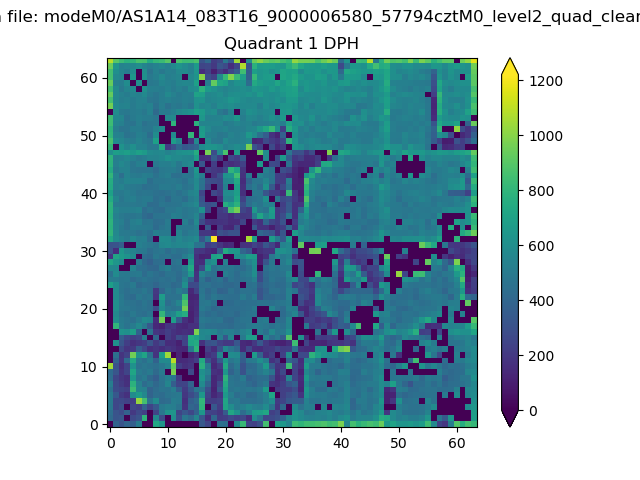 |
Quadrant B |
|---|---|---|---|
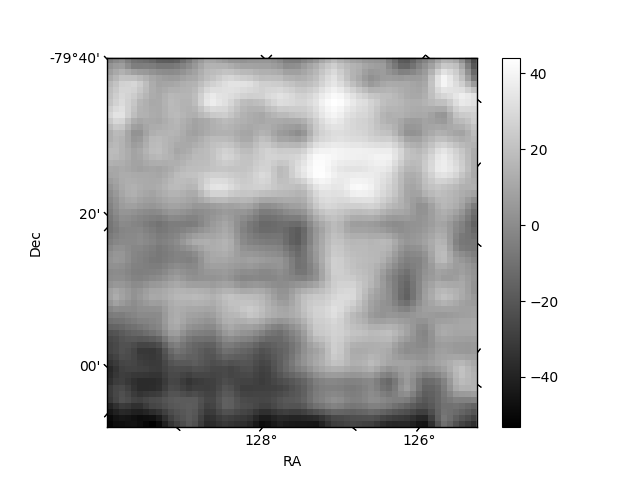
| Quadrant D | 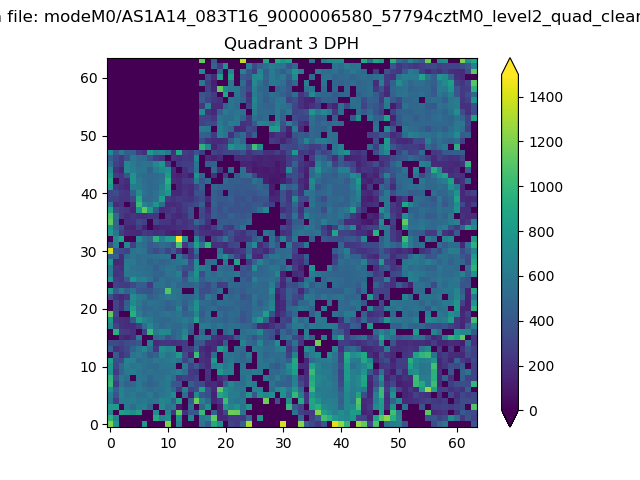 |
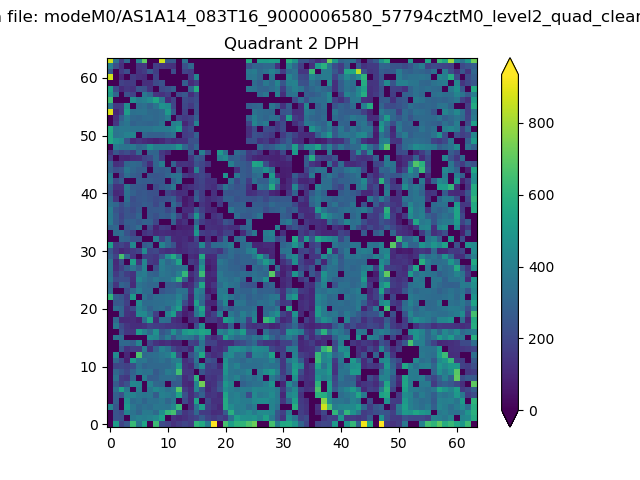 |
Quadrant C |
| Plot type | Count rate plots | Images |
|---|---|---|
| Comparison with Poisson distribution Blue bars denote a histogram of data divided into 1 sec bins. Red curve is a Poisson curve with rate = median count rate of data. |
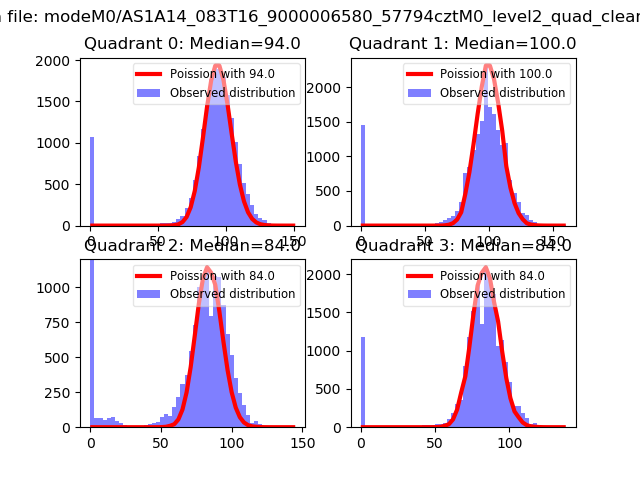 |
 |
| Quadrant-wise count rates Data is divided into 100 sec bins |
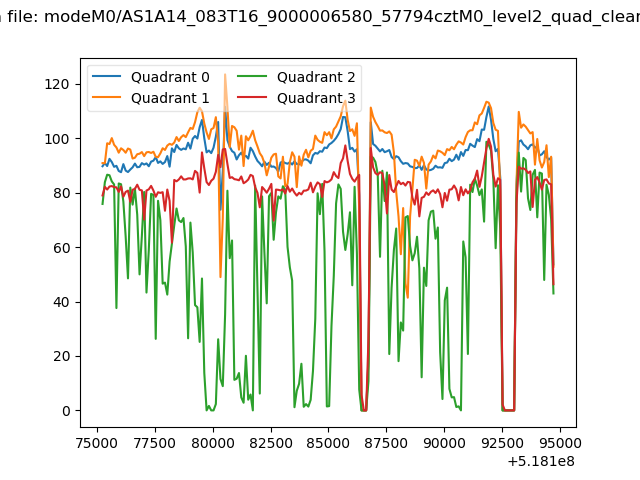 |
|
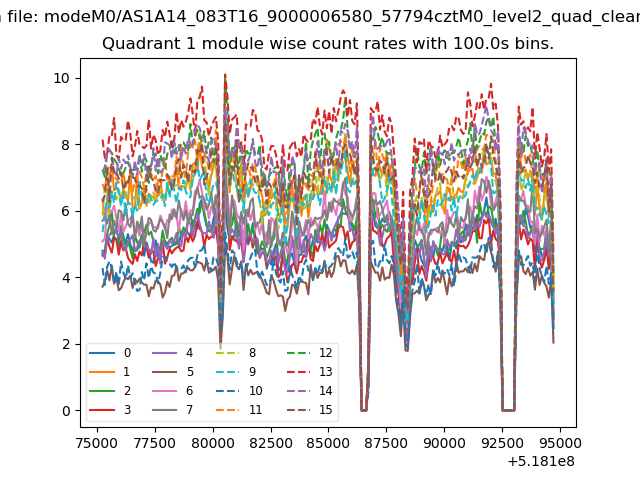
| Module-wise count rates for Quadrant A Data is divided into 100 sec bins |
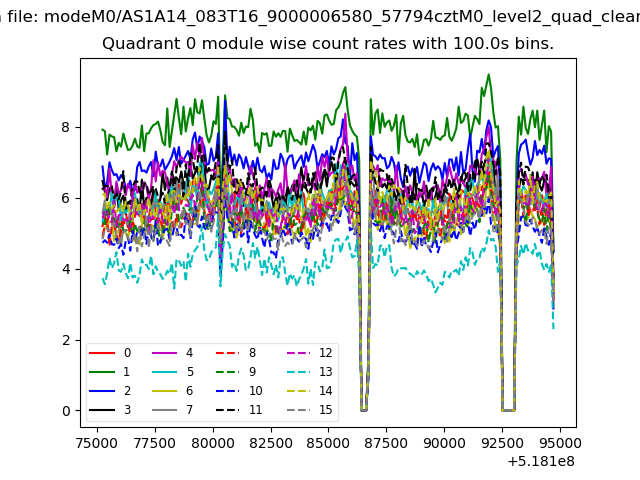 |
 |
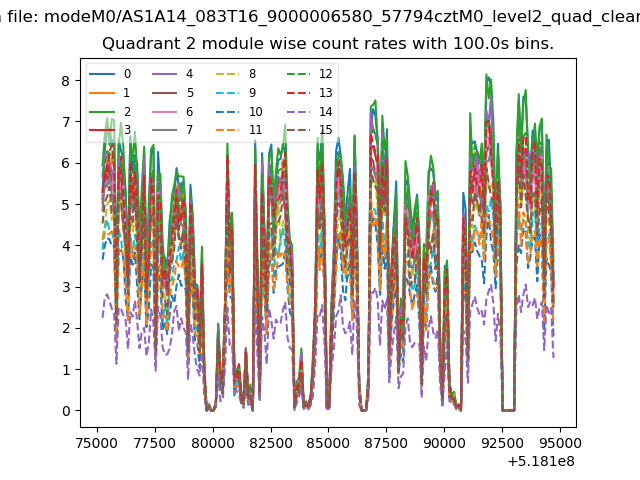
| Module-wise count rates for Quadrant B Data is divided into 100 sec bins |
 |
 |
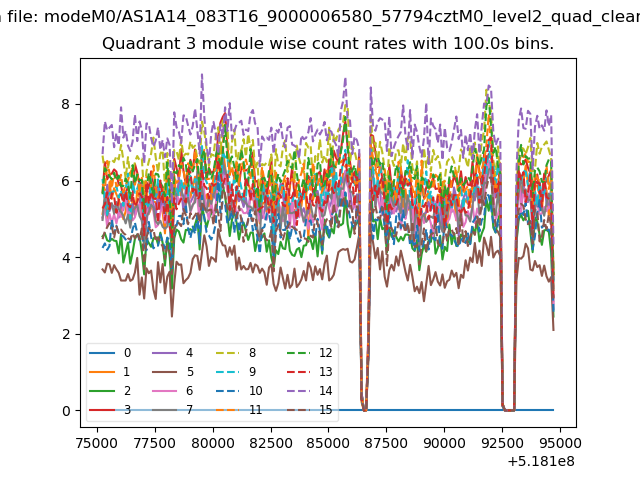
| Module-wise count rates for Quadrant C Data is divided into 100 sec bins |
 |
 |
| Module-wise count rates for Quadrant D Data is divided into 100 sec bins |
 |
 |
| Parameter | Plot |
|---|---|
| CZT HV Monitor | 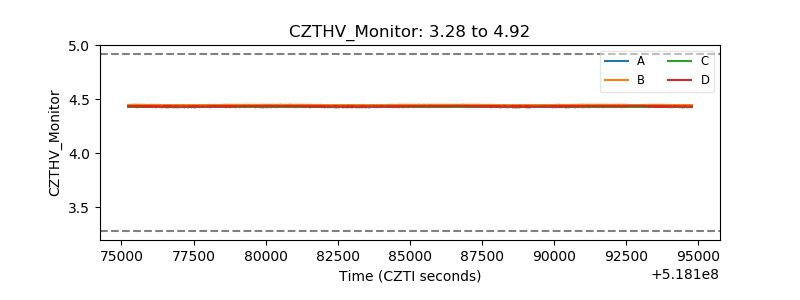 |
| D_VDD | 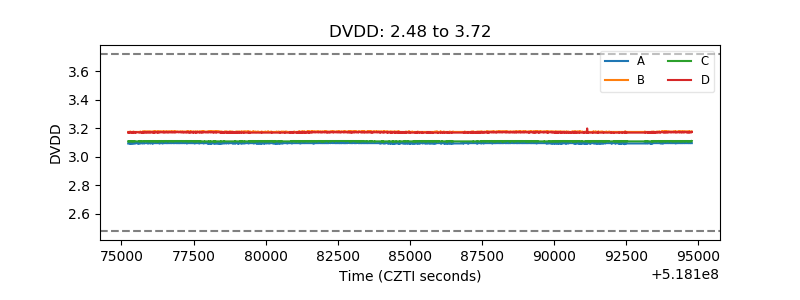 |
| Temperature 1 | 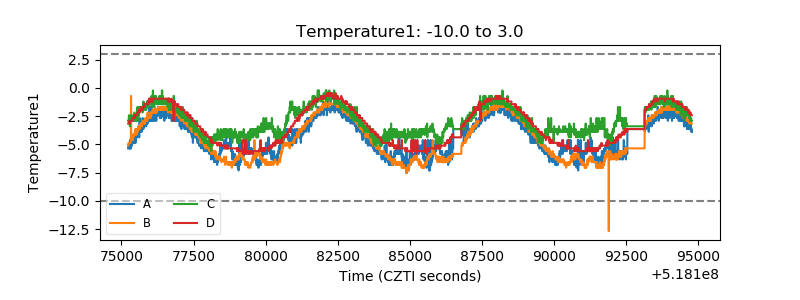 |
| Veto HV Monitor | 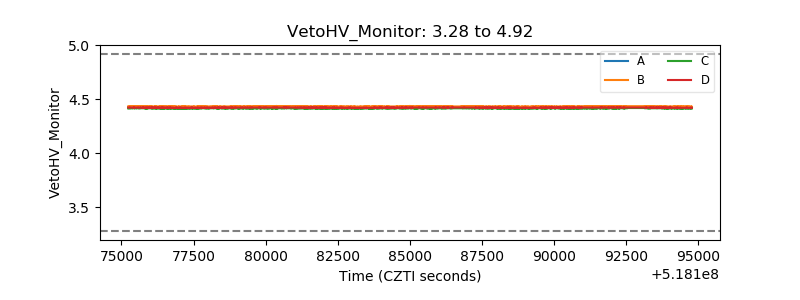 |
| Veto LLD | 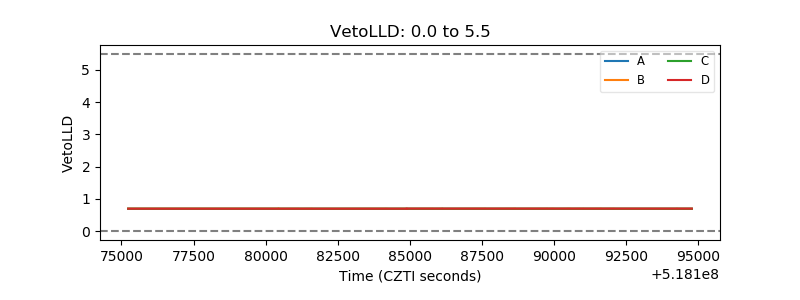 |
| Alpha Counter | 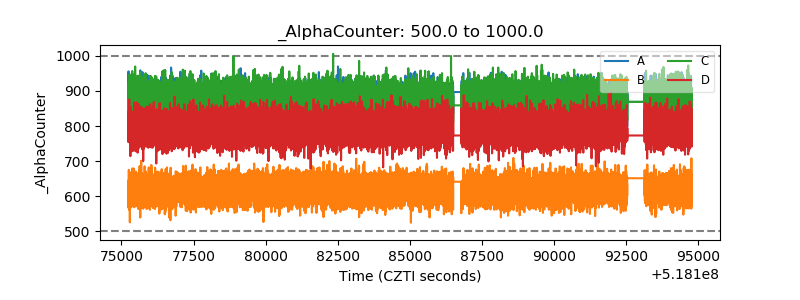 |
| _CPM_Rate | 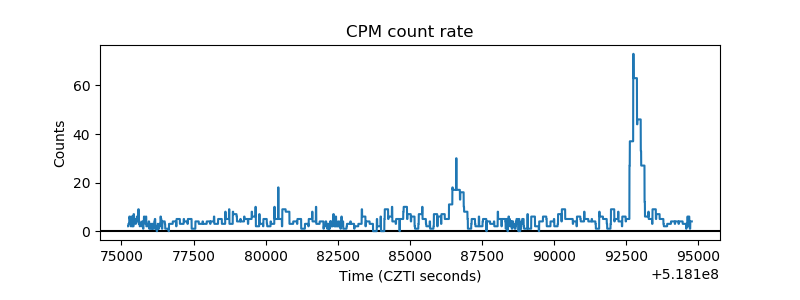 |
| CZT Counter | 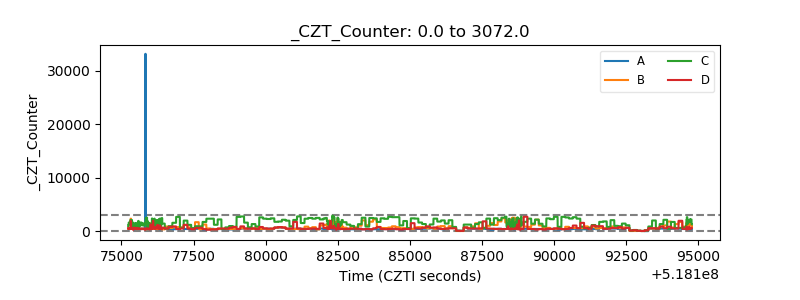 |
| +2.5 Volts monitor | 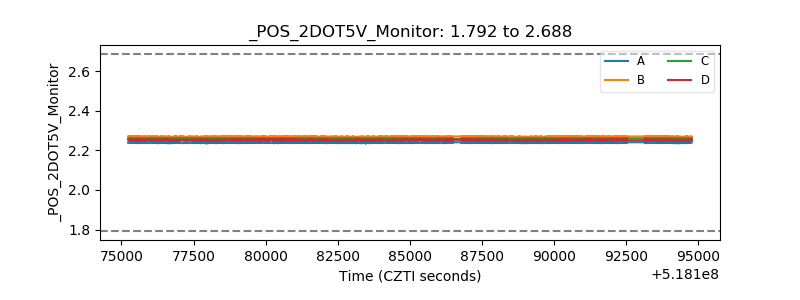 |
| +5 Volts monitor |  |
| _ROLL_ROT | 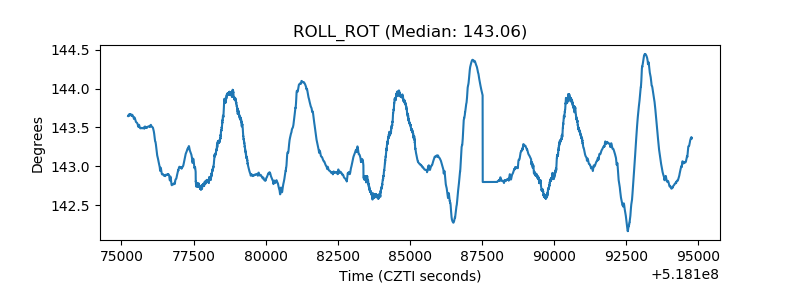 |
| _Roll_DEC | 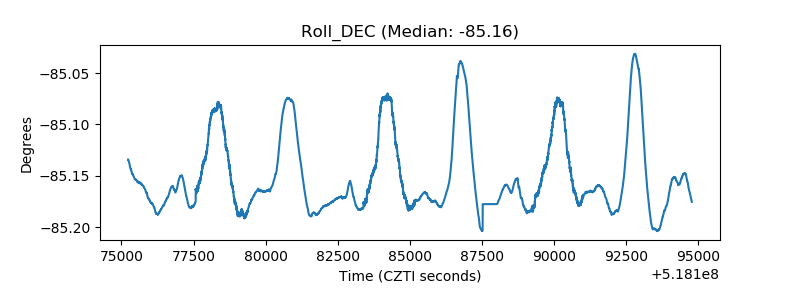 |
| _Roll_RA | 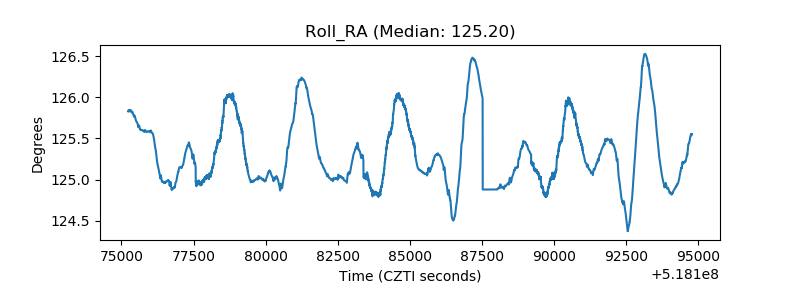 |
| Veto Counter | 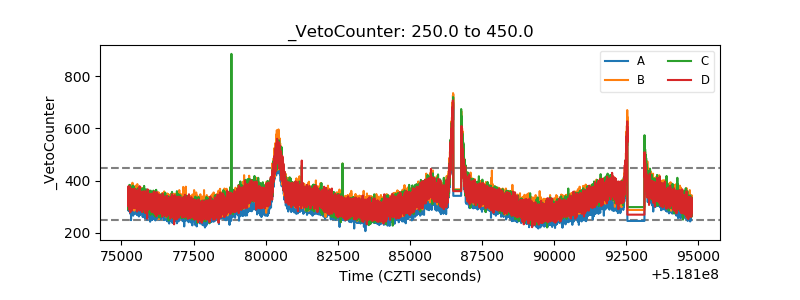 |