| Param | Original file | Final file |
|---|---|---|
| Filename | modeM0/AS1A14_083T16_9000006580_57796cztM0_level2.fits | modeM0/AS1A14_083T16_9000006580_57796cztM0_level2_quad_clean.evt |
| Size (bytes) | 619,277,760 | 86,656,320 |
| Size | 590.6 MB | 82.6 MB |
| Events in quadrant A | 2,910,652 | 613,055 |
| Events in quadrant B | 4,895,672 | 632,273 |
| Events in quadrant C | 9,456,716 | 427,316 |
| Events in quadrant D | 5,166,340 | 505,676 |
| Mode SS | |||
|---|---|---|---|
| Quadrant | BADHDUFLAG | Total packets | Discarded packets |
| A | 0 | 130 | 0 |
| B | 0 | 130 | 0 |
| C | 0 | 130 | 0 |
| D | 0 | 130 | 0 |
| Mode M0 | |||
|---|---|---|---|
| Quadrant | BADHDUFLAG | Total packets | Discarded packets |
| A | 0 | 13113 | 1 |
| B | 0 | 19223 | 1 |
| C | 0 | 32562 | 1 |
| D | 0 | 19862 | 6 |
| Mode M9 | |||
|---|---|---|---|
| Quadrant | BADHDUFLAG | Total packets | Discarded packets |
| A | 0 | 9 | 0 |
| B | 0 | 9 | 0 |
| C | 0 | 9 | 0 |
| D | 0 | 9 | 0 |
| Quadrant | Total seconds | Saturated seconds | Saturation percentage |
|---|---|---|---|
| A | 6379 | 25 | 0.391911% |
| B | 6379 | 332 | 5.204578% |
| C | 6379 | 1874 | 29.377645% |
| D | 6379 | 582 | 9.123687% |
Noise dominated data is calculated using 1-second bins in cleaned event files. If a bin has >2000 counts, and if more than 50% of those come from <1% of pixels, then it is considered to be noise-dominated and hence unusable.
| Quadrant | # 1 sec bins | Bins with >0 counts | Bins with >2000 counts | High rate bins dominated by noise | Noise dominated (total time) | Noise dominated (detector-on time) | Marked lightcurve |
|---|---|---|---|---|---|---|---|
| A | 7329 | 6379 | 0 | 0 | 0.00% | 0.00% | 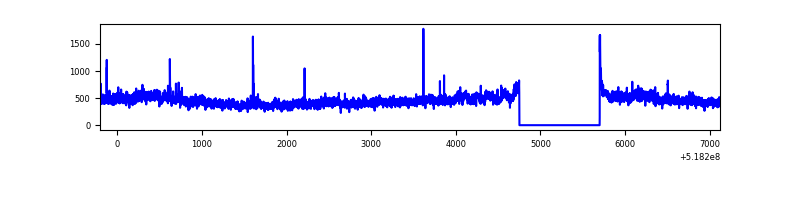 |
| B | 7329 | 6379 | 138 | 138 | 1.88% | 2.16% | 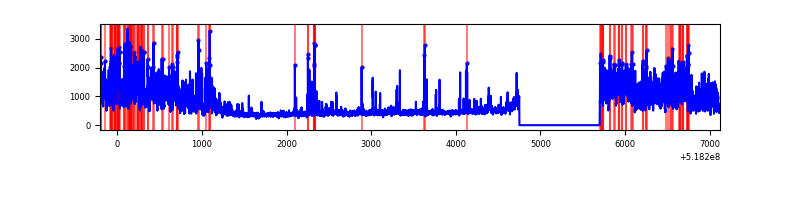 |
| C | 7328 | 6378 | 1740 | 1740 | 23.74% | 27.28% | 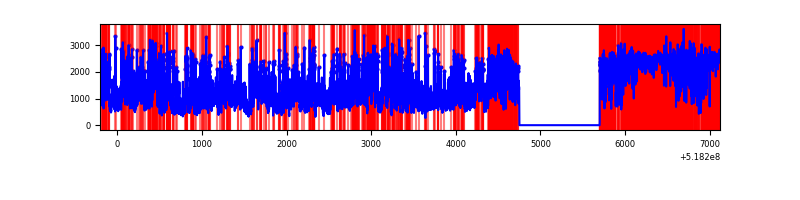 |
| D | 7328 | 6379 | 646 | 646 | 8.82% | 10.13% | 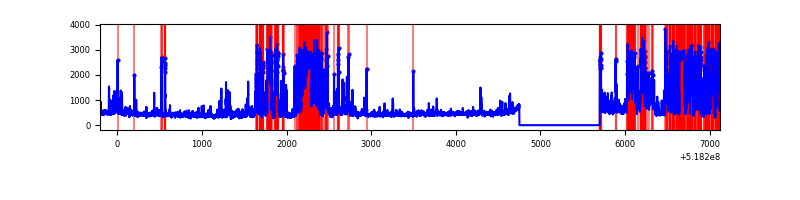 |
Top three noisy pixels from each quadrant. If the there are fewer than three noisy pixels in the level2.evt file, extra rows are filled as -1
| Pixel properties | Quadrant properties | ||||||
|---|---|---|---|---|---|---|---|
| Quadrant | DetID | PixID | Counts | Sigma | Mean | Median | Sigma |
| A | 3 | 128 | 217448 | 1292.49 | 677 | 662 | 167.7 |
| A | 3 | 14 | 53621 | 315.74 | 677 | 662 | 167.7 |
| A | 3 | 245 | 11961 | 67.37 | 677 | 662 | 167.7 |
| B | 4 | 80 | 1769573 | 12416.02 | 660 | 635 | 142.5 |
| B | 10 | 247 | 147372 | 1029.93 | 660 | 635 | 142.5 |
| B | 0 | 171 | 105329 | 734.84 | 660 | 635 | 142.5 |
| C | 9 | 38 | 4880955 | 31594.53 | 566 | 559 | 154.5 |
| C | 15 | 224 | 1976030 | 12788.73 | 566 | 559 | 154.5 |
| C | 10 | 21 | 203509 | 1313.85 | 566 | 559 | 154.5 |
| D | 12 | 0 | 1814489 | 10288.22 | 623 | 595 | 176.3 |
| D | 8 | 160 | 405305 | 2295.47 | 623 | 595 | 176.3 |
| D | 2 | 153 | 190079 | 1074.73 | 623 | 595 | 176.3 |
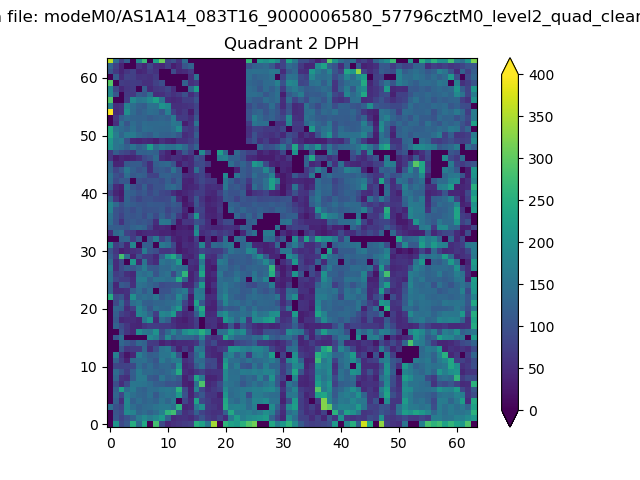
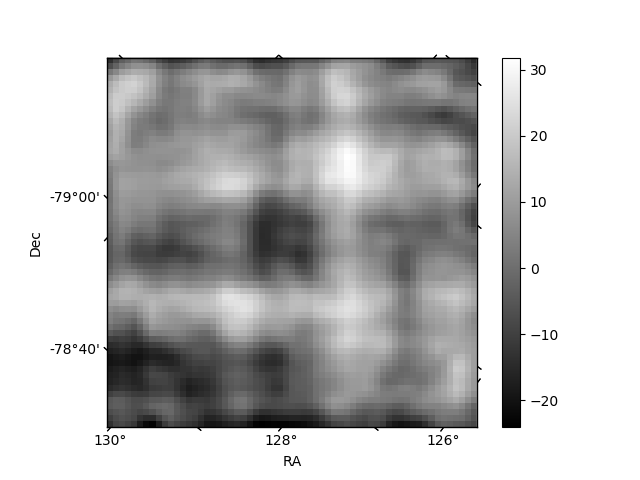
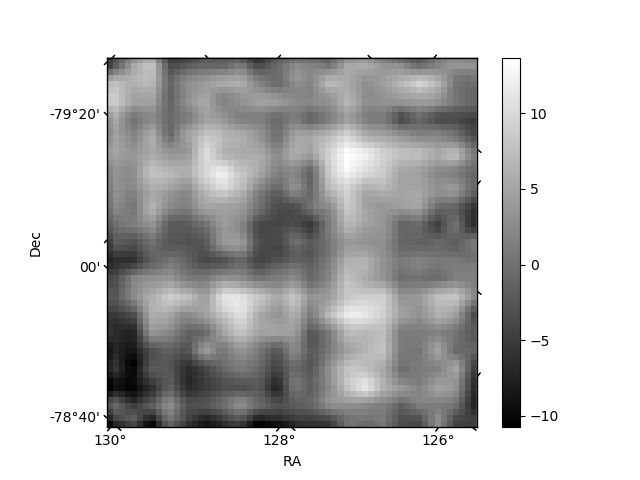
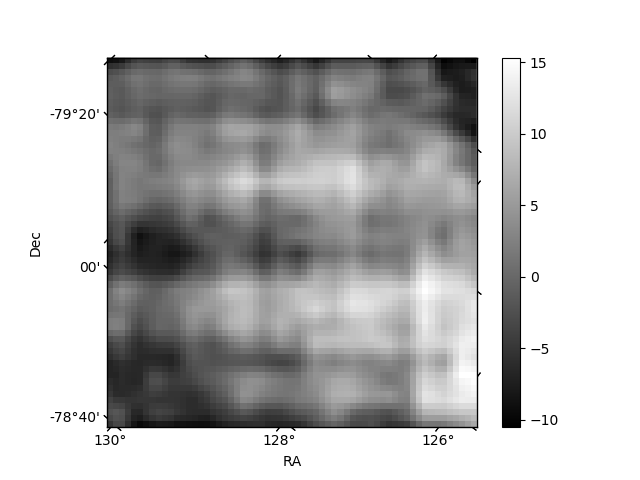
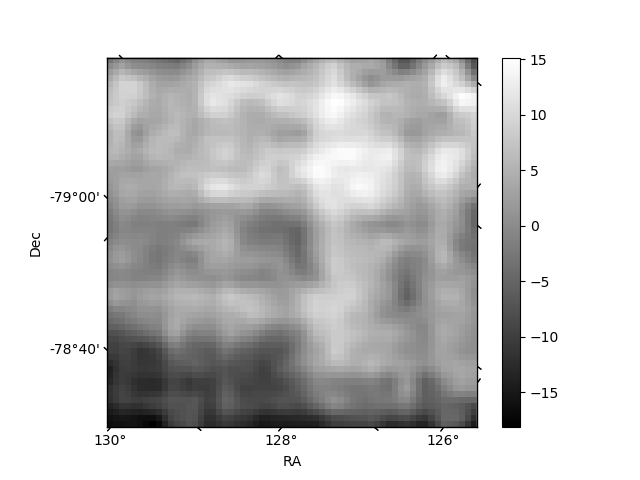
Histogram calculated using DETX and DETY for each event in the final _common_clean file
| Quadrant A | 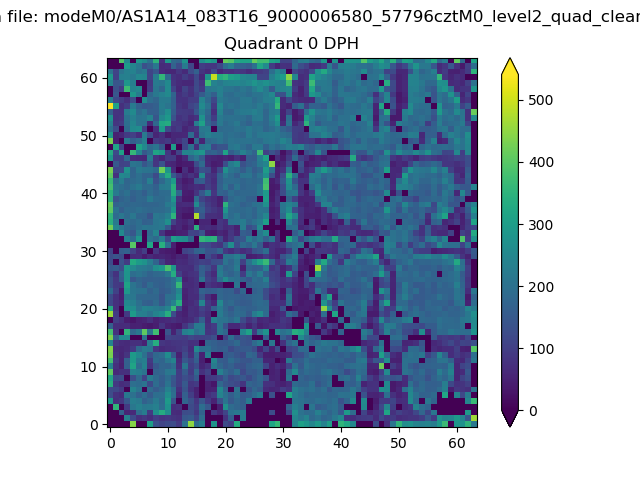 |
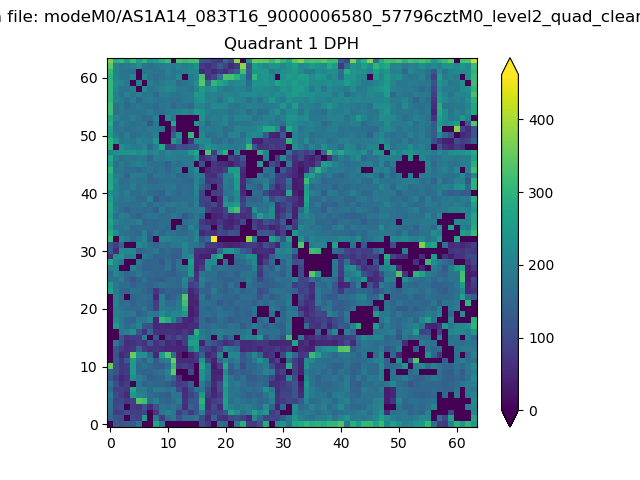 |
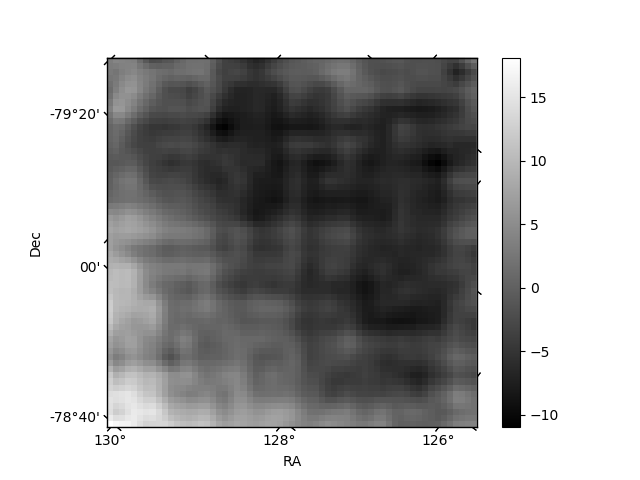
Quadrant B |
|---|---|---|---|
| Quadrant D | 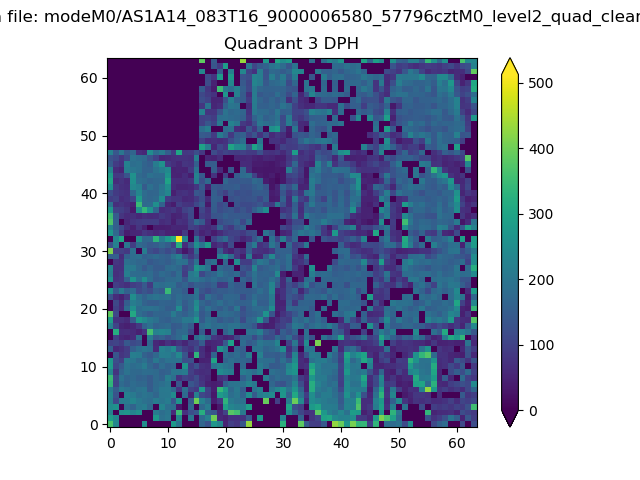 |
 |
Quadrant C |
| Plot type | Count rate plots | Images |
|---|---|---|
| Comparison with Poisson distribution Blue bars denote a histogram of data divided into 1 sec bins. Red curve is a Poisson curve with rate = median count rate of data. |
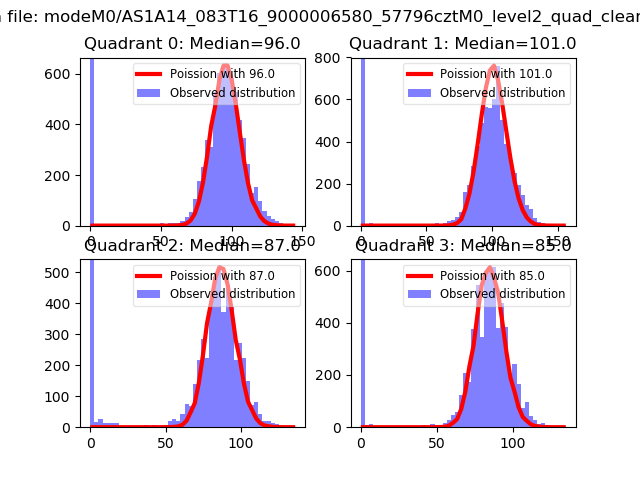 |
 |
| Quadrant-wise count rates Data is divided into 100 sec bins |
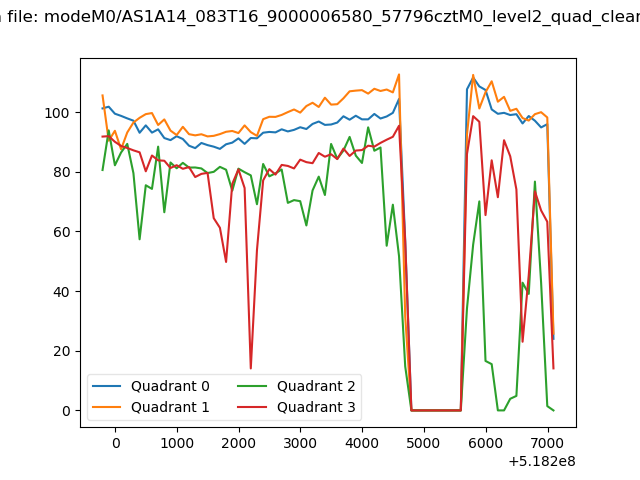 |
|
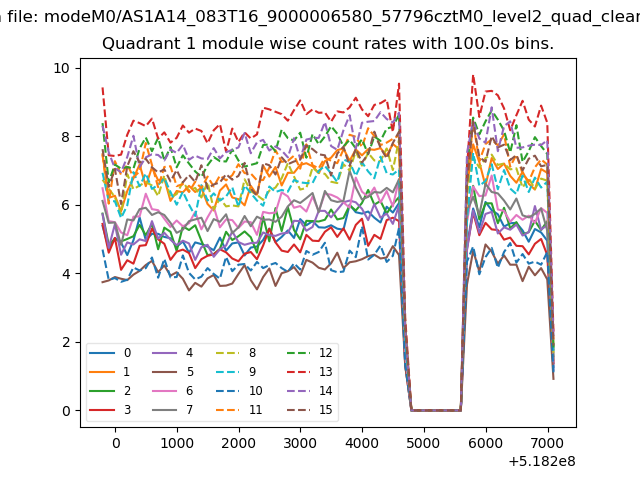
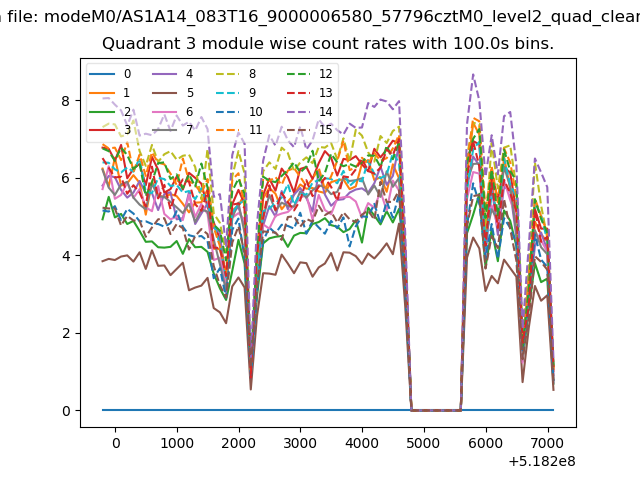
| Module-wise count rates for Quadrant A Data is divided into 100 sec bins |
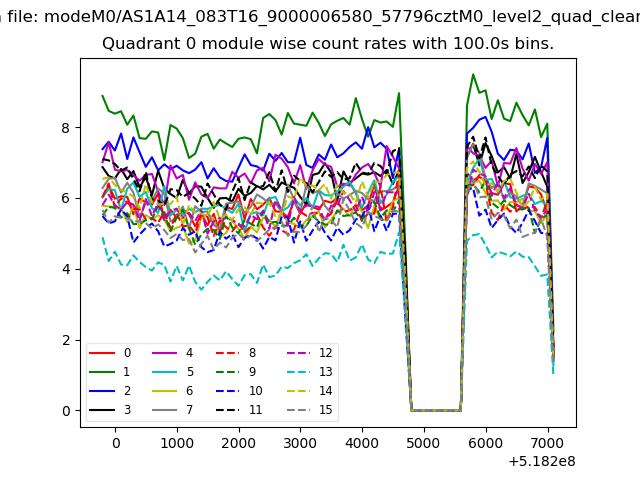 |
 |
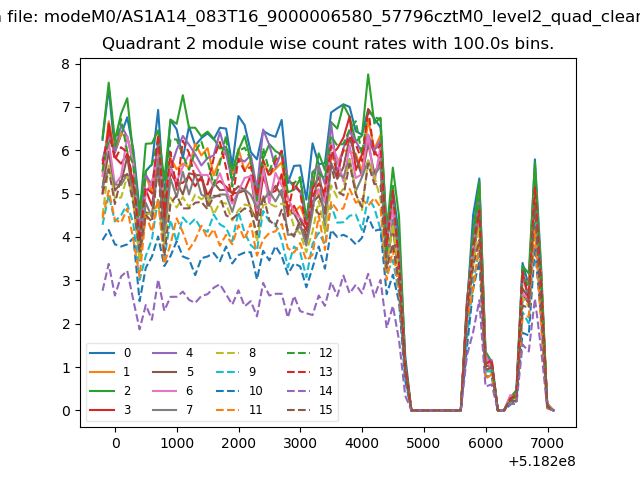
| Module-wise count rates for Quadrant B Data is divided into 100 sec bins |
 |
 |
| Module-wise count rates for Quadrant C Data is divided into 100 sec bins |
 |
 |
| Module-wise count rates for Quadrant D Data is divided into 100 sec bins |
 |
 |
| Parameter | Plot |
|---|---|
| CZT HV Monitor | 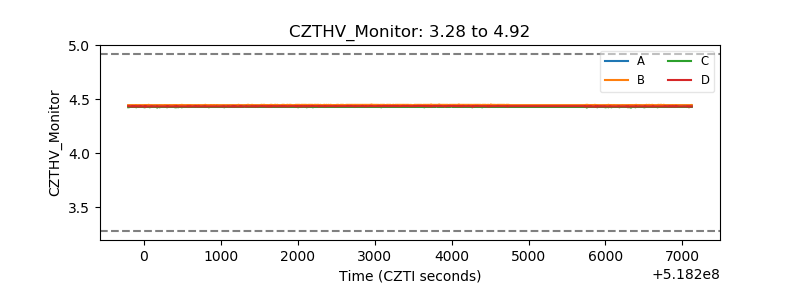 |
| D_VDD | 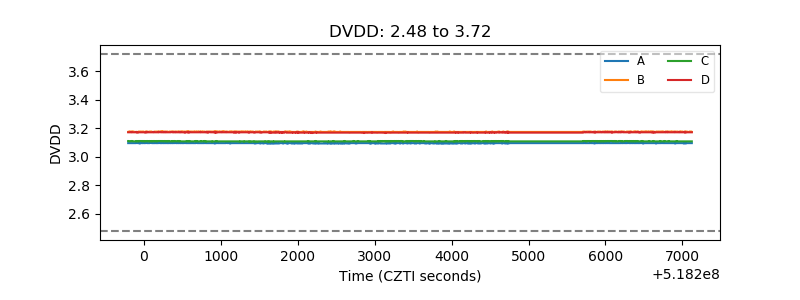 |
| Temperature 1 | 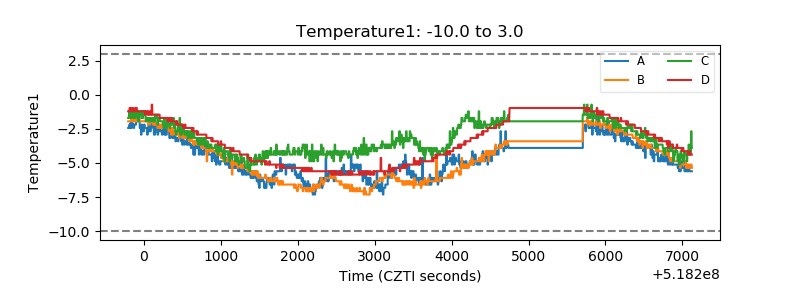 |
| Veto HV Monitor | 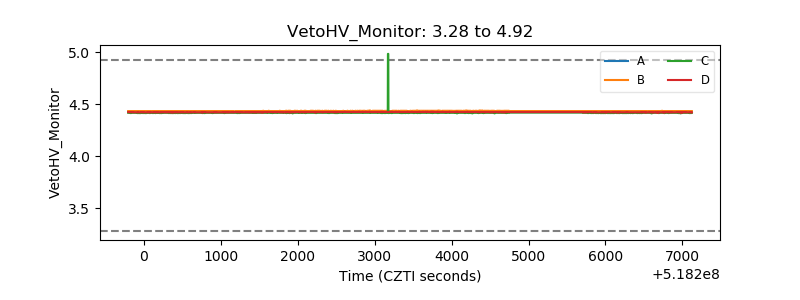 |
| Veto LLD | 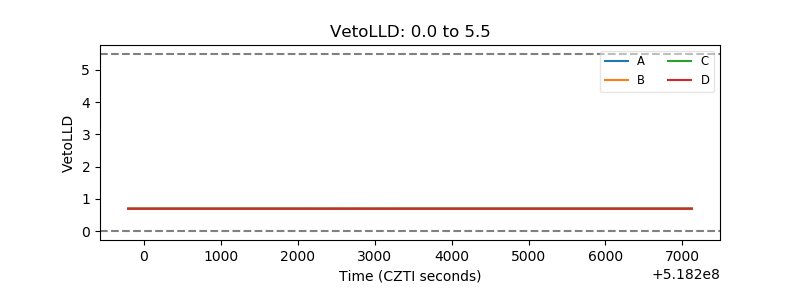 |
| Alpha Counter | 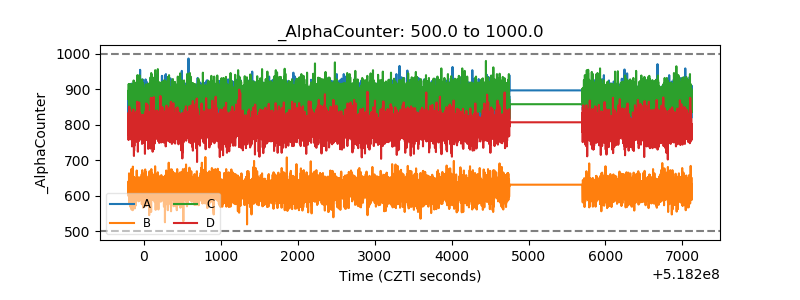 |
| _CPM_Rate | 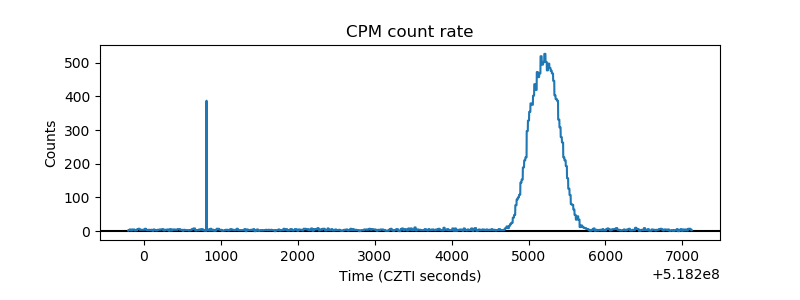 |
| CZT Counter | 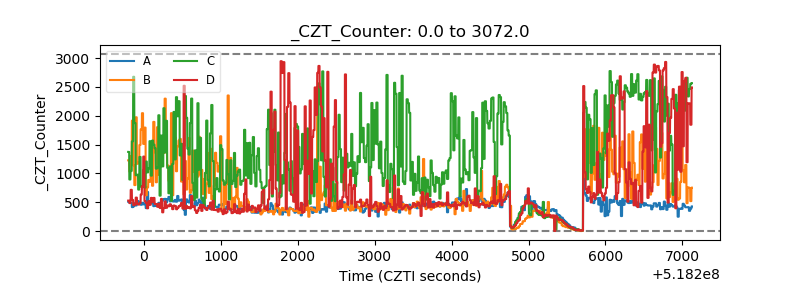 |
| +2.5 Volts monitor | 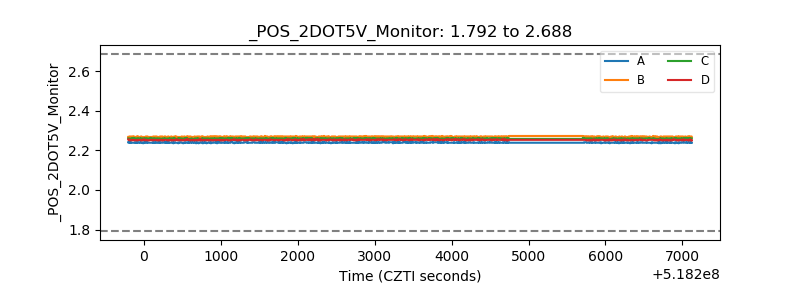 |
| +5 Volts monitor |  |
| _ROLL_ROT | 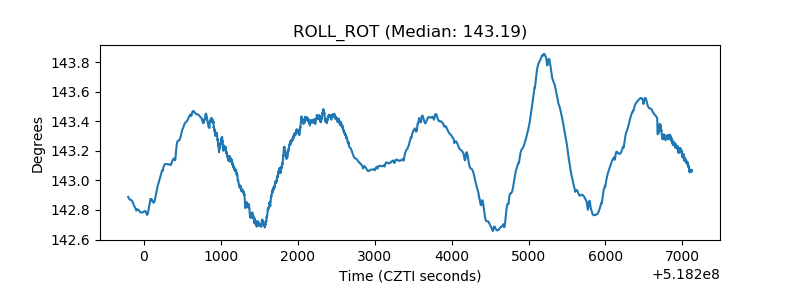 |
| _Roll_DEC | 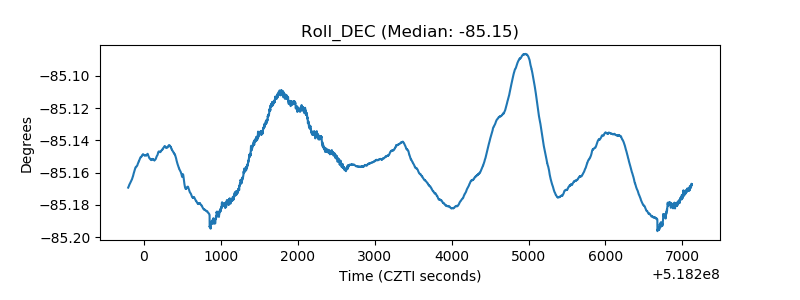 |
| _Roll_RA | 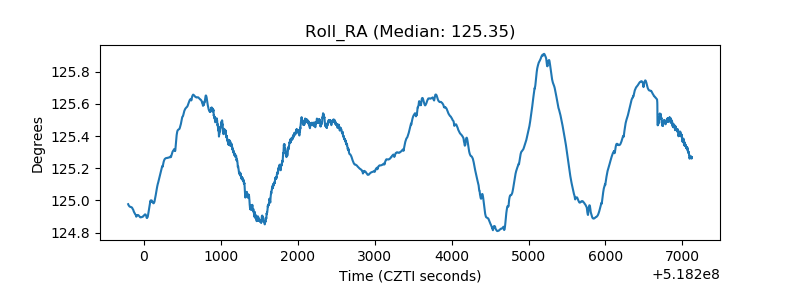 |
| Veto Counter | 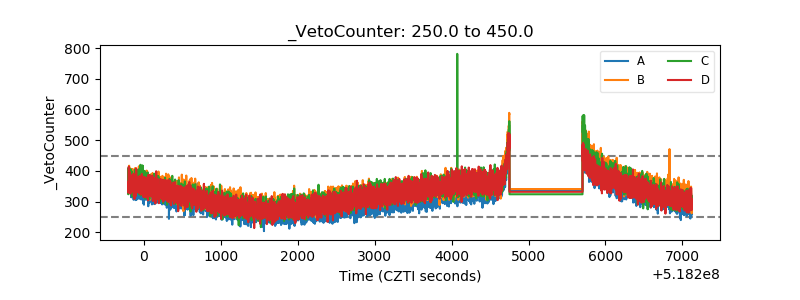 |