| Param | Original file | Final file |
|---|---|---|
| Filename | modeM0/AS1A14_083T16_9000006580_57798cztM0_level2.fits | modeM0/AS1A14_083T16_9000006580_57798cztM0_level2_quad_clean.evt |
| Size (bytes) | 746,089,920 | 77,849,280 |
| Size | 711.5 MB | 74.2 MB |
| Events in quadrant A | 2,922,661 | 608,552 |
| Events in quadrant B | 5,122,323 | 622,474 |
| Events in quadrant C | 12,145,007 | 249,820 |
| Events in quadrant D | 6,945,198 | 441,667 |
| Mode SS | |||
|---|---|---|---|
| Quadrant | BADHDUFLAG | Total packets | Discarded packets |
| A | 0 | 128 | 2 |
| B | 0 | 128 | 2 |
| C | 0 | 128 | 2 |
| D | 0 | 128 | 2 |
| Mode M0 | |||
|---|---|---|---|
| Quadrant | BADHDUFLAG | Total packets | Discarded packets |
| A | 0 | 13359 | 235 |
| B | 0 | 20242 | 643 |
| C | 0 | 41220 | 881 |
| D | 0 | 25492 | 440 |
| Mode M9 | |||
|---|---|---|---|
| Quadrant | BADHDUFLAG | Total packets | Discarded packets |
| A | 0 | 11 | 0 |
| B | 0 | 11 | 0 |
| C | 0 | 11 | 0 |
| D | 0 | 11 | 0 |
| Quadrant | Total seconds | Saturated seconds | Saturation percentage |
|---|---|---|---|
| A | 6244 | 43 | 0.688661% |
| B | 6225 | 315 | 5.060241% |
| C | 6215 | 3914 | 62.976669% |
| D | 6223 | 1246 | 20.022497% |
Noise dominated data is calculated using 1-second bins in cleaned event files. If a bin has >2000 counts, and if more than 50% of those come from <1% of pixels, then it is considered to be noise-dominated and hence unusable.
| Quadrant | # 1 sec bins | Bins with >0 counts | Bins with >2000 counts | High rate bins dominated by noise | Noise dominated (total time) | Noise dominated (detector-on time) | Marked lightcurve |
|---|---|---|---|---|---|---|---|
| A | 7339 | 6258 | 8 | 8 | 0.11% | 0.13% | 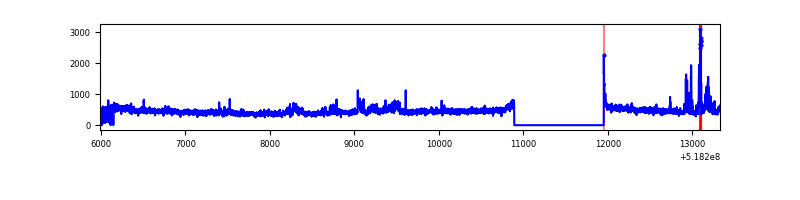 |
| B | 7323 | 6248 | 160 | 160 | 2.18% | 2.56% | 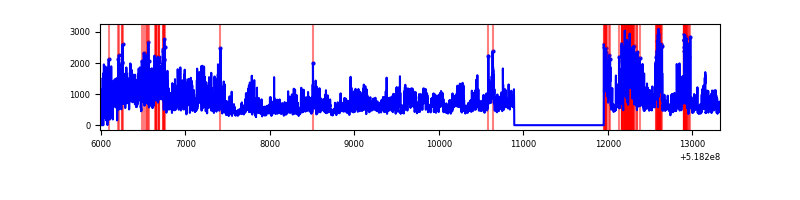 |
| C | 7302 | 6225 | 3686 | 3686 | 50.48% | 59.21% | 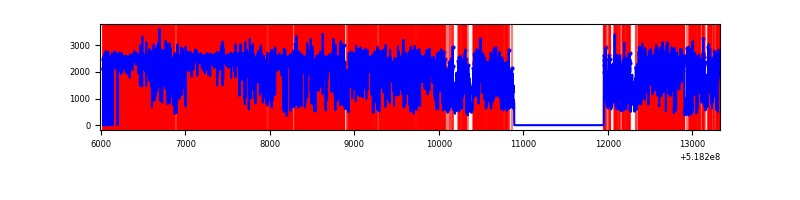 |
| D | 7318 | 6241 | 1303 | 1303 | 17.81% | 20.88% | 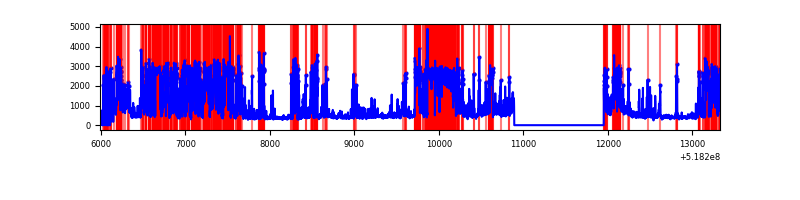 |
Top three noisy pixels from each quadrant. If the there are fewer than three noisy pixels in the level2.evt file, extra rows are filled as -1
| Pixel properties | Quadrant properties | ||||||
|---|---|---|---|---|---|---|---|
| Quadrant | DetID | PixID | Counts | Sigma | Mean | Median | Sigma |
| A | 3 | 14 | 208593 | 1265.93 | 661 | 645 | 164.3 |
| A | 3 | 128 | 146471 | 887.75 | 661 | 645 | 164.3 |
| A | 3 | 137 | 7926 | 44.32 | 661 | 645 | 164.3 |
| B | 4 | 80 | 2245480 | 16463.21 | 643 | 621 | 136.4 |
| B | 10 | 247 | 101082 | 736.75 | 643 | 621 | 136.4 |
| B | 4 | 171 | 56648 | 410.89 | 643 | 621 | 136.4 |
| C | 9 | 38 | 8528264 | 66881.28 | 469 | 464 | 127.5 |
| C | 15 | 224 | 1474417 | 11559.82 | 469 | 464 | 127.5 |
| C | 10 | 21 | 128481 | 1004.0 | 469 | 464 | 127.5 |
| D | 12 | 0 | 3582036 | 21714.85 | 573 | 544 | 164.9 |
| D | 8 | 160 | 588488 | 3564.75 | 573 | 544 | 164.9 |
| D | 2 | 249 | 148857 | 899.23 | 573 | 544 | 164.9 |
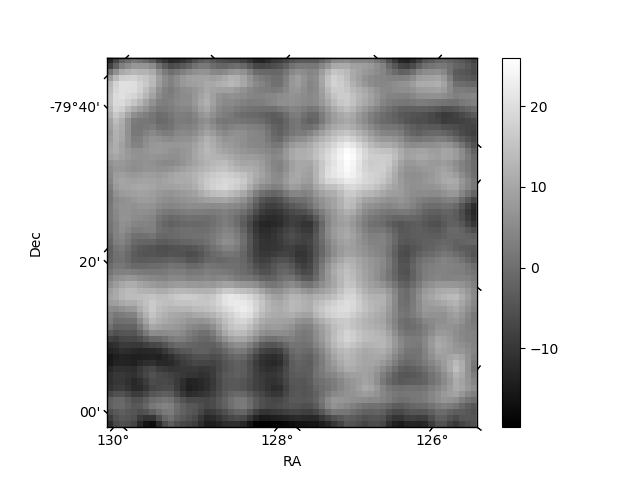
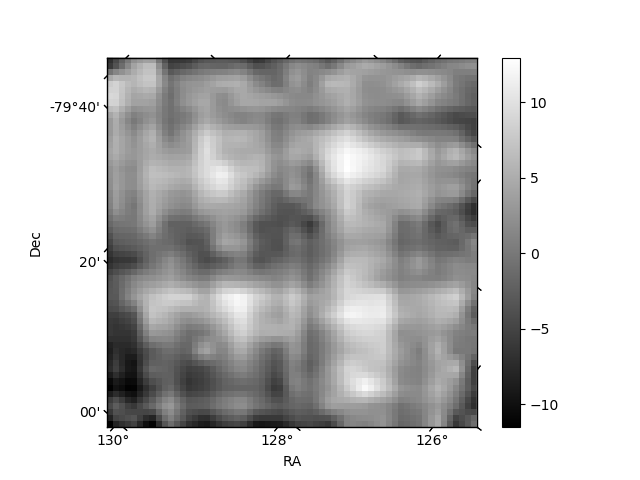
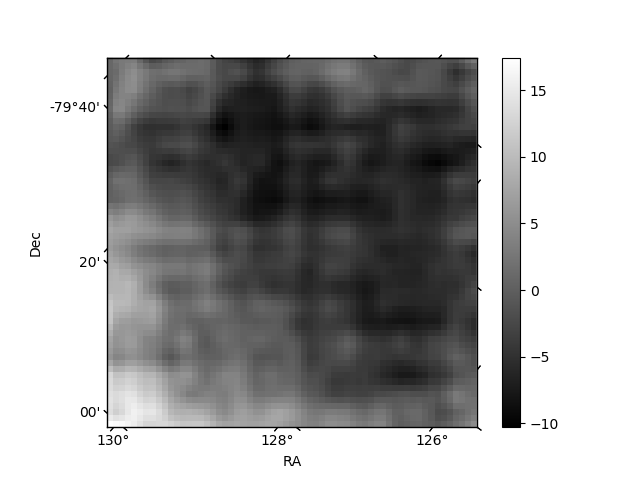
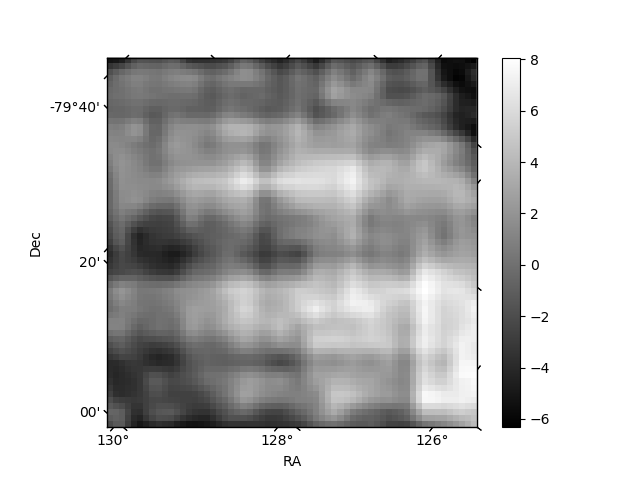
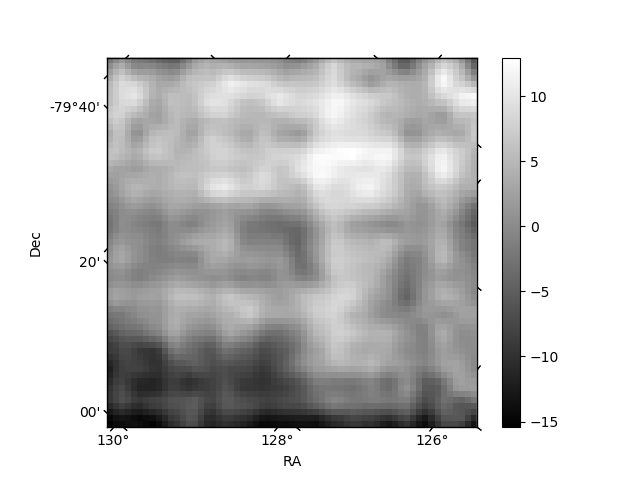
Histogram calculated using DETX and DETY for each event in the final _common_clean file
| Quadrant A | 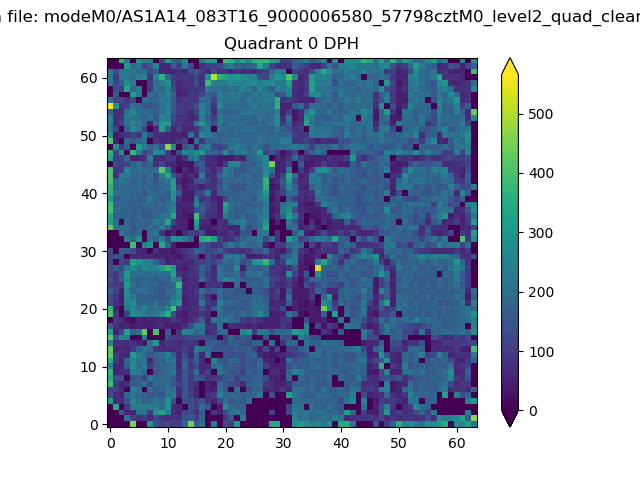 |
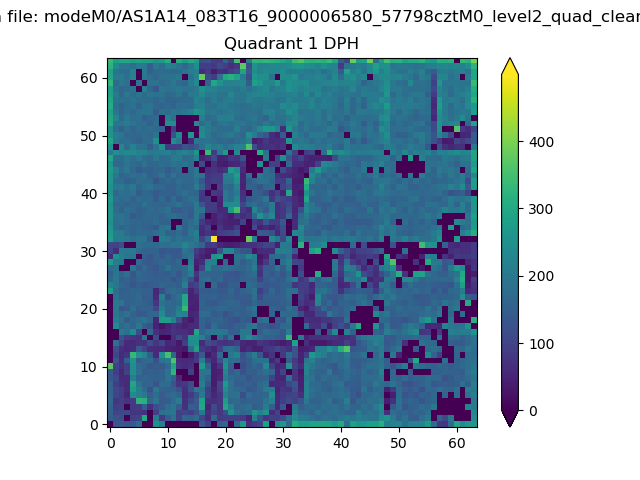 |
Quadrant B |
|---|---|---|---|
| Quadrant D | 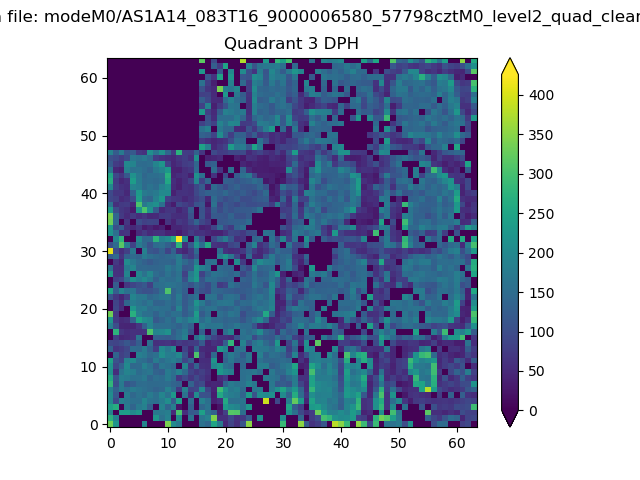 |
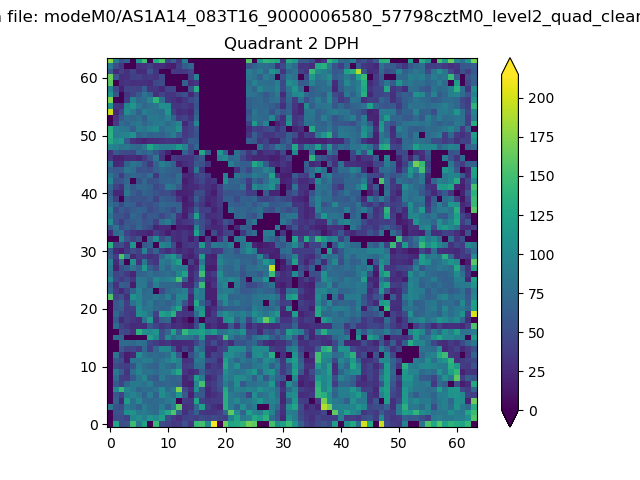 |
Quadrant C |
| Plot type | Count rate plots | Images |
|---|---|---|
| Comparison with Poisson distribution Blue bars denote a histogram of data divided into 1 sec bins. Red curve is a Poisson curve with rate = median count rate of data. |
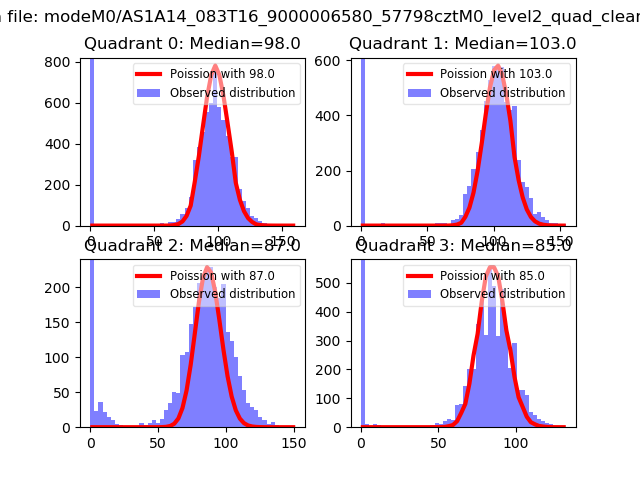 |
 |
| Quadrant-wise count rates Data is divided into 100 sec bins |
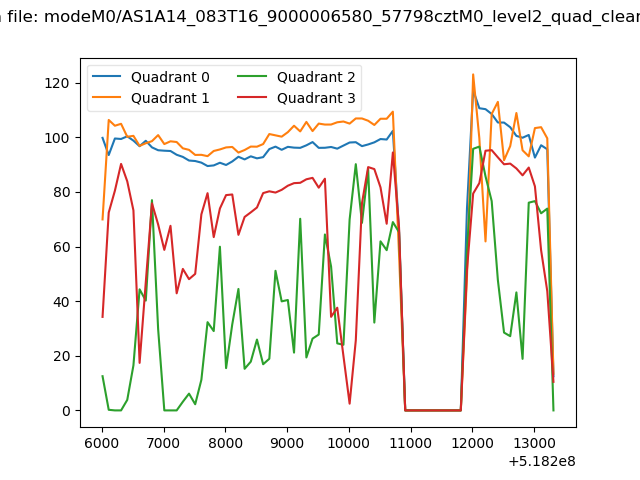 |
|
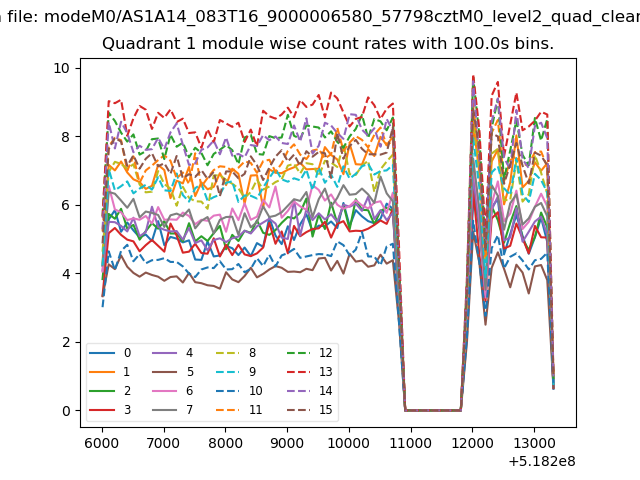
| Module-wise count rates for Quadrant A Data is divided into 100 sec bins |
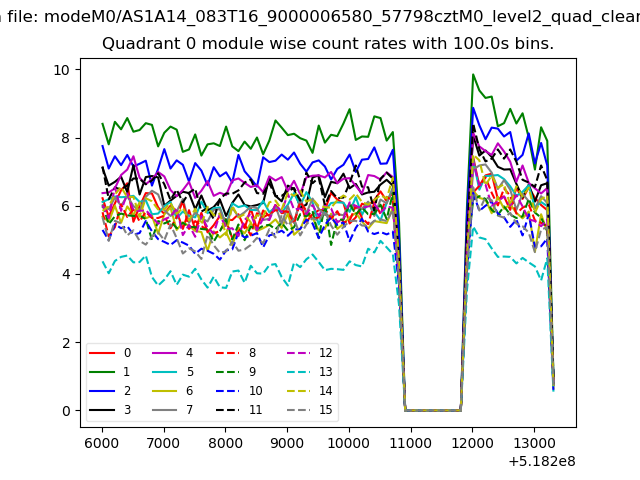 |
 |
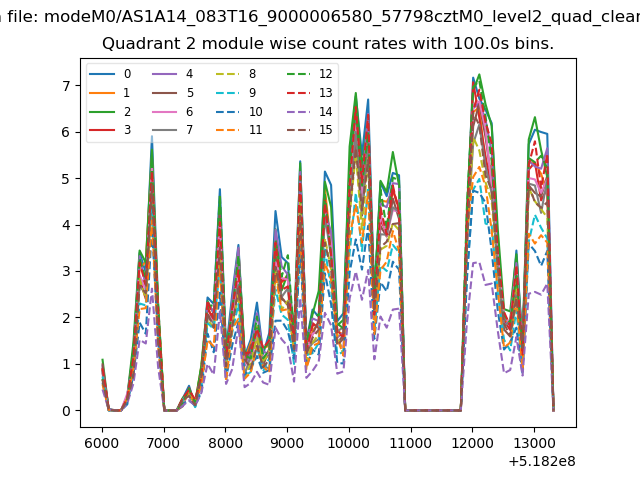
| Module-wise count rates for Quadrant B Data is divided into 100 sec bins |
 |
 |
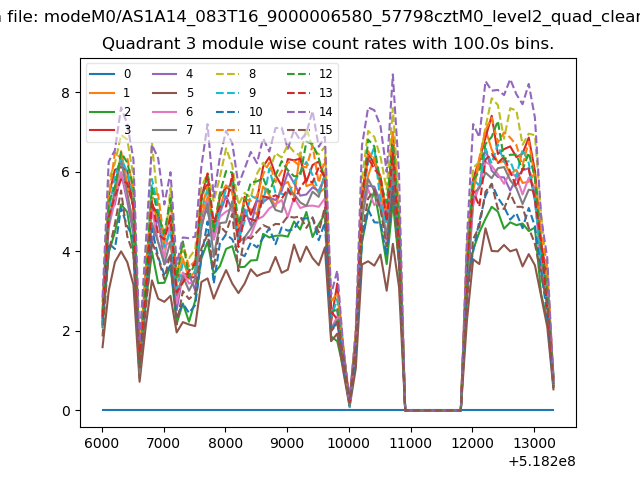
| Module-wise count rates for Quadrant C Data is divided into 100 sec bins |
 |
 |
| Module-wise count rates for Quadrant D Data is divided into 100 sec bins |
 |
 |
| Parameter | Plot |
|---|---|
| CZT HV Monitor | 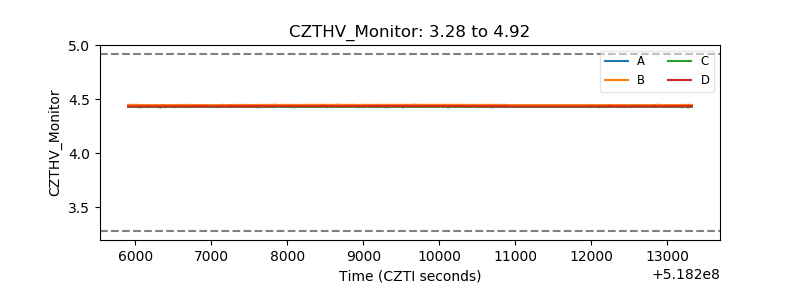 |
| D_VDD | 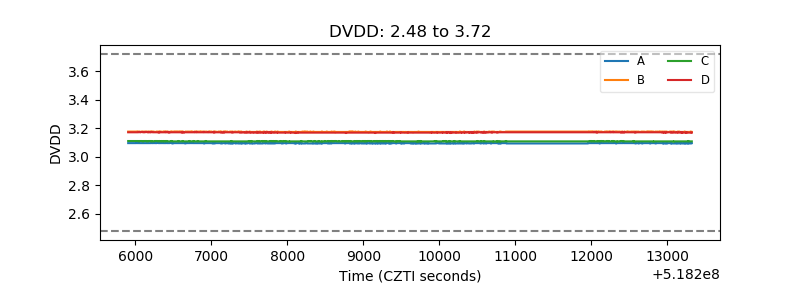 |
| Temperature 1 | 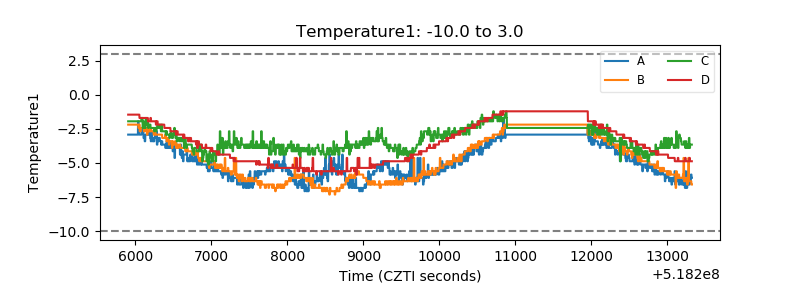 |
| Veto HV Monitor | 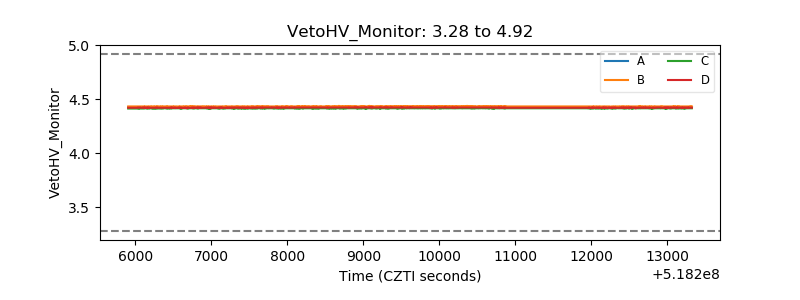 |
| Veto LLD | 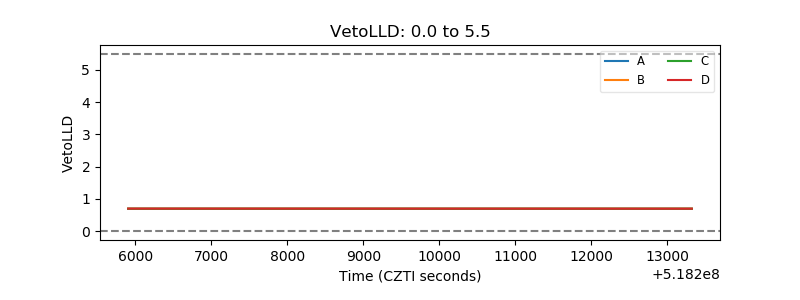 |
| Alpha Counter | 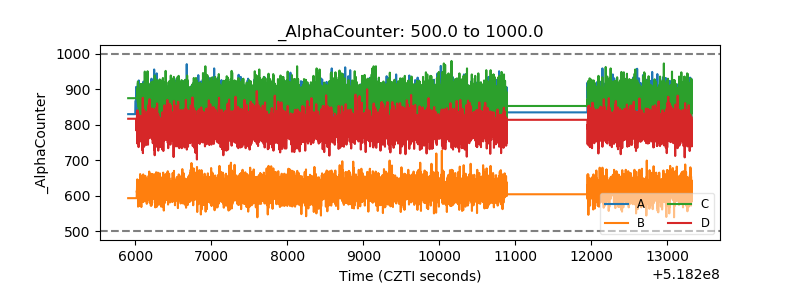 |
| _CPM_Rate | 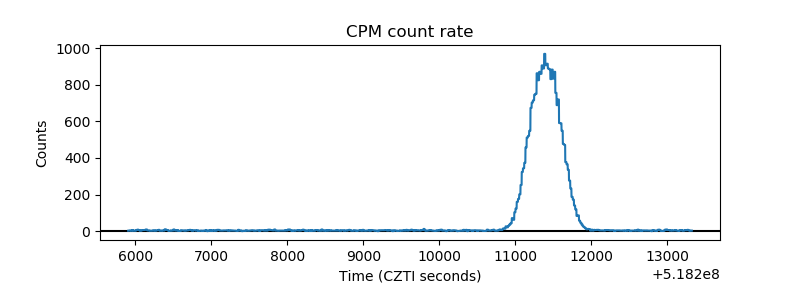 |
| CZT Counter | 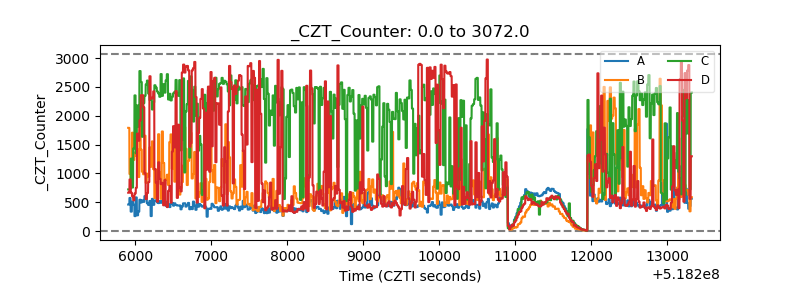 |
| +2.5 Volts monitor | 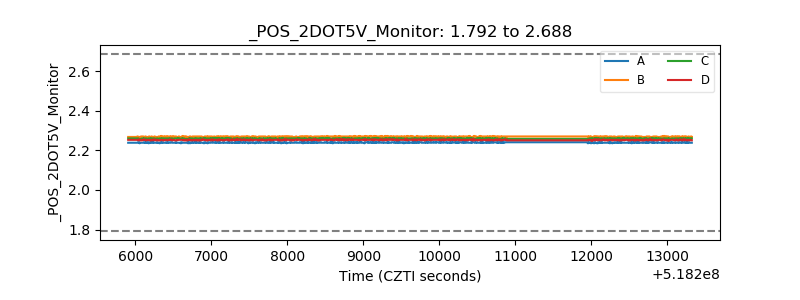 |
| +5 Volts monitor |  |
| _ROLL_ROT | 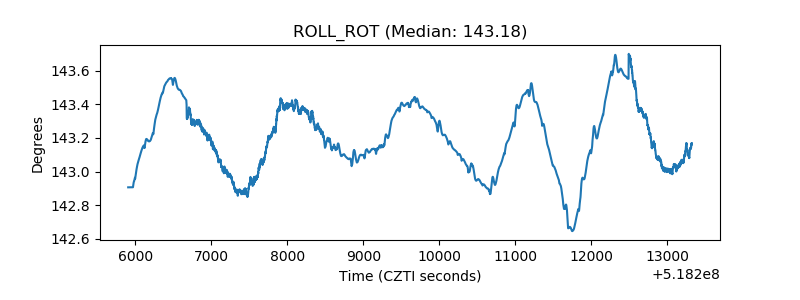 |
| _Roll_DEC | 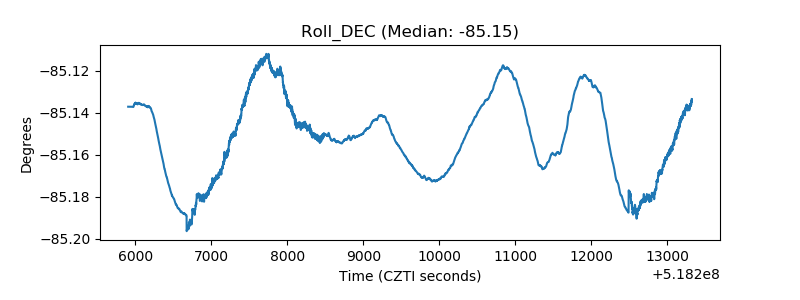 |
| _Roll_RA | 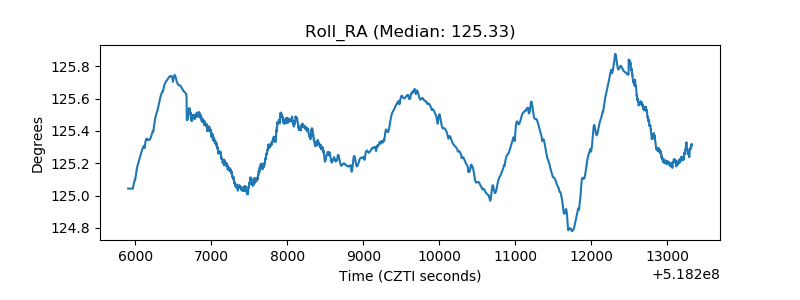 |
| Veto Counter | 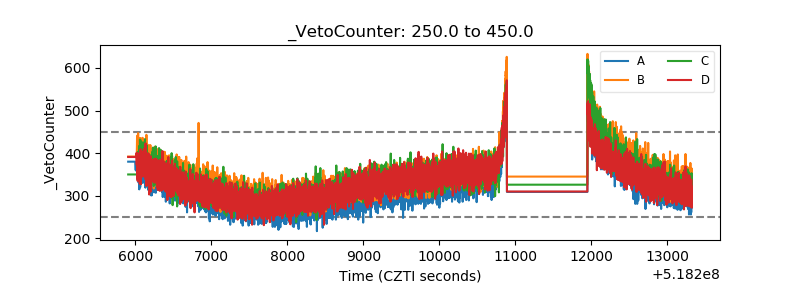 |