| Param | Original file | Final file |
|---|---|---|
| Filename | modeM0/AS1A14_083T16_9000006580_57799cztM0_level2.fits | modeM0/AS1A14_083T16_9000006580_57799cztM0_level2_quad_clean.evt |
| Size (bytes) | 670,055,040 | 84,703,680 |
| Size | 639.0 MB | 80.8 MB |
| Events in quadrant A | 3,126,785 | 632,360 |
| Events in quadrant B | 5,231,750 | 646,551 |
| Events in quadrant C | 11,028,585 | 325,260 |
| Events in quadrant D | 4,929,079 | 522,143 |
| Mode SS | |||
|---|---|---|---|
| Quadrant | BADHDUFLAG | Total packets | Discarded packets |
| A | 0 | 128 | 0 |
| B | 0 | 128 | 0 |
| C | 0 | 128 | 0 |
| D | 0 | 128 | 0 |
| Mode M0 | |||
|---|---|---|---|
| Quadrant | BADHDUFLAG | Total packets | Discarded packets |
| A | 0 | 13851 | 61 |
| B | 0 | 20046 | 127 |
| C | 0 | 37682 | 631 |
| D | 0 | 19261 | 183 |
| Mode M9 | |||
|---|---|---|---|
| Quadrant | BADHDUFLAG | Total packets | Discarded packets |
| A | 0 | 18 | 0 |
| B | 0 | 18 | 0 |
| C | 0 | 18 | 0 |
| D | 0 | 19 | 0 |
| Quadrant | Total seconds | Saturated seconds | Saturation percentage |
|---|---|---|---|
| A | 6301 | 31 | 0.491985% |
| B | 6287 | 361 | 5.742007% |
| C | 6237 | 3203 | 51.354818% |
| D | 6291 | 519 | 8.249881% |
Noise dominated data is calculated using 1-second bins in cleaned event files. If a bin has >2000 counts, and if more than 50% of those come from <1% of pixels, then it is considered to be noise-dominated and hence unusable.
| Quadrant | # 1 sec bins | Bins with >0 counts | Bins with >2000 counts | High rate bins dominated by noise | Noise dominated (total time) | Noise dominated (detector-on time) | Marked lightcurve |
|---|---|---|---|---|---|---|---|
| A | 7496 | 6324 | 19 | 19 | 0.25% | 0.30% | 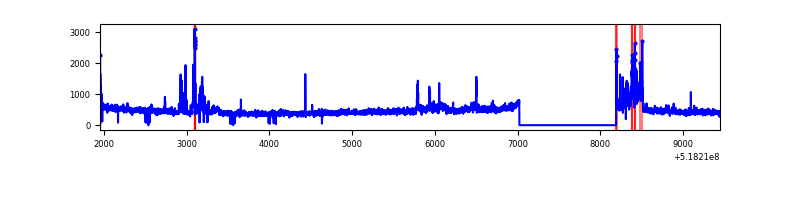 |
| B | 7495 | 6323 | 176 | 176 | 2.35% | 2.78% | 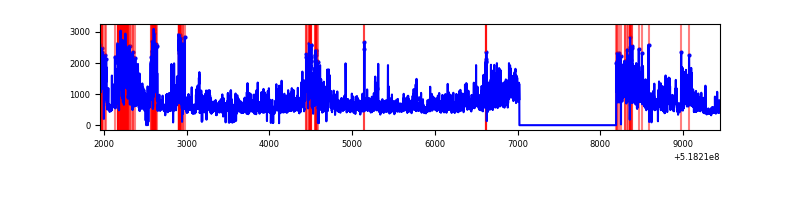 |
| C | 7495 | 6267 | 3011 | 3011 | 40.17% | 48.05% | 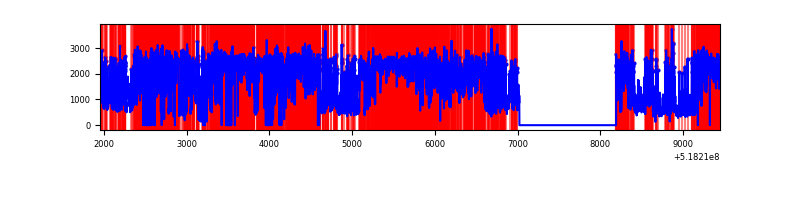 |
| D | 7495 | 6314 | 573 | 573 | 7.65% | 9.08% | 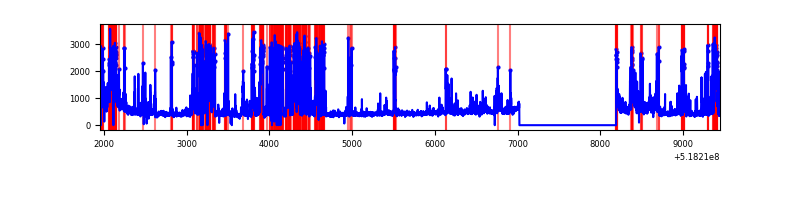 |
Top three noisy pixels from each quadrant. If the there are fewer than three noisy pixels in the level2.evt file, extra rows are filled as -1
| Pixel properties | Quadrant properties | ||||||
|---|---|---|---|---|---|---|---|
| Quadrant | DetID | PixID | Counts | Sigma | Mean | Median | Sigma |
| A | 3 | 14 | 459728 | 2729.62 | 677 | 660 | 168.2 |
| A | 3 | 128 | 31640 | 184.21 | 677 | 660 | 168.2 |
| A | 3 | 137 | 8064 | 44.02 | 677 | 660 | 168.2 |
| B | 4 | 80 | 2117212 | 15313.55 | 661 | 639 | 138.2 |
| B | 10 | 247 | 154356 | 1112.15 | 661 | 639 | 138.2 |
| B | 4 | 171 | 60330 | 431.87 | 661 | 639 | 138.2 |
| C | 9 | 38 | 7870721 | 54116.3 | 532 | 526 | 145.4 |
| C | 15 | 224 | 901943 | 6198.24 | 532 | 526 | 145.4 |
| C | 12 | 2 | 70259 | 479.49 | 532 | 526 | 145.4 |
| D | 12 | 0 | 1886857 | 10542.85 | 627 | 597 | 178.9 |
| D | 8 | 160 | 165267 | 920.39 | 627 | 597 | 178.9 |
| D | 2 | 249 | 131172 | 729.82 | 627 | 597 | 178.9 |
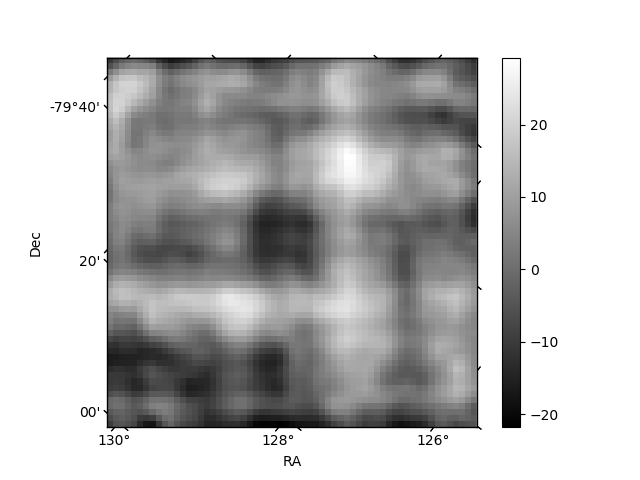
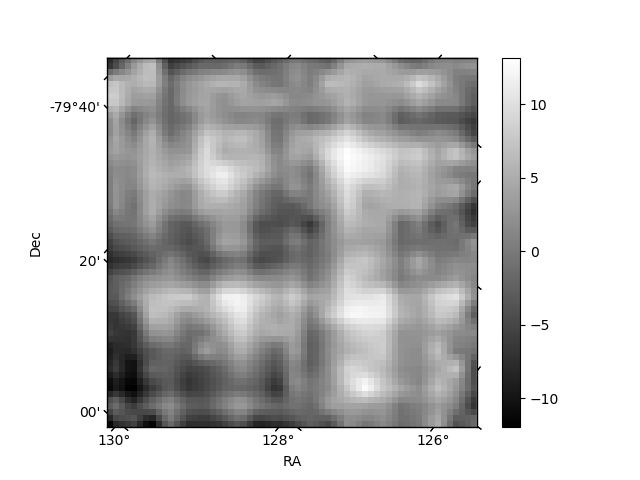
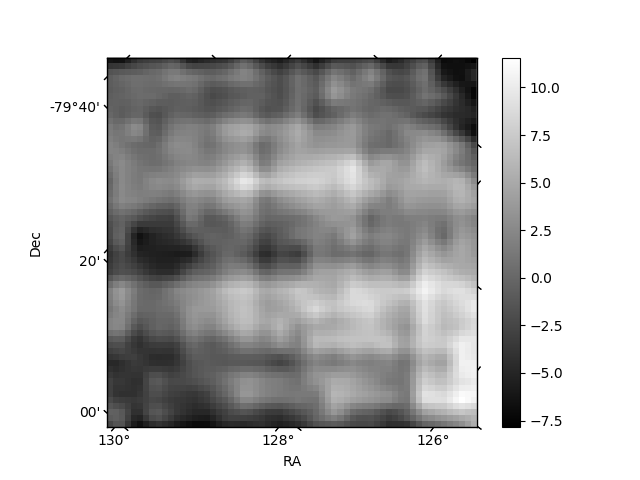
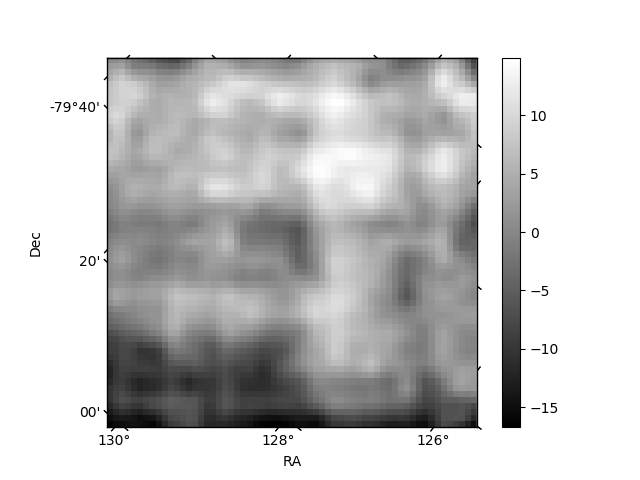
Histogram calculated using DETX and DETY for each event in the final _common_clean file
| Quadrant A | 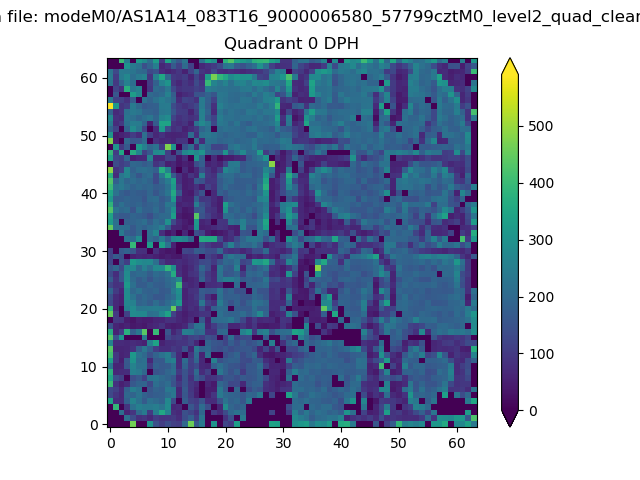 |
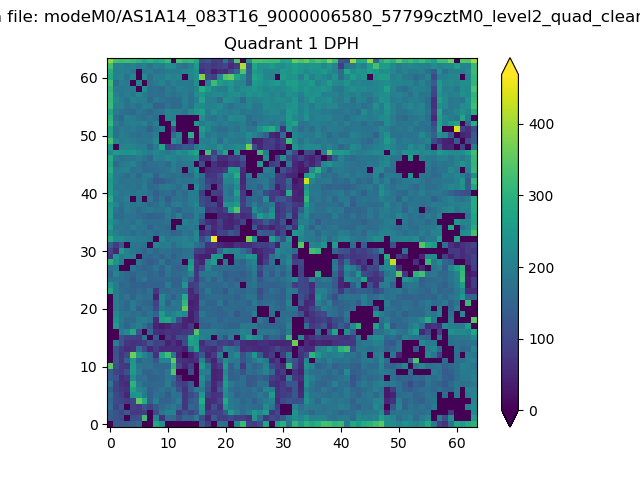 |
Quadrant B |
|---|---|---|---|
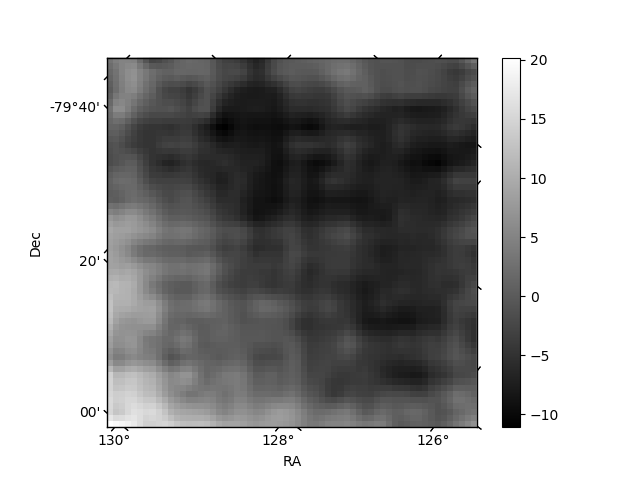
| Quadrant D | 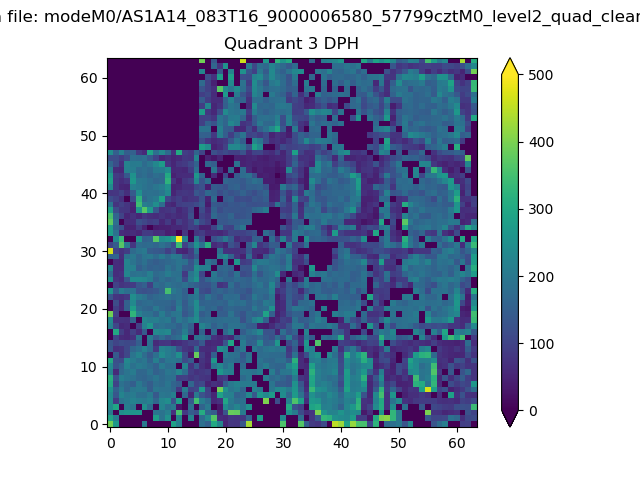 |
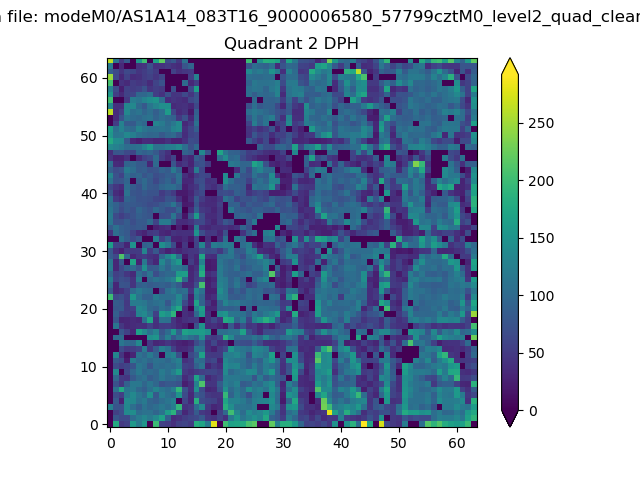 |
Quadrant C |
| Plot type | Count rate plots | Images |
|---|---|---|
| Comparison with Poisson distribution Blue bars denote a histogram of data divided into 1 sec bins. Red curve is a Poisson curve with rate = median count rate of data. |
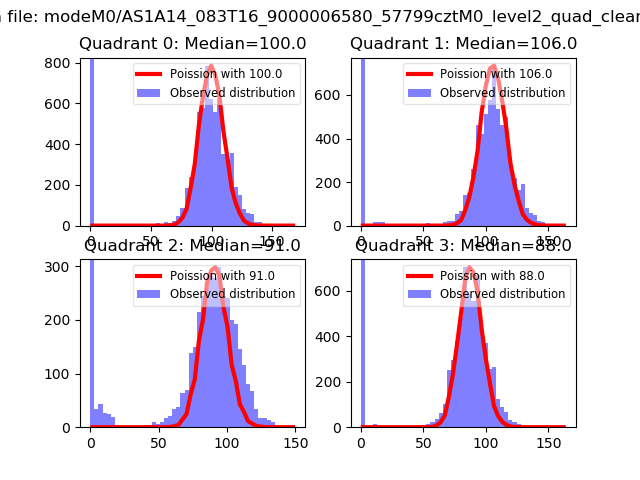 |
 |
| Quadrant-wise count rates Data is divided into 100 sec bins |
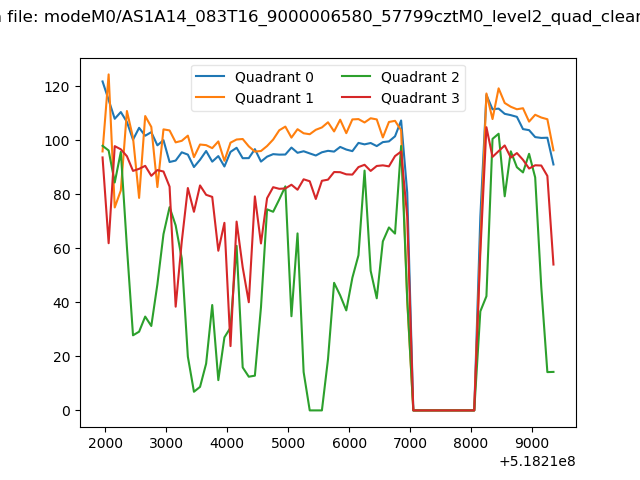 |
|
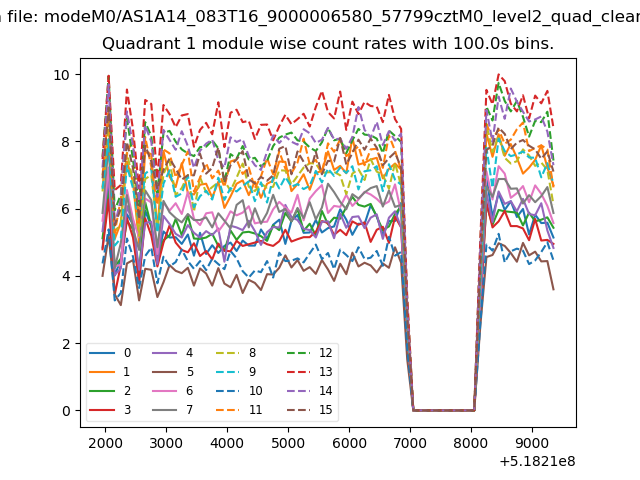
| Module-wise count rates for Quadrant A Data is divided into 100 sec bins |
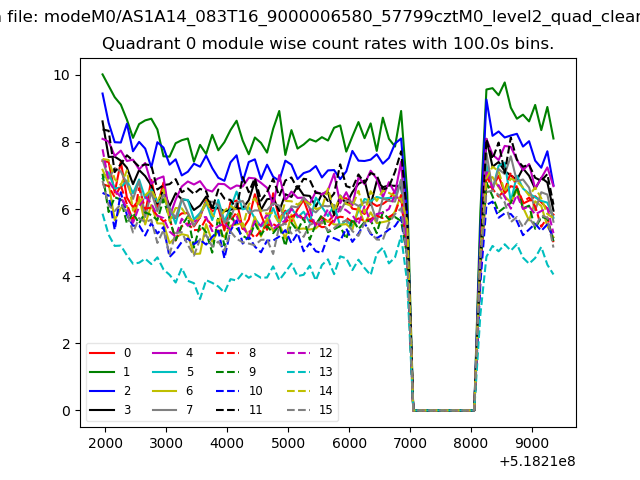 |
 |
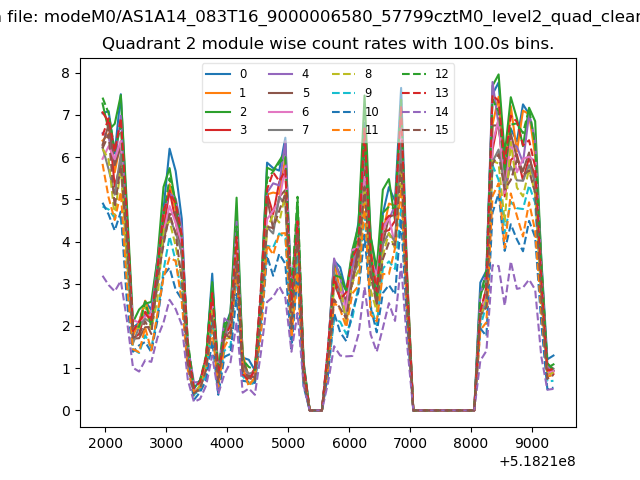
| Module-wise count rates for Quadrant B Data is divided into 100 sec bins |
 |
 |
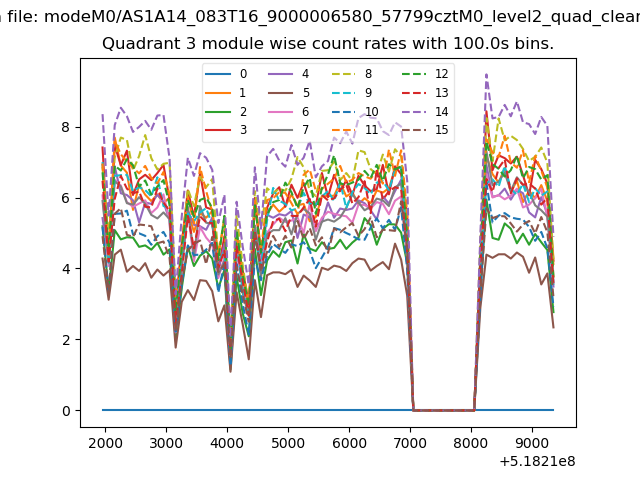
| Module-wise count rates for Quadrant C Data is divided into 100 sec bins |
 |
 |
| Module-wise count rates for Quadrant D Data is divided into 100 sec bins |
 |
 |
| Parameter | Plot |
|---|---|
| CZT HV Monitor | 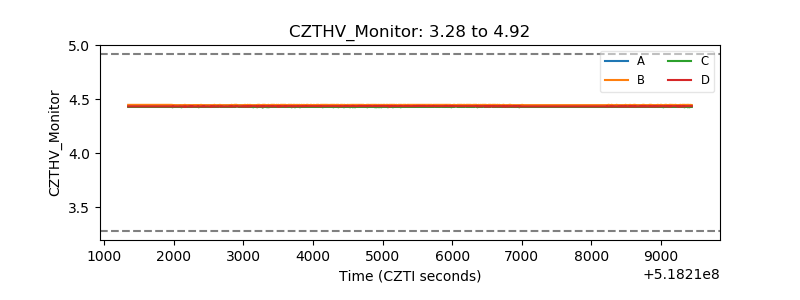 |
| D_VDD | 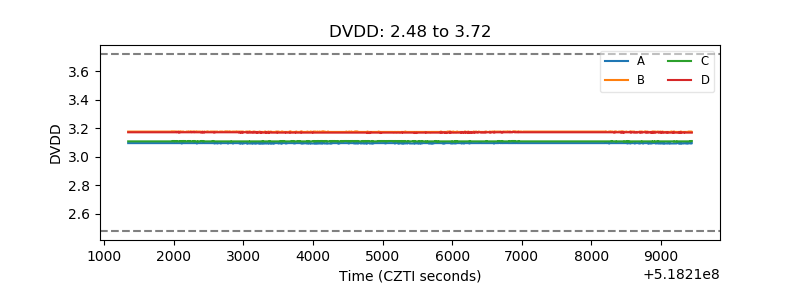 |
| Temperature 1 | 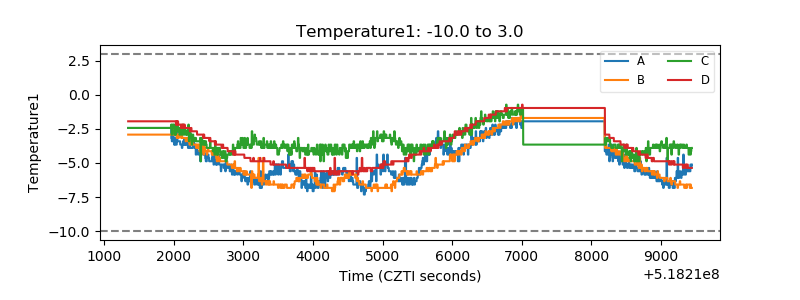 |
| Veto HV Monitor | 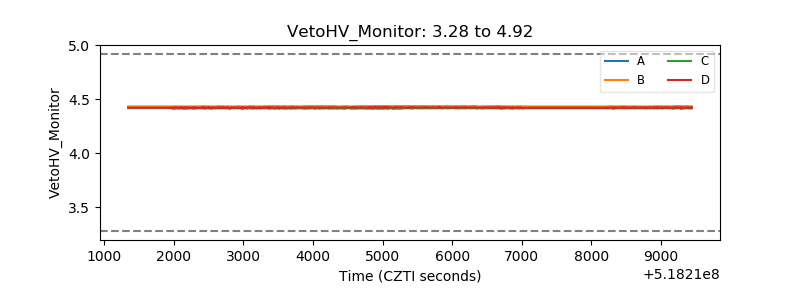 |
| Veto LLD | 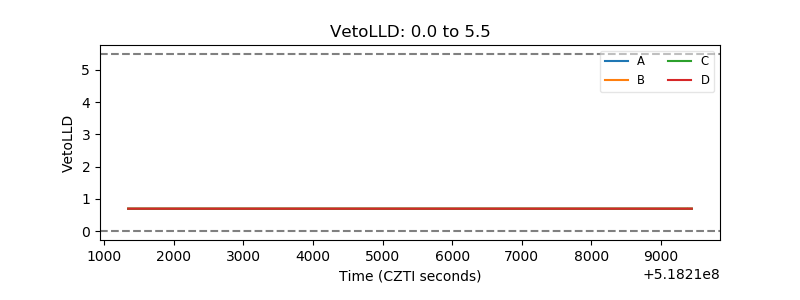 |
| Alpha Counter | 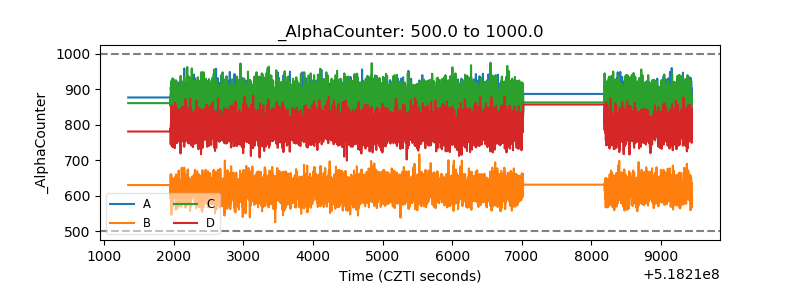 |
| _CPM_Rate | 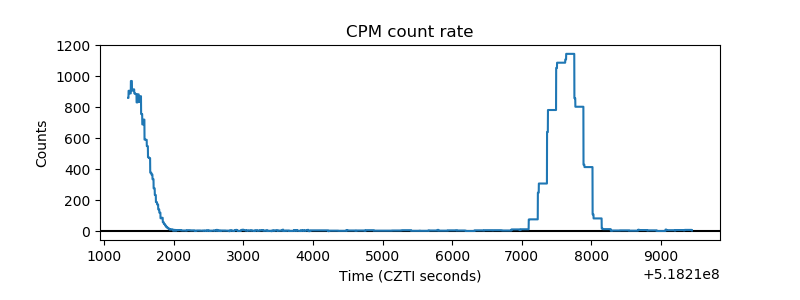 |
| CZT Counter | 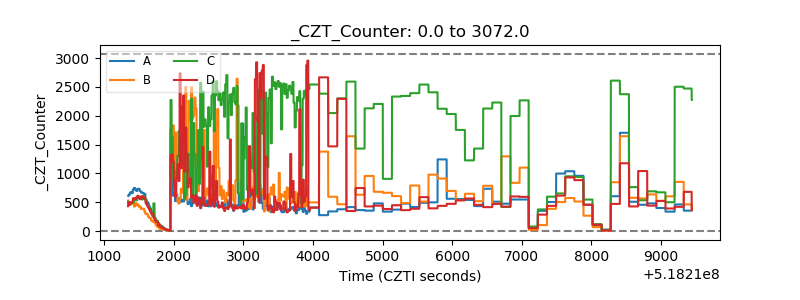 |
| +2.5 Volts monitor |  |
| +5 Volts monitor |  |
| _ROLL_ROT | 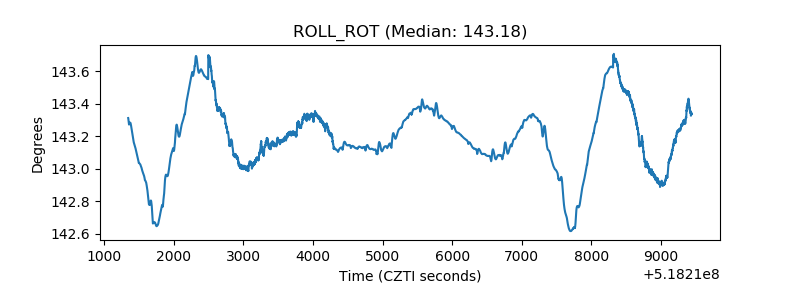 |
| _Roll_DEC | 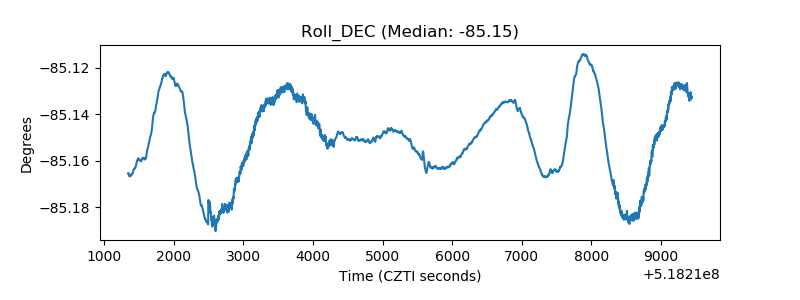 |
| _Roll_RA | 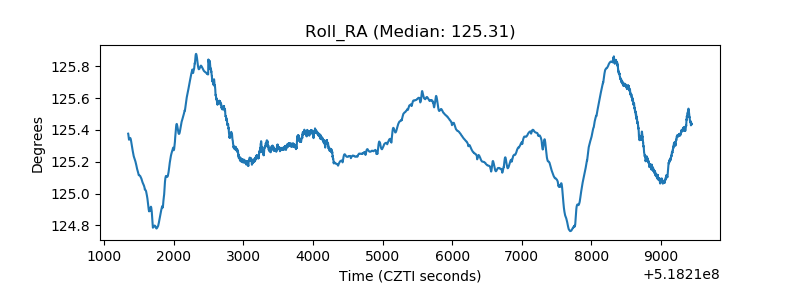 |
| Veto Counter | 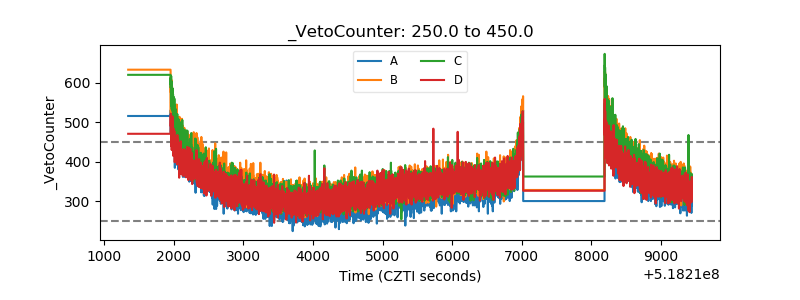 |