| Param | Original file | Final file |
|---|---|---|
| Filename | modeM0/AS1A14_083T16_9000006580_57800cztM0_level2.fits | modeM0/AS1A14_083T16_9000006580_57800cztM0_level2_quad_clean.evt |
| Size (bytes) | 657,495,360 | 88,997,760 |
| Size | 627.0 MB | 84.9 MB |
| Events in quadrant A | 3,531,872 | 638,319 |
| Events in quadrant B | 5,136,661 | 674,190 |
| Events in quadrant C | 10,516,820 | 396,478 |
| Events in quadrant D | 4,657,654 | 539,650 |
| Mode SS | |||
|---|---|---|---|
| Quadrant | BADHDUFLAG | Total packets | Discarded packets |
| A | 0 | 132 | 0 |
| B | 0 | 132 | 0 |
| C | 0 | 132 | 0 |
| D | 0 | 132 | 0 |
| Mode M0 | |||
|---|---|---|---|
| Quadrant | BADHDUFLAG | Total packets | Discarded packets |
| A | 0 | 15168 | 2 |
| B | 0 | 19770 | 2 |
| C | 0 | 35682 | 2 |
| D | 0 | 18450 | 2 |
| Mode M9 | |||
|---|---|---|---|
| Quadrant | BADHDUFLAG | Total packets | Discarded packets |
| A | 0 | 24 | 0 |
| B | 0 | 24 | 0 |
| C | 0 | 24 | 0 |
| D | 0 | 24 | 0 |
| Quadrant | Total seconds | Saturated seconds | Saturation percentage |
|---|---|---|---|
| A | 6391 | 144 | 2.253169% |
| B | 6391 | 317 | 4.960100% |
| C | 6392 | 2638 | 41.270338% |
| D | 6392 | 464 | 7.259074% |
Noise dominated data is calculated using 1-second bins in cleaned event files. If a bin has >2000 counts, and if more than 50% of those come from <1% of pixels, then it is considered to be noise-dominated and hence unusable.
| Quadrant | # 1 sec bins | Bins with >0 counts | Bins with >2000 counts | High rate bins dominated by noise | Noise dominated (total time) | Noise dominated (detector-on time) | Marked lightcurve |
|---|---|---|---|---|---|---|---|
| A | 8796 | 6393 | 105 | 105 | 1.19% | 1.64% | 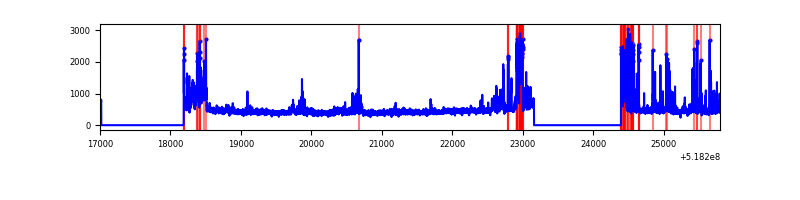 |
| B | 8796 | 6392 | 106 | 106 | 1.21% | 1.66% | 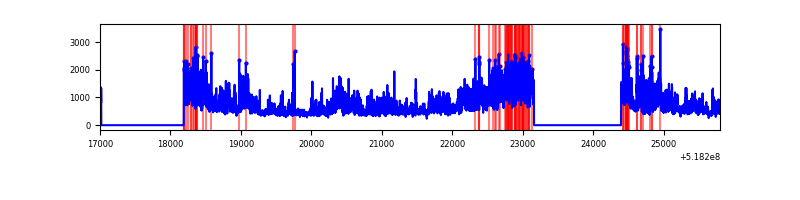 |
| C | 8797 | 6393 | 2486 | 2486 | 28.26% | 38.89% | 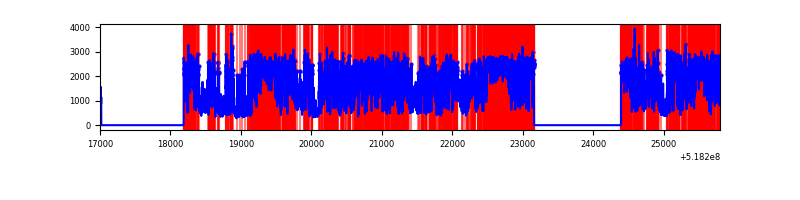 |
| D | 8796 | 6393 | 474 | 474 | 5.39% | 7.41% | 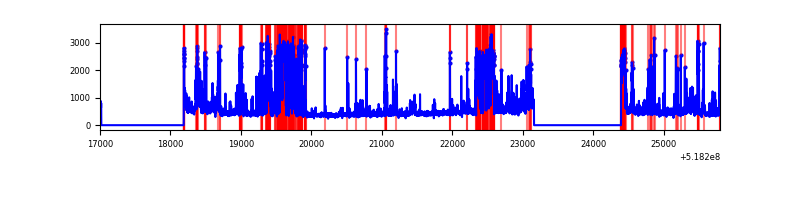 |
Top three noisy pixels from each quadrant. If the there are fewer than three noisy pixels in the level2.evt file, extra rows are filled as -1
| Pixel properties | Quadrant properties | ||||||
|---|---|---|---|---|---|---|---|
| Quadrant | DetID | PixID | Counts | Sigma | Mean | Median | Sigma |
| A | 3 | 14 | 546495 | 3248.9 | 681 | 664 | 168.0 |
| A | 10 | 251 | 285690 | 1696.54 | 681 | 664 | 168.0 |
| A | 3 | 128 | 30391 | 176.94 | 681 | 664 | 168.0 |
| B | 4 | 80 | 1936319 | 13667.2 | 675 | 650 | 141.6 |
| B | 0 | 171 | 102962 | 722.4 | 675 | 650 | 141.6 |
| B | 10 | 247 | 90899 | 637.22 | 675 | 650 | 141.6 |
| C | 9 | 38 | 5516296 | 36156.62 | 554 | 548 | 152.6 |
| C | 15 | 224 | 2171926 | 14233.73 | 554 | 548 | 152.6 |
| C | 12 | 252 | 570246 | 3734.46 | 554 | 548 | 152.6 |
| D | 12 | 0 | 932104 | 5107.37 | 636 | 606 | 182.4 |
| D | 2 | 249 | 595850 | 3263.7 | 636 | 606 | 182.4 |
| D | 8 | 160 | 315739 | 1727.86 | 636 | 606 | 182.4 |
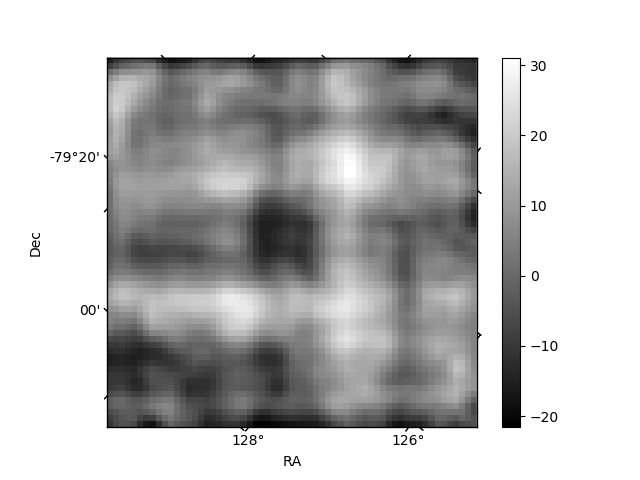
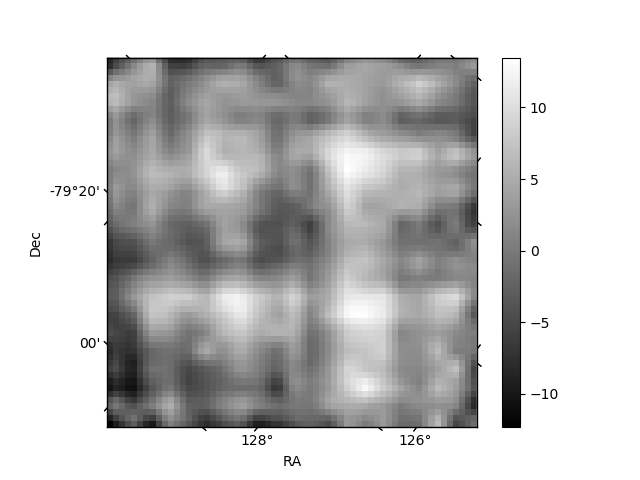
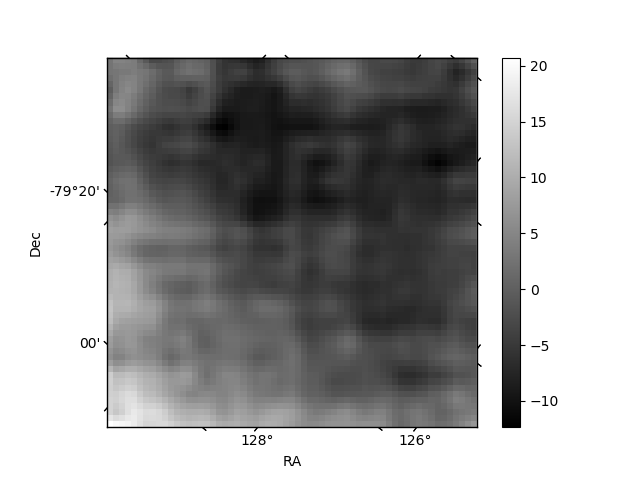
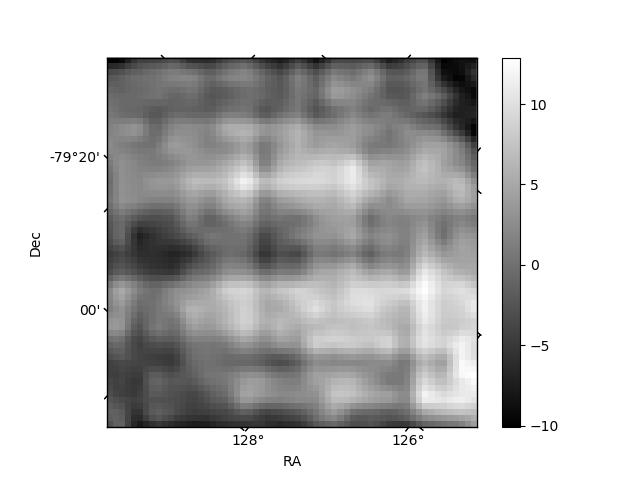
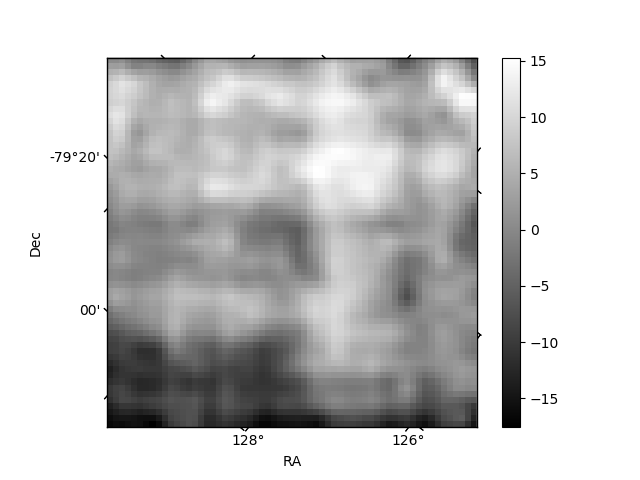
Histogram calculated using DETX and DETY for each event in the final _common_clean file
| Quadrant A | 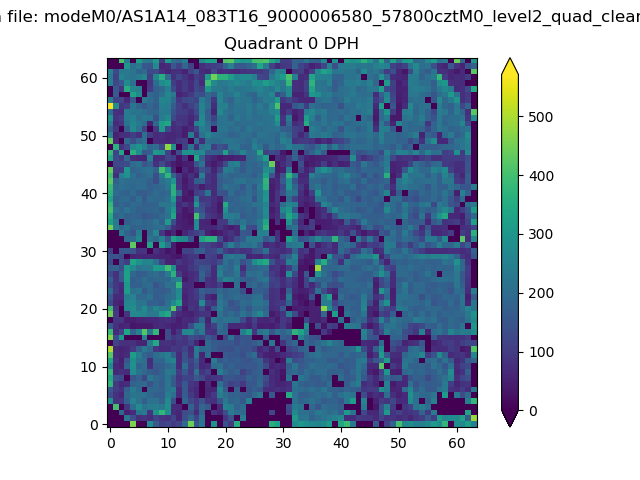 |
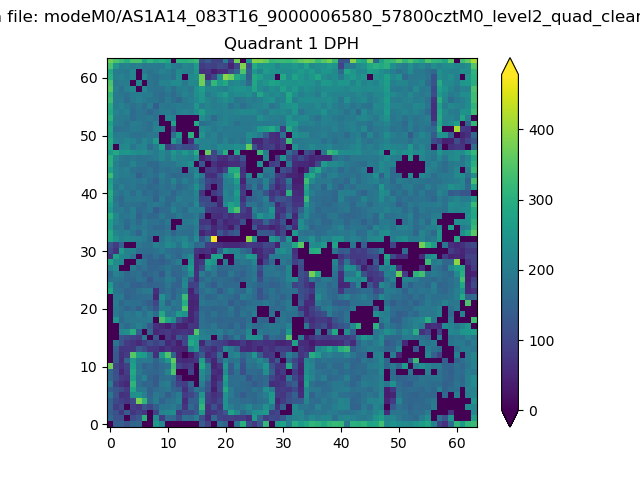 |
Quadrant B |
|---|---|---|---|
| Quadrant D | 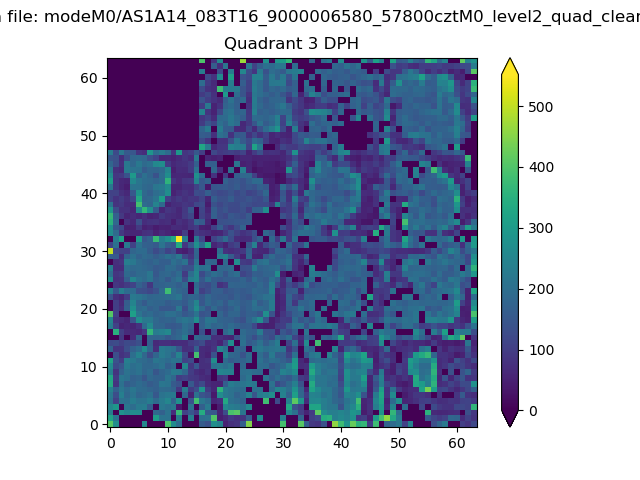 |
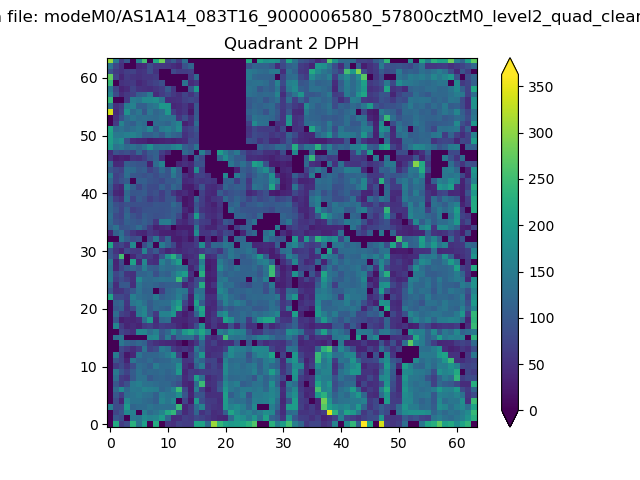 |
Quadrant C |
| Plot type | Count rate plots | Images |
|---|---|---|
| Comparison with Poisson distribution Blue bars denote a histogram of data divided into 1 sec bins. Red curve is a Poisson curve with rate = median count rate of data. |
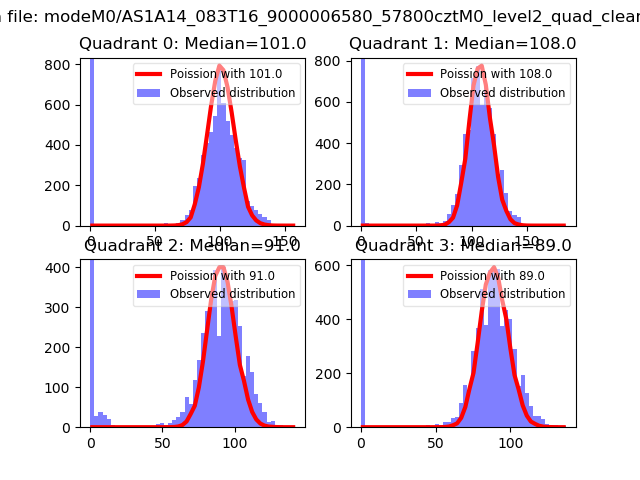 |
 |
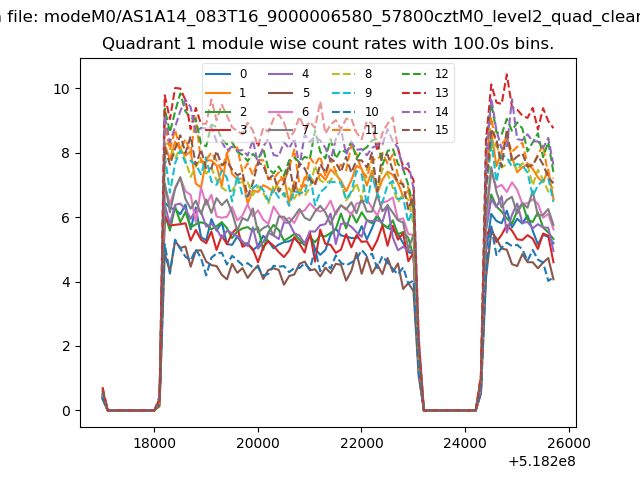
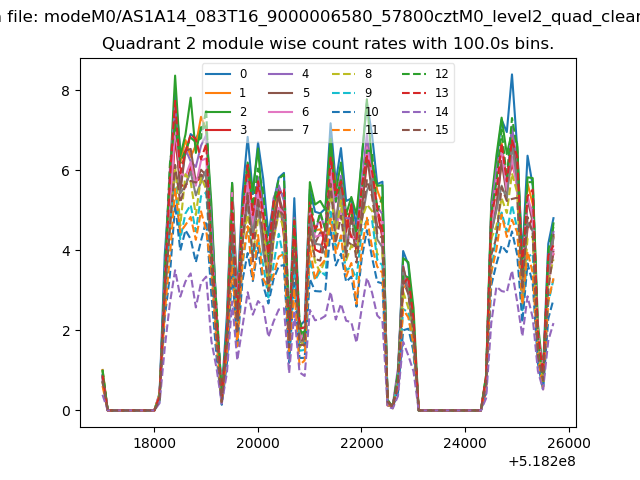
| Quadrant-wise count rates Data is divided into 100 sec bins |
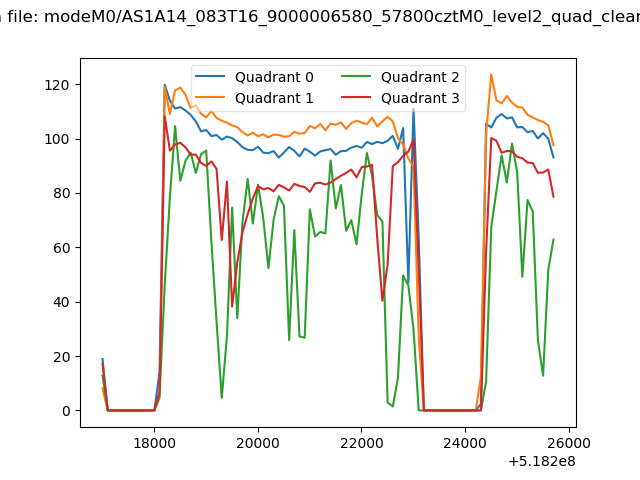 |
|
| Module-wise count rates for Quadrant A Data is divided into 100 sec bins |
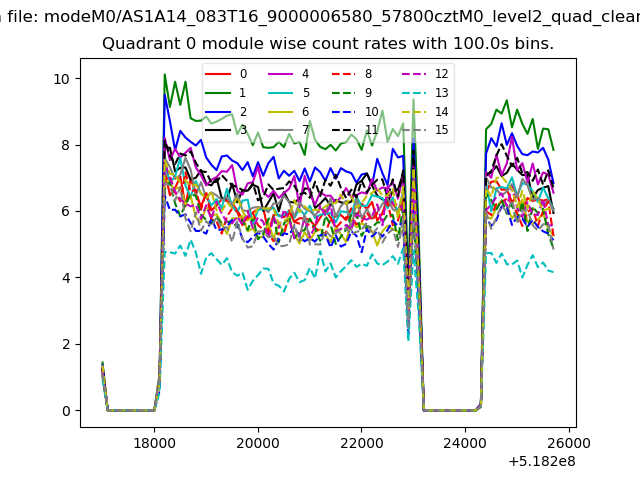 |
 |
| Module-wise count rates for Quadrant B Data is divided into 100 sec bins |
 |
 |
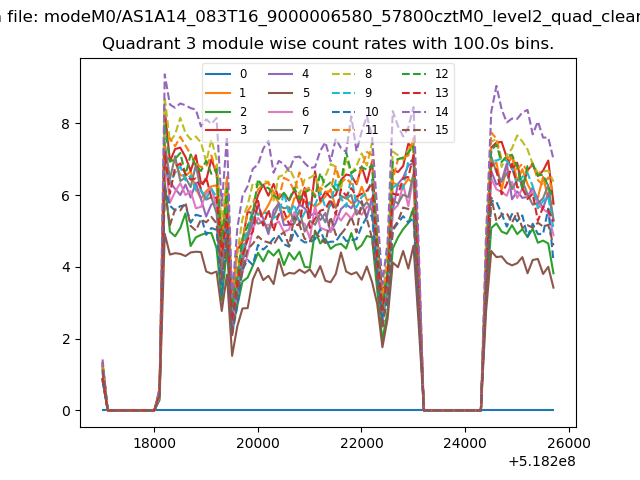
| Module-wise count rates for Quadrant C Data is divided into 100 sec bins |
 |
 |
| Module-wise count rates for Quadrant D Data is divided into 100 sec bins |
 |
 |
| Parameter | Plot |
|---|---|
| CZT HV Monitor | 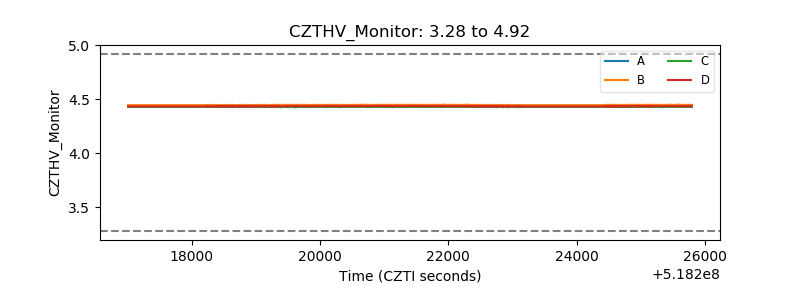 |
| D_VDD | 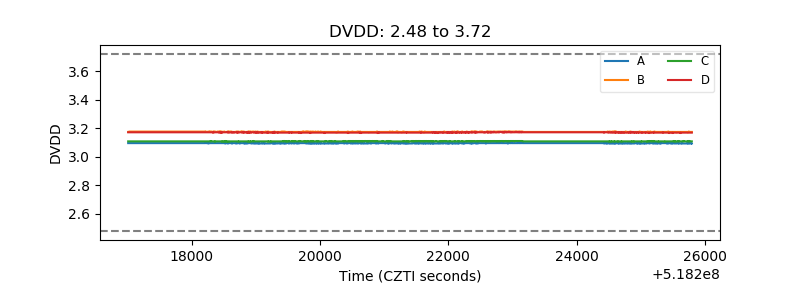 |
| Temperature 1 | 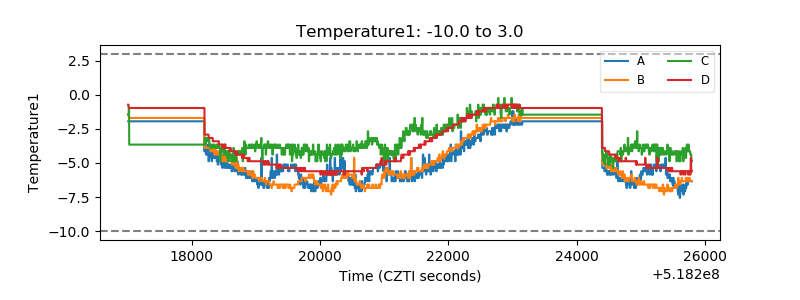 |
| Veto HV Monitor | 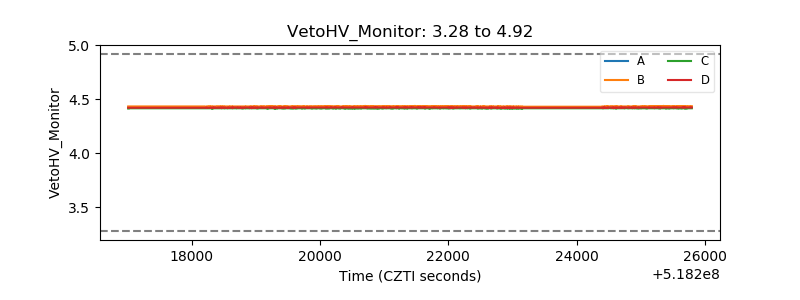 |
| Veto LLD | 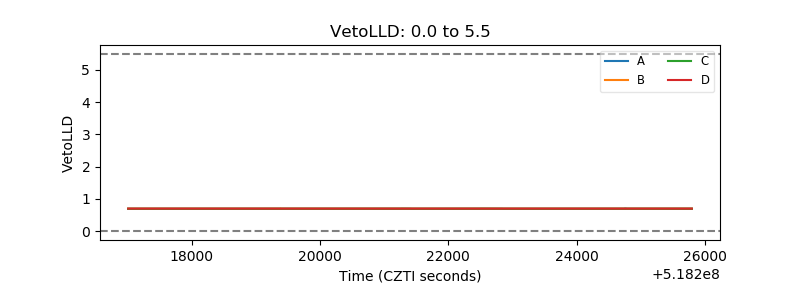 |
| Alpha Counter | 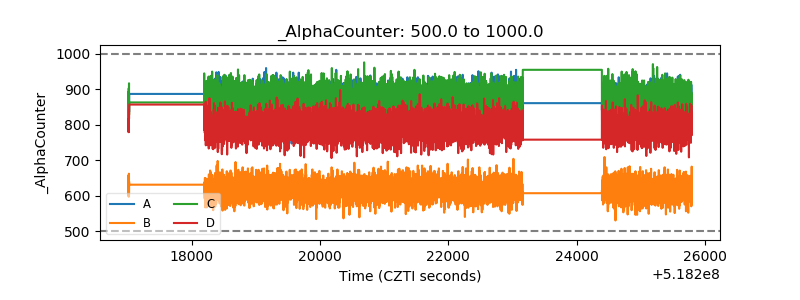 |
| _CPM_Rate | 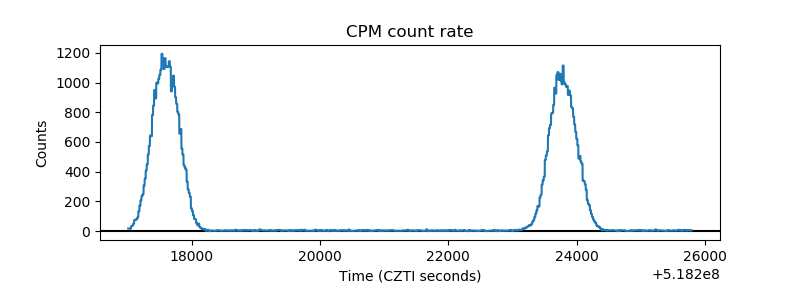 |
| CZT Counter | 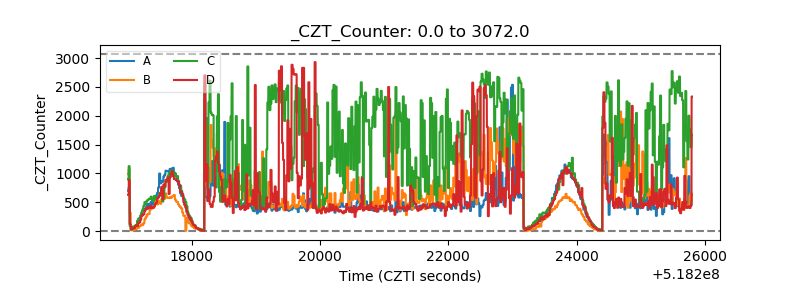 |
| +2.5 Volts monitor | 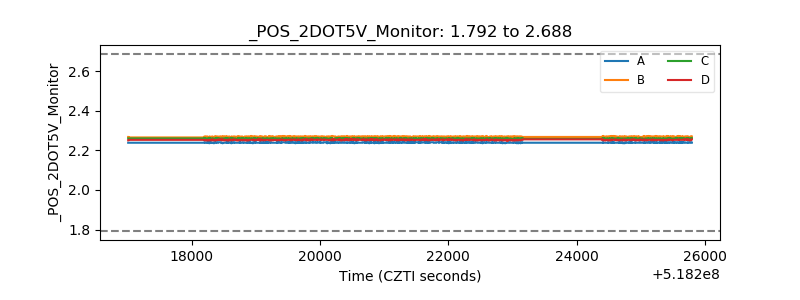 |
| +5 Volts monitor |  |
| _ROLL_ROT | 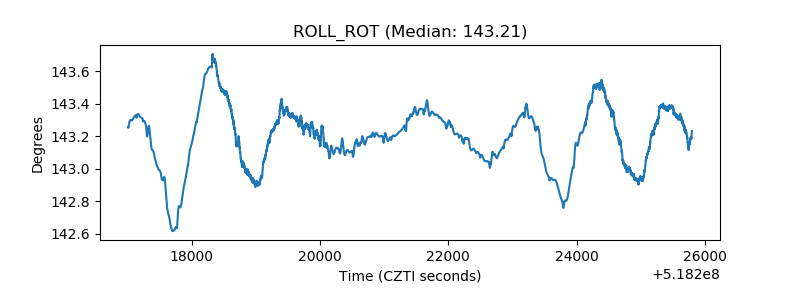 |
| _Roll_DEC | 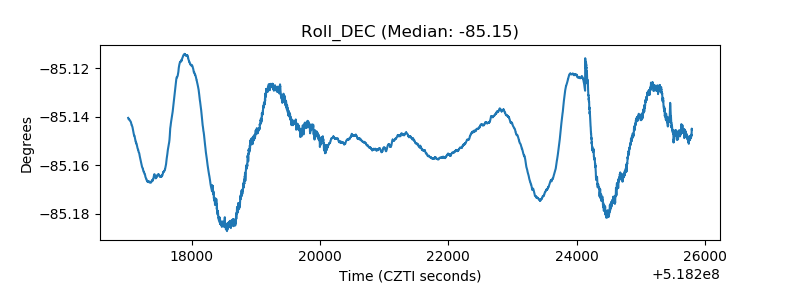 |
| _Roll_RA | 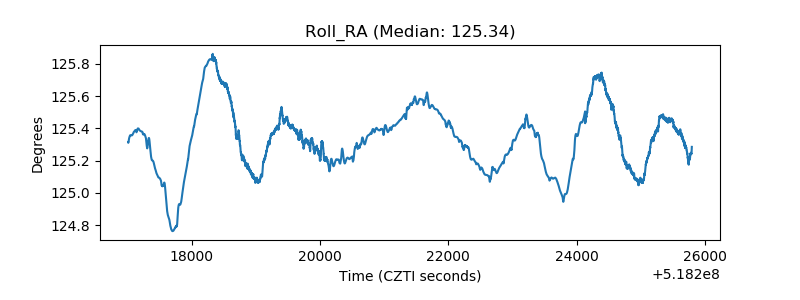 |
| Veto Counter | 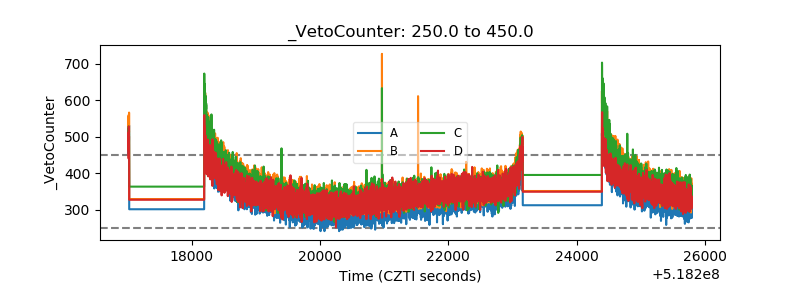 |