| Param | Original file | Final file |
|---|---|---|
| Filename | modeM0/AS1A14_083T16_9000006580_57802cztM0_level2.fits | modeM0/AS1A14_083T16_9000006580_57802cztM0_level2_quad_clean.evt |
| Size (bytes) | 614,407,680 | 96,546,240 |
| Size | 585.9 MB | 92.1 MB |
| Events in quadrant A | 3,756,777 | 649,717 |
| Events in quadrant B | 4,897,325 | 709,156 |
| Events in quadrant C | 8,909,326 | 516,195 |
| Events in quadrant D | 4,650,886 | 572,128 |
| Mode SS | |||
|---|---|---|---|
| Quadrant | BADHDUFLAG | Total packets | Discarded packets |
| A | 0 | 140 | 0 |
| B | 0 | 140 | 0 |
| C | 0 | 140 | 0 |
| D | 0 | 140 | 0 |
| Mode M0 | |||
|---|---|---|---|
| Quadrant | BADHDUFLAG | Total packets | Discarded packets |
| A | 0 | 16218 | 2 |
| B | 0 | 19267 | 2 |
| C | 0 | 31282 | 2 |
| D | 0 | 18595 | 2 |
| Mode M9 | |||
|---|---|---|---|
| Quadrant | BADHDUFLAG | Total packets | Discarded packets |
| A | 0 | 15 | 0 |
| B | 0 | 16 | 0 |
| C | 0 | 16 | 0 |
| D | 0 | 16 | 0 |
| Quadrant | Total seconds | Saturated seconds | Saturation percentage |
|---|---|---|---|
| A | 6826 | 259 | 3.794316% |
| B | 6826 | 169 | 2.475828% |
| C | 6826 | 1589 | 23.278640% |
| D | 6826 | 373 | 5.464401% |
Noise dominated data is calculated using 1-second bins in cleaned event files. If a bin has >2000 counts, and if more than 50% of those come from <1% of pixels, then it is considered to be noise-dominated and hence unusable.
| Quadrant | # 1 sec bins | Bins with >0 counts | Bins with >2000 counts | High rate bins dominated by noise | Noise dominated (total time) | Noise dominated (detector-on time) | Marked lightcurve |
|---|---|---|---|---|---|---|---|
| A | 7876 | 6826 | 160 | 160 | 2.03% | 2.34% | 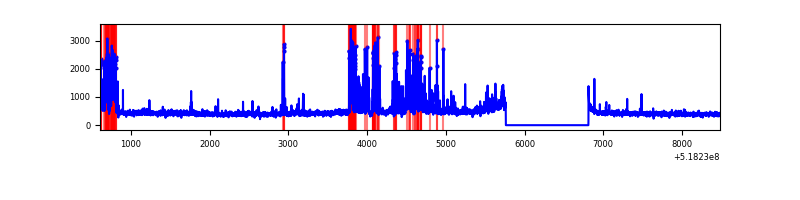 |
| B | 7876 | 6826 | 41 | 41 | 0.52% | 0.60% | 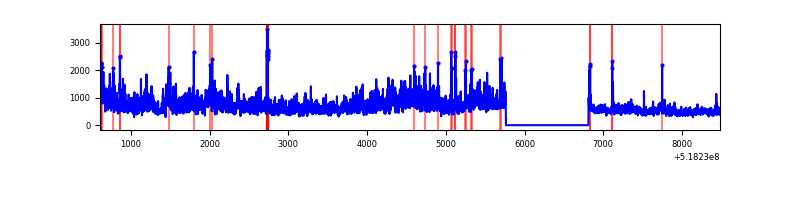 |
| C | 7876 | 6826 | 1447 | 1447 | 18.37% | 21.20% | 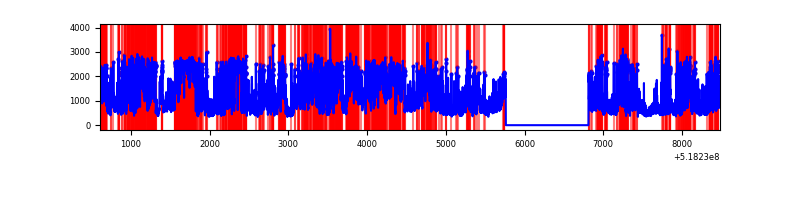 |
| D | 7876 | 6827 | 382 | 382 | 4.85% | 5.60% | 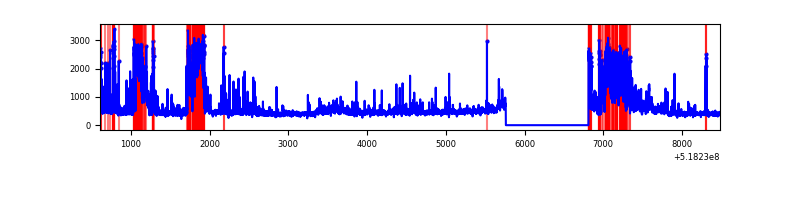 |
Top three noisy pixels from each quadrant. If the there are fewer than three noisy pixels in the level2.evt file, extra rows are filled as -1
| Pixel properties | Quadrant properties | ||||||
|---|---|---|---|---|---|---|---|
| Quadrant | DetID | PixID | Counts | Sigma | Mean | Median | Sigma |
| A | 10 | 251 | 873420 | 4942.85 | 712 | 694 | 176.6 |
| A | 3 | 128 | 68677 | 385.03 | 712 | 694 | 176.6 |
| A | 3 | 14 | 44413 | 247.61 | 712 | 694 | 176.6 |
| B | 4 | 80 | 1632991 | 10750.37 | 716 | 692 | 151.8 |
| B | 0 | 63 | 131367 | 860.63 | 716 | 692 | 151.8 |
| B | 2 | 249 | 56465 | 367.32 | 716 | 692 | 151.8 |
| C | 9 | 38 | 4151156 | 23495.28 | 651 | 645 | 176.7 |
| C | 15 | 224 | 1952592 | 11049.61 | 651 | 645 | 176.7 |
| C | 14 | 254 | 88443 | 497.01 | 651 | 645 | 176.7 |
| D | 8 | 160 | 1593846 | 8130.52 | 690 | 657 | 196.0 |
| D | 12 | 0 | 134476 | 682.92 | 690 | 657 | 196.0 |
| D | 3 | 12 | 92938 | 470.94 | 690 | 657 | 196.0 |
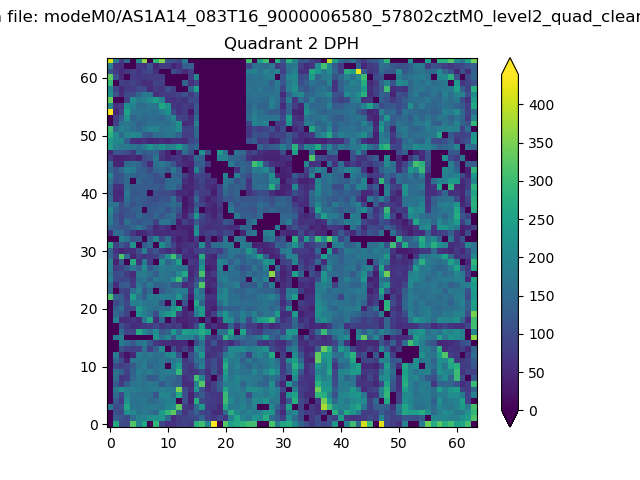
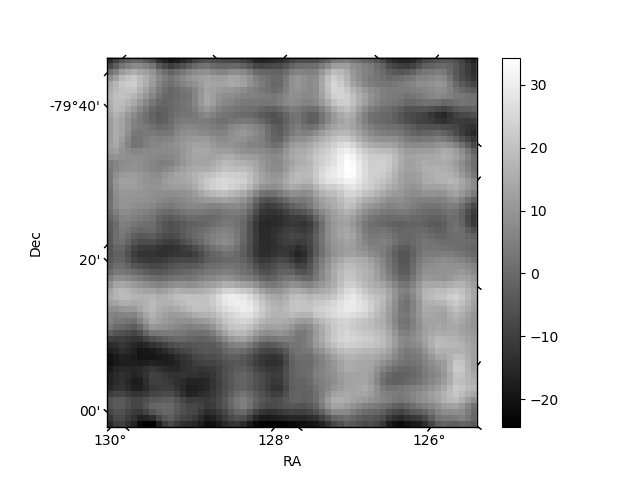
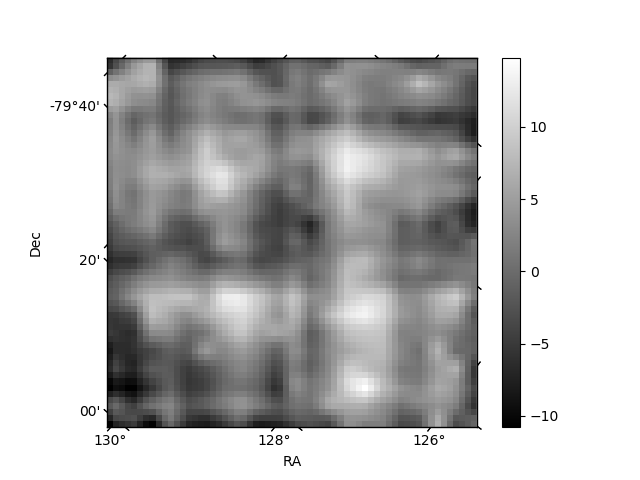
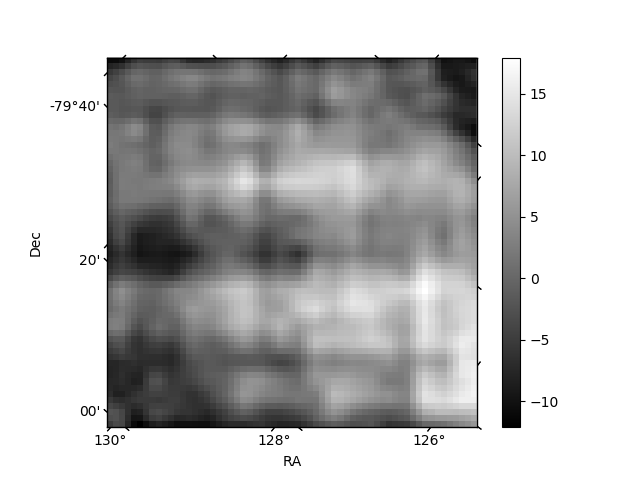
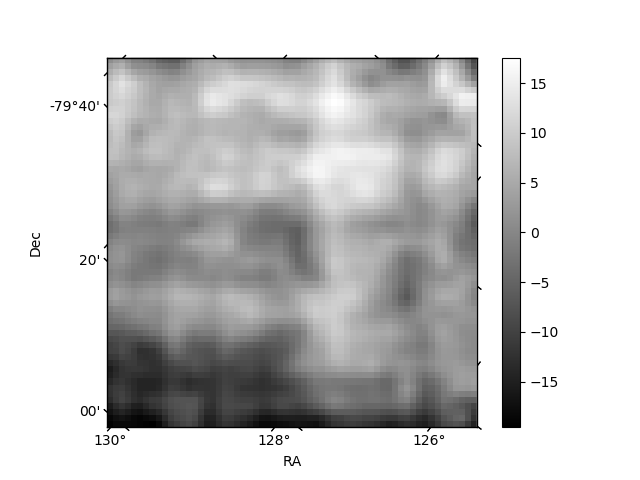
Histogram calculated using DETX and DETY for each event in the final _common_clean file
| Quadrant A | 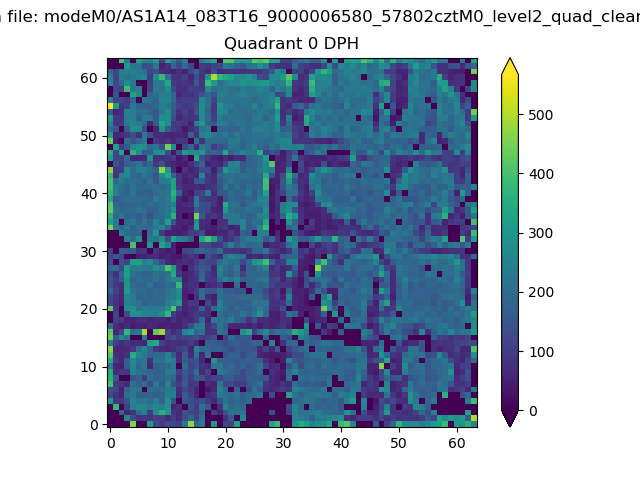 |
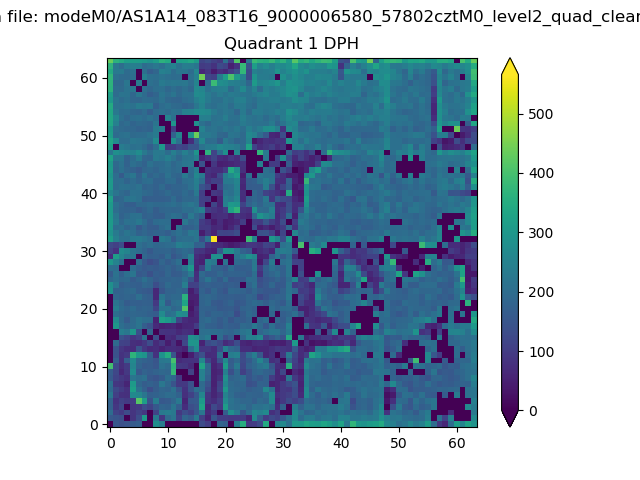 |
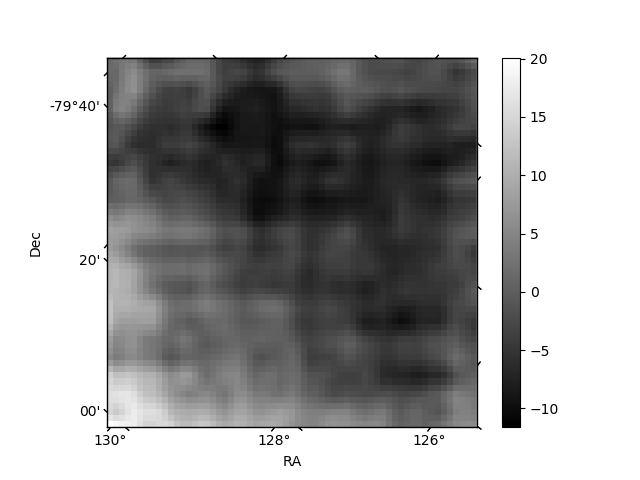
Quadrant B |
|---|---|---|---|
| Quadrant D | 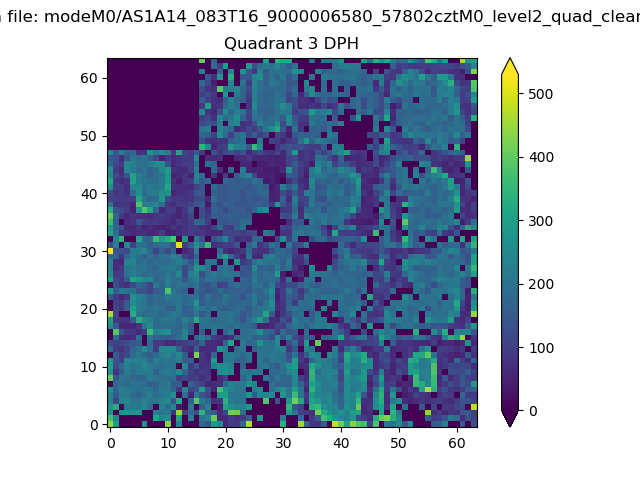 |
 |
Quadrant C |
| Plot type | Count rate plots | Images |
|---|---|---|
| Comparison with Poisson distribution Blue bars denote a histogram of data divided into 1 sec bins. Red curve is a Poisson curve with rate = median count rate of data. |
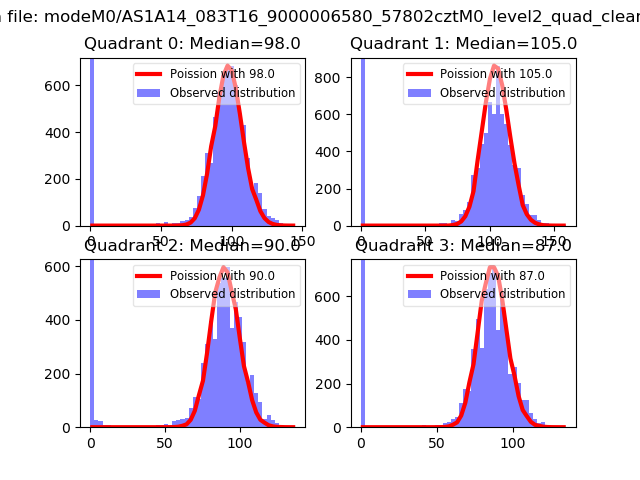 |
 |
| Quadrant-wise count rates Data is divided into 100 sec bins |
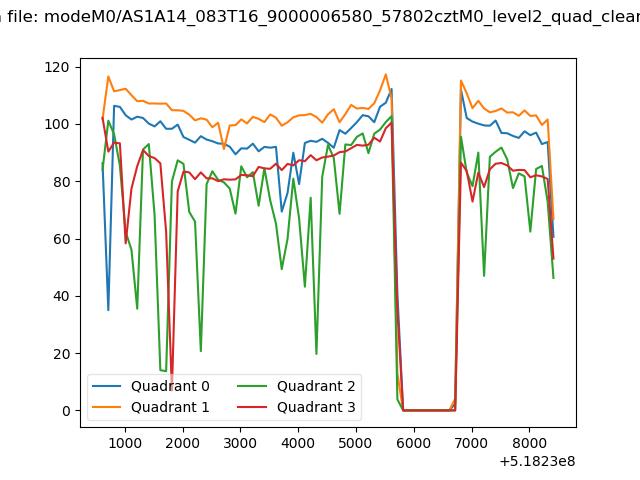 |
|
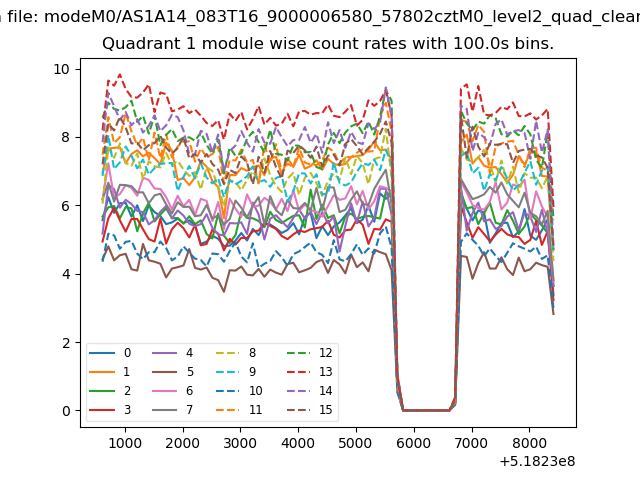
| Module-wise count rates for Quadrant A Data is divided into 100 sec bins |
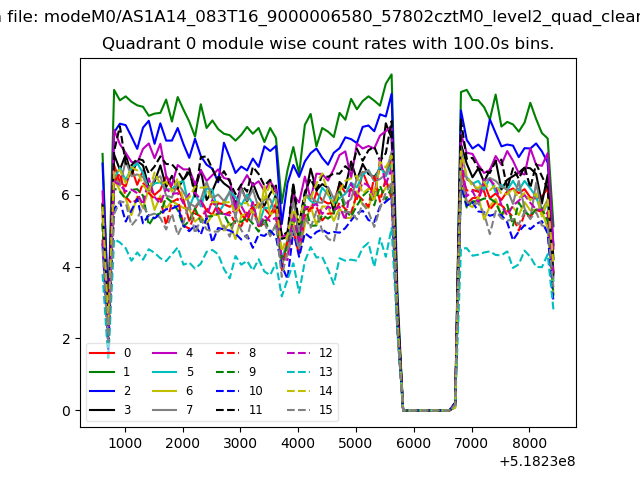 |
 |
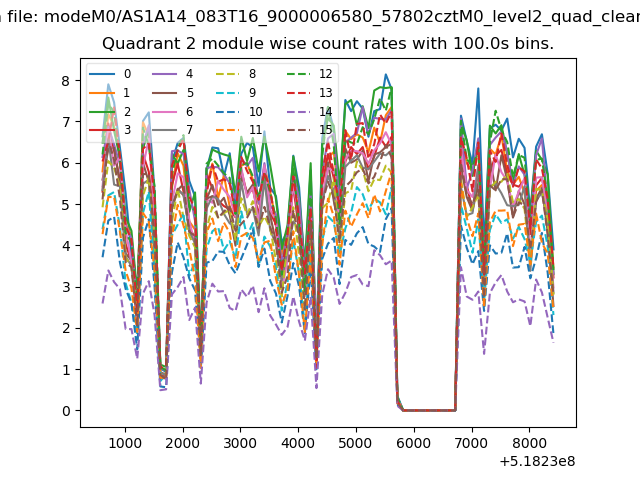
| Module-wise count rates for Quadrant B Data is divided into 100 sec bins |
 |
 |
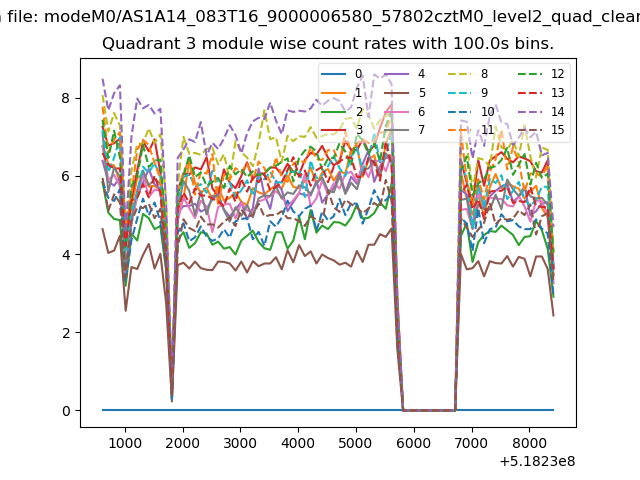
| Module-wise count rates for Quadrant C Data is divided into 100 sec bins |
 |
 |
| Module-wise count rates for Quadrant D Data is divided into 100 sec bins |
 |
 |
| Parameter | Plot |
|---|---|
| CZT HV Monitor | 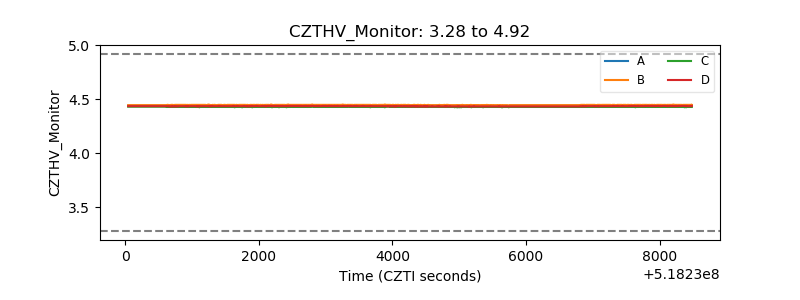 |
| D_VDD | 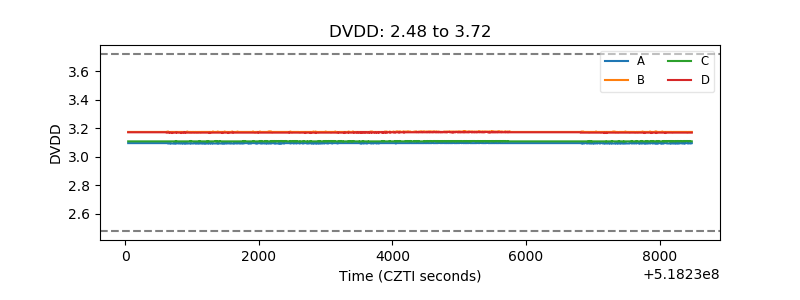 |
| Temperature 1 | 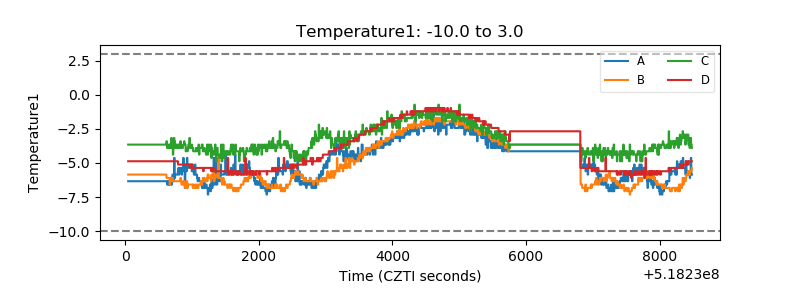 |
| Veto HV Monitor | 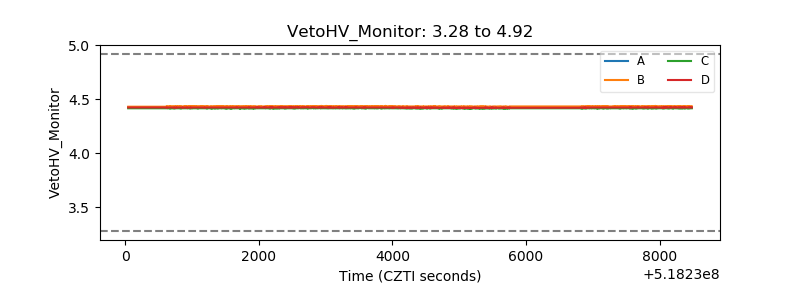 |
| Veto LLD | 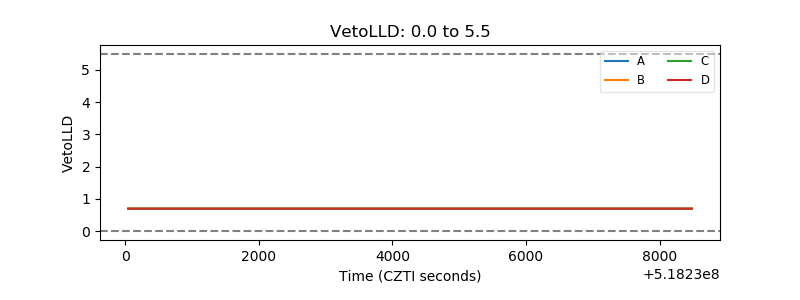 |
| Alpha Counter | 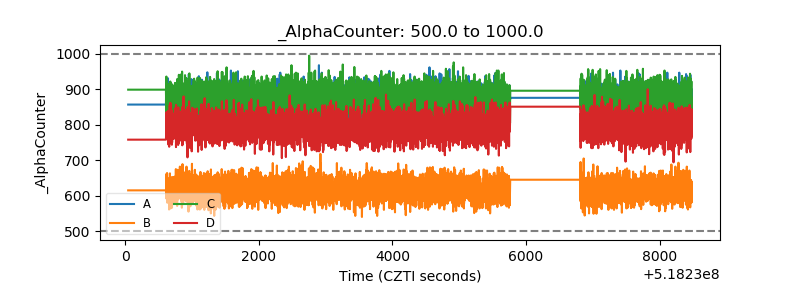 |
| _CPM_Rate | 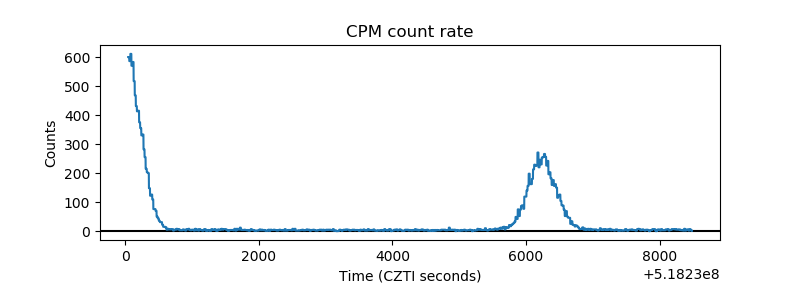 |
| CZT Counter | 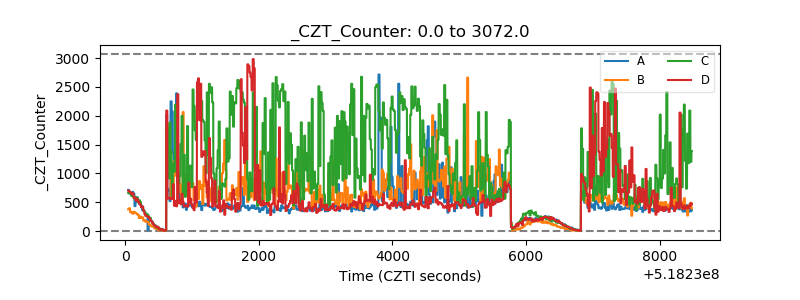 |
| +2.5 Volts monitor |  |
| +5 Volts monitor | 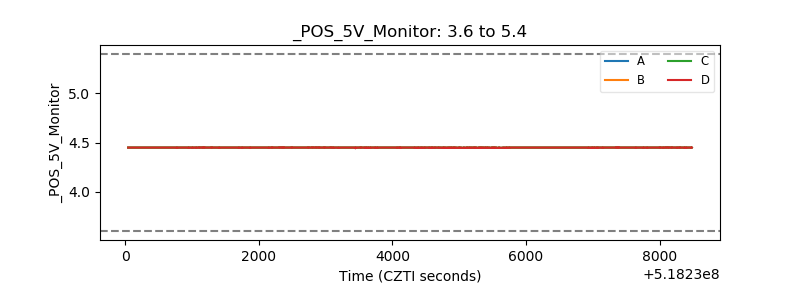 |
| _ROLL_ROT | 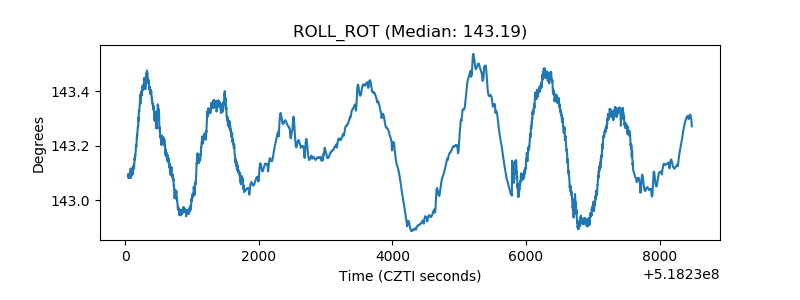 |
| _Roll_DEC | 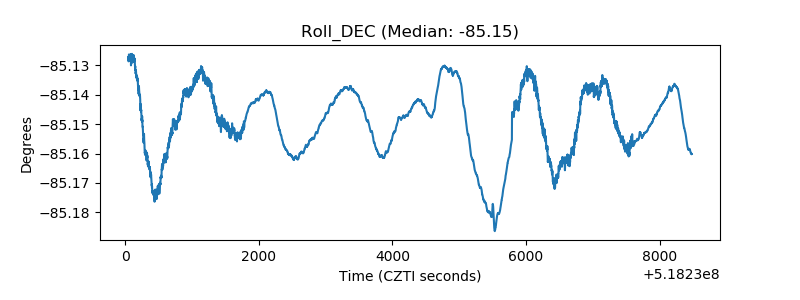 |
| _Roll_RA | 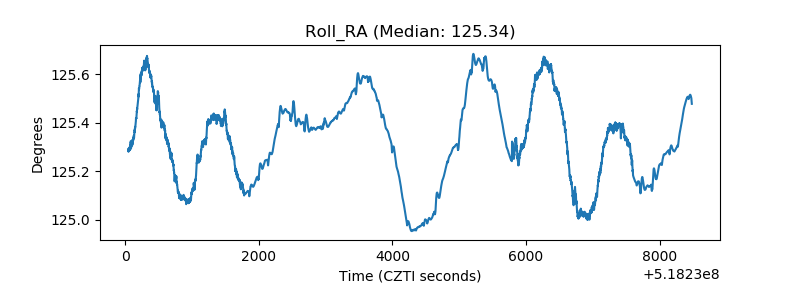 |
| Veto Counter | 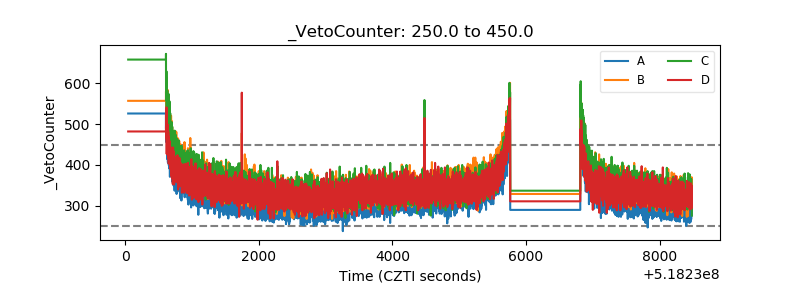 |