| Param | Original file | Final file |
|---|---|---|
| Filename | modeM0/AS1A14_083T16_9000006580_57803cztM0_level2.fits | modeM0/AS1A14_083T16_9000006580_57803cztM0_level2_quad_clean.evt |
| Size (bytes) | 532,820,160 | 99,590,400 |
| Size | 508.1 MB | 95.0 MB |
| Events in quadrant A | 3,645,250 | 665,944 |
| Events in quadrant B | 4,404,699 | 711,354 |
| Events in quadrant C | 7,213,892 | 556,828 |
| Events in quadrant D | 3,913,858 | 592,253 |
| Mode SS | |||
|---|---|---|---|
| Quadrant | BADHDUFLAG | Total packets | Discarded packets |
| A | 0 | 142 | 0 |
| B | 0 | 142 | 0 |
| C | 0 | 142 | 0 |
| D | 0 | 142 | 0 |
| Mode M0 | |||
|---|---|---|---|
| Quadrant | BADHDUFLAG | Total packets | Discarded packets |
| A | 0 | 16092 | 2 |
| B | 0 | 17847 | 2 |
| C | 0 | 26305 | 2 |
| D | 0 | 16808 | 2 |
| Mode M9 | |||
|---|---|---|---|
| Quadrant | BADHDUFLAG | Total packets | Discarded packets |
| A | 0 | 14 | 0 |
| B | 0 | 15 | 0 |
| C | 0 | 15 | 0 |
| D | 0 | 15 | 0 |
| Quadrant | Total seconds | Saturated seconds | Saturation percentage |
|---|---|---|---|
| A | 7024 | 165 | 2.349089% |
| B | 7024 | 203 | 2.890091% |
| C | 7024 | 1136 | 16.173121% |
| D | 7024 | 167 | 2.377563% |
Noise dominated data is calculated using 1-second bins in cleaned event files. If a bin has >2000 counts, and if more than 50% of those come from <1% of pixels, then it is considered to be noise-dominated and hence unusable.
| Quadrant | # 1 sec bins | Bins with >0 counts | Bins with >2000 counts | High rate bins dominated by noise | Noise dominated (total time) | Noise dominated (detector-on time) | Marked lightcurve |
|---|---|---|---|---|---|---|---|
| A | 7759 | 7024 | 56 | 56 | 0.72% | 0.80% | 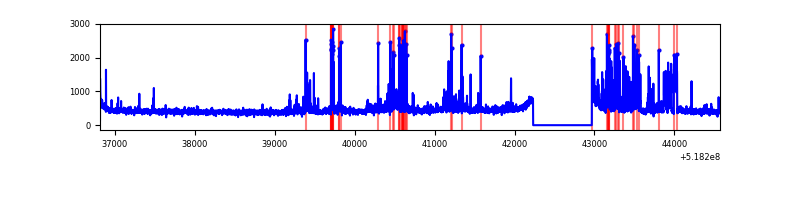 |
| B | 7759 | 7024 | 41 | 41 | 0.53% | 0.58% | 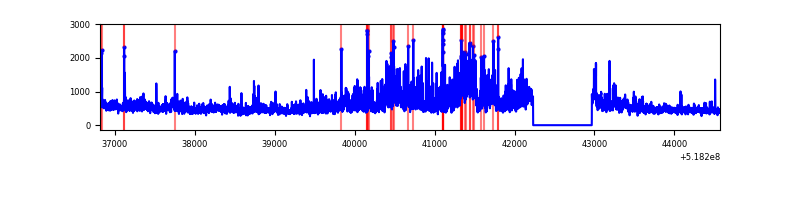 |
| C | 7758 | 7023 | 956 | 956 | 12.32% | 13.61% | 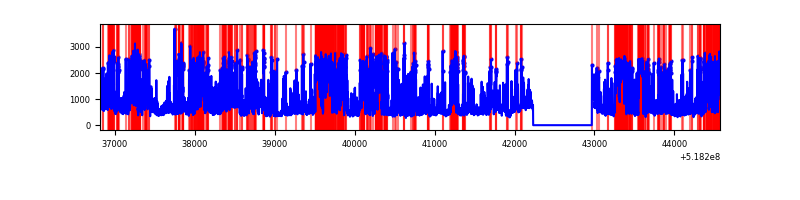 |
| D | 7759 | 7024 | 133 | 133 | 1.71% | 1.89% | 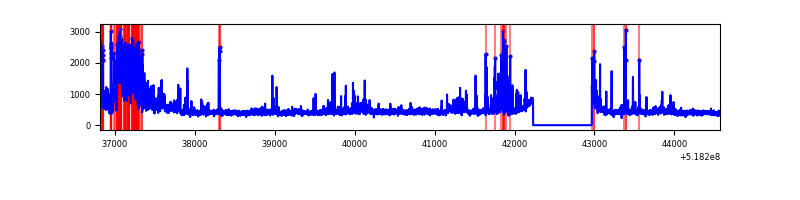 |
Top three noisy pixels from each quadrant. If the there are fewer than three noisy pixels in the level2.evt file, extra rows are filled as -1
| Pixel properties | Quadrant properties | ||||||
|---|---|---|---|---|---|---|---|
| Quadrant | DetID | PixID | Counts | Sigma | Mean | Median | Sigma |
| A | 10 | 251 | 706307 | 3838.77 | 741 | 721 | 183.8 |
| A | 3 | 14 | 41196 | 220.21 | 741 | 721 | 183.8 |
| A | 3 | 128 | 26463 | 140.05 | 741 | 721 | 183.8 |
| B | 4 | 80 | 1128780 | 7261.42 | 735 | 706 | 155.4 |
| B | 0 | 63 | 93213 | 595.47 | 735 | 706 | 155.4 |
| B | 10 | 247 | 50860 | 322.84 | 735 | 706 | 155.4 |
| C | 9 | 38 | 2715859 | 14473.64 | 689 | 680 | 187.6 |
| C | 15 | 224 | 1412538 | 7526.1 | 689 | 680 | 187.6 |
| C | 12 | 252 | 140343 | 744.49 | 689 | 680 | 187.6 |
| D | 8 | 160 | 662689 | 3253.46 | 719 | 685 | 203.5 |
| D | 8 | 240 | 88173 | 429.96 | 719 | 685 | 203.5 |
| D | 12 | 0 | 67862 | 330.14 | 719 | 685 | 203.5 |
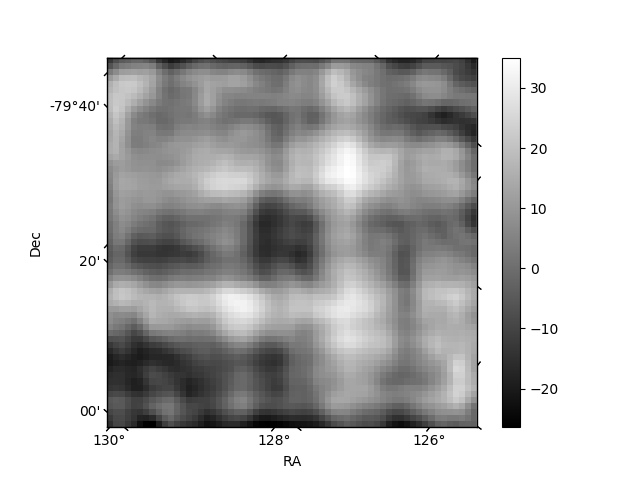
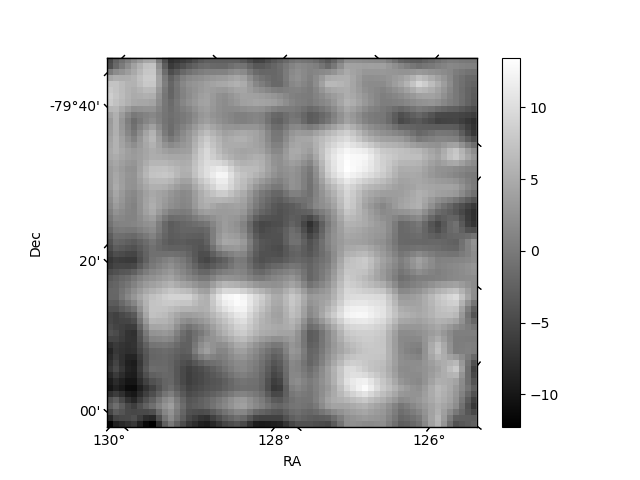
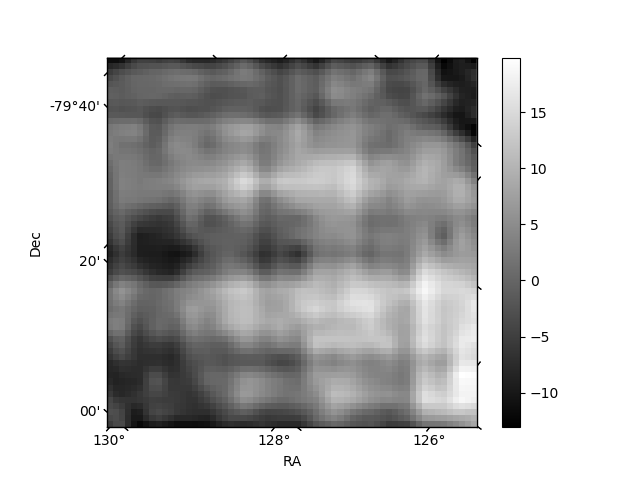
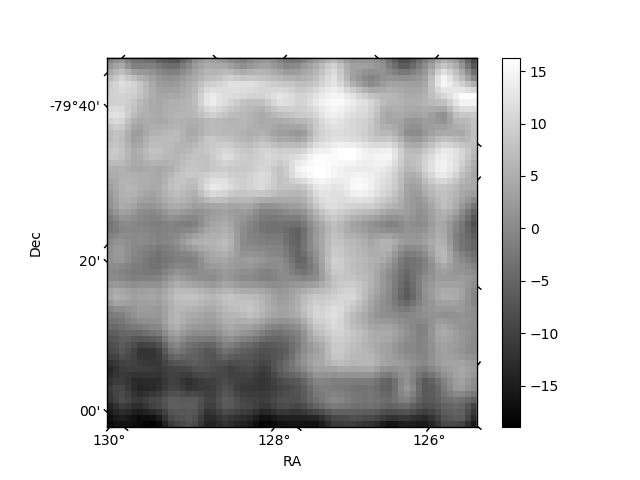
Histogram calculated using DETX and DETY for each event in the final _common_clean file
| Quadrant A | 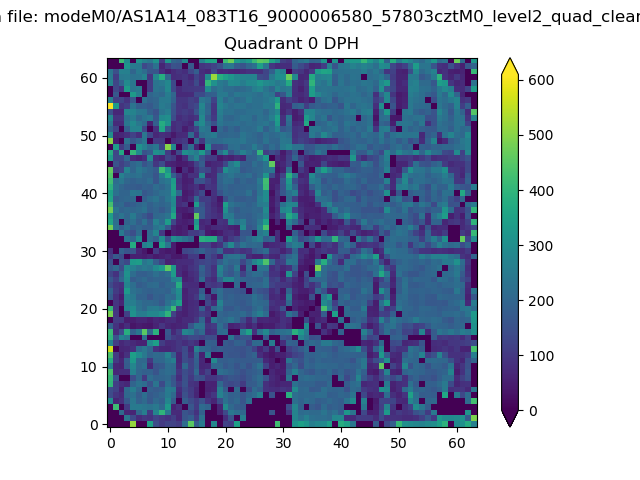 |
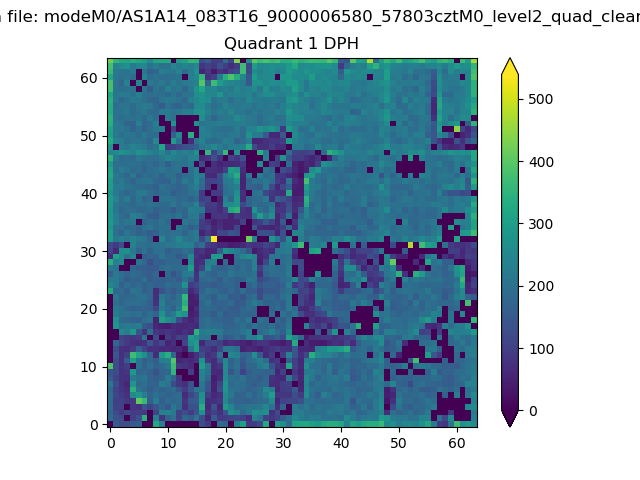 |
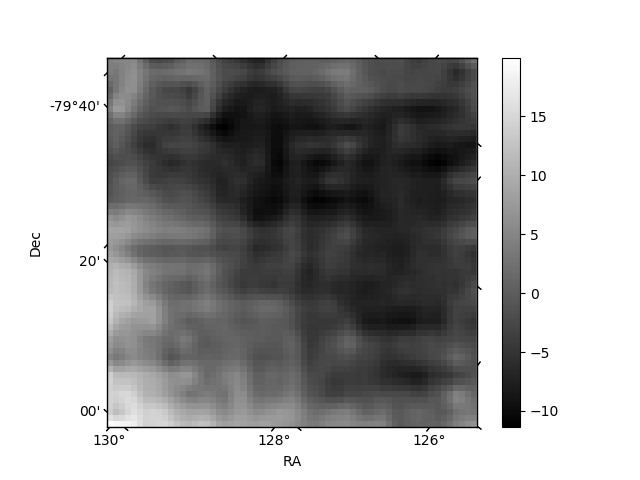
Quadrant B |
|---|---|---|---|
| Quadrant D | 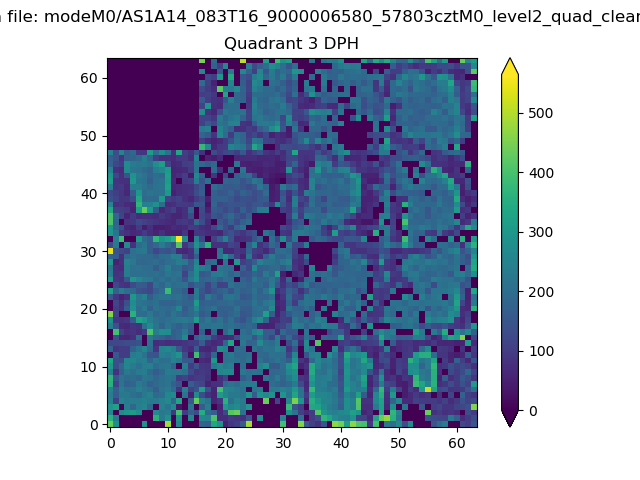 |
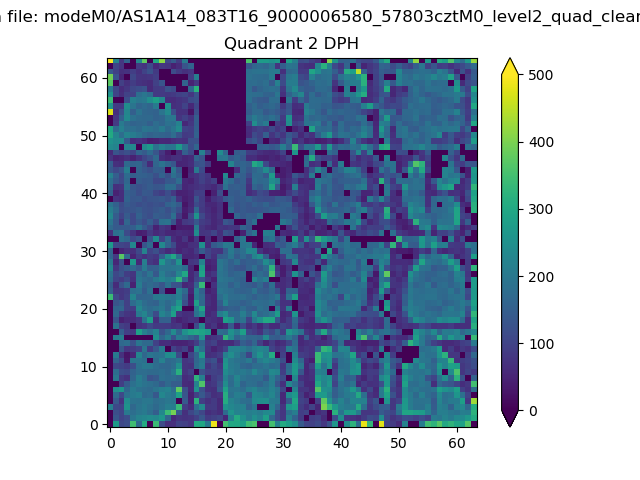 |
Quadrant C |
| Plot type | Count rate plots | Images |
|---|---|---|
| Comparison with Poisson distribution Blue bars denote a histogram of data divided into 1 sec bins. Red curve is a Poisson curve with rate = median count rate of data. |
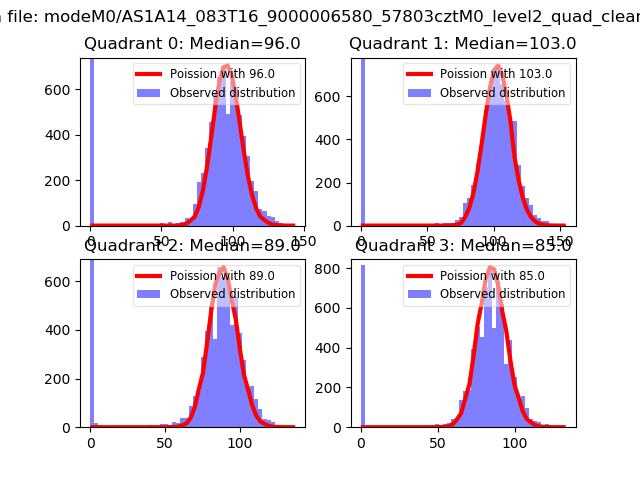 |
 |
| Quadrant-wise count rates Data is divided into 100 sec bins |
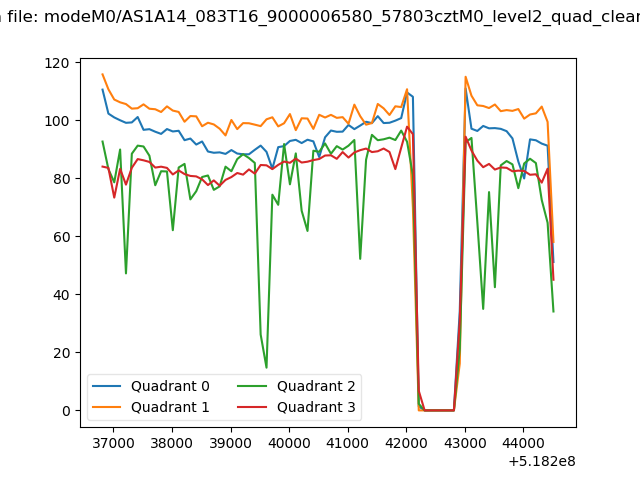 |
|
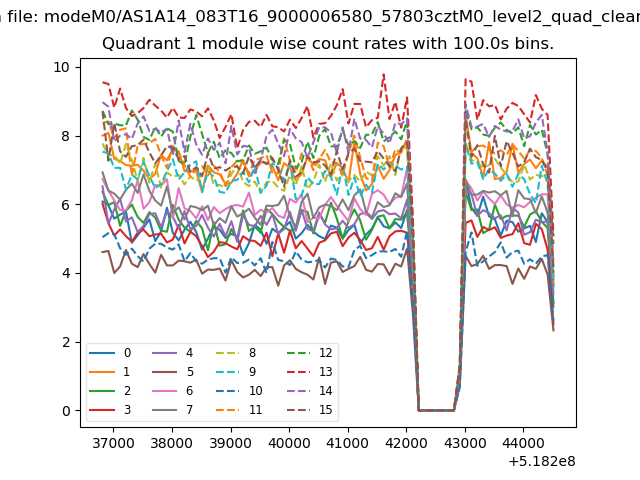
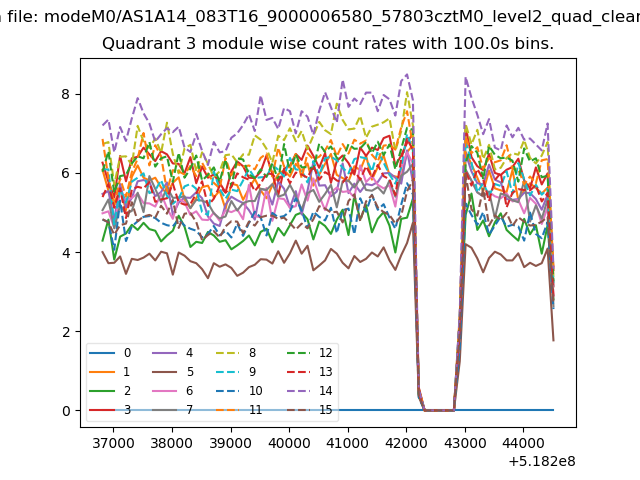
| Module-wise count rates for Quadrant A Data is divided into 100 sec bins |
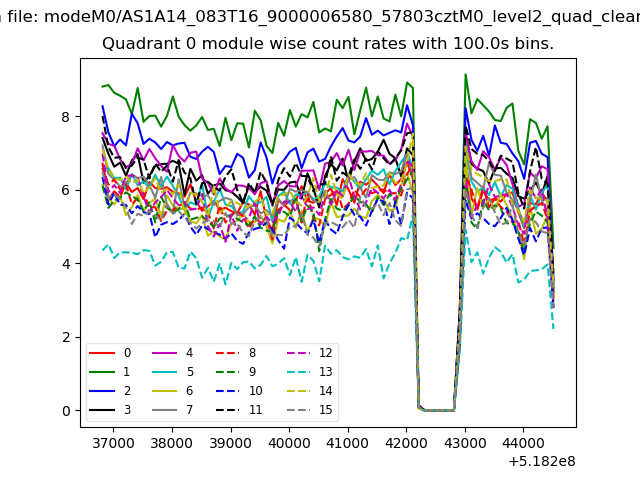 |
 |
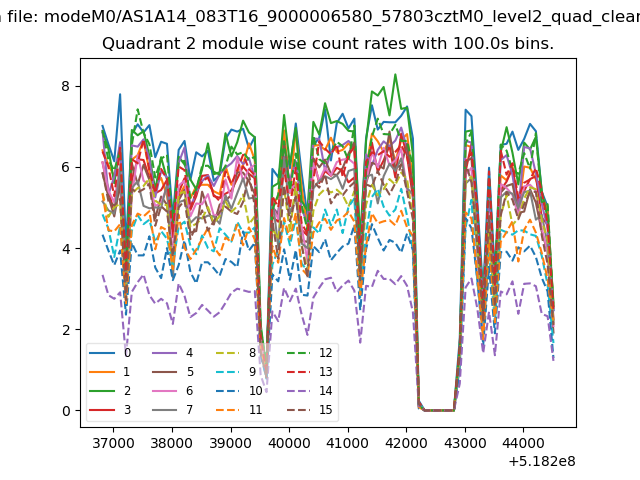
| Module-wise count rates for Quadrant B Data is divided into 100 sec bins |
 |
 |
| Module-wise count rates for Quadrant C Data is divided into 100 sec bins |
 |
 |
| Module-wise count rates for Quadrant D Data is divided into 100 sec bins |
 |
 |
| Parameter | Plot |
|---|---|
| CZT HV Monitor | 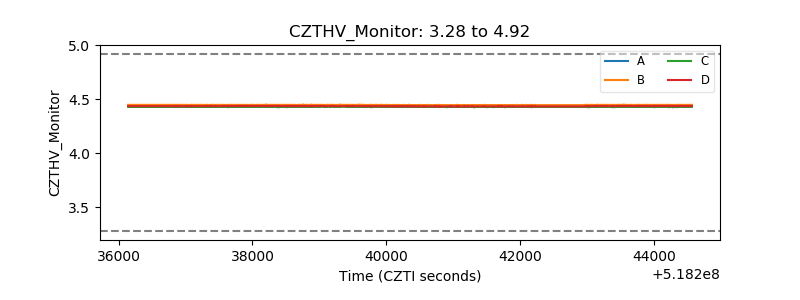 |
| D_VDD | 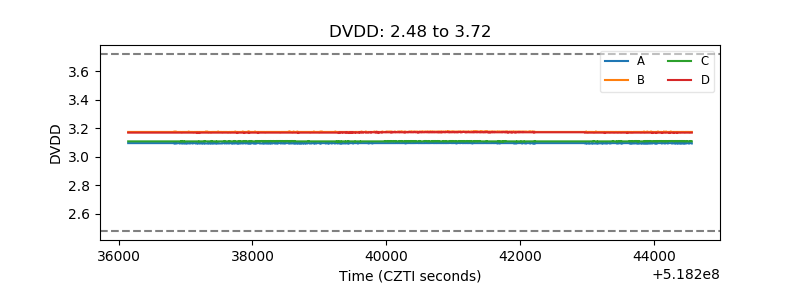 |
| Temperature 1 | 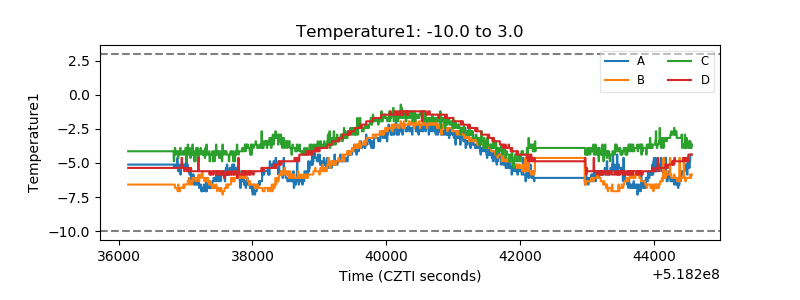 |
| Veto HV Monitor | 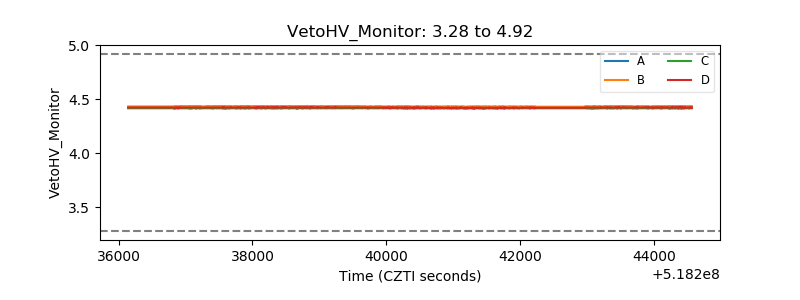 |
| Veto LLD | 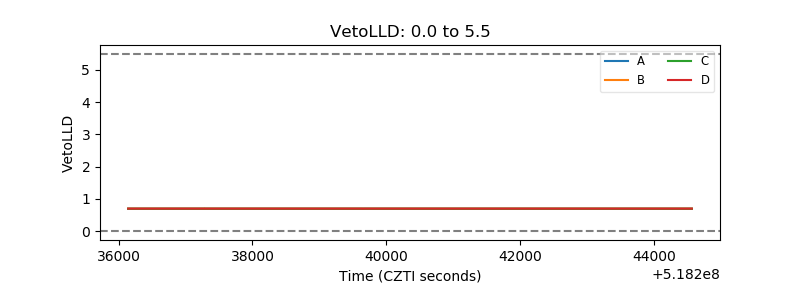 |
| Alpha Counter | 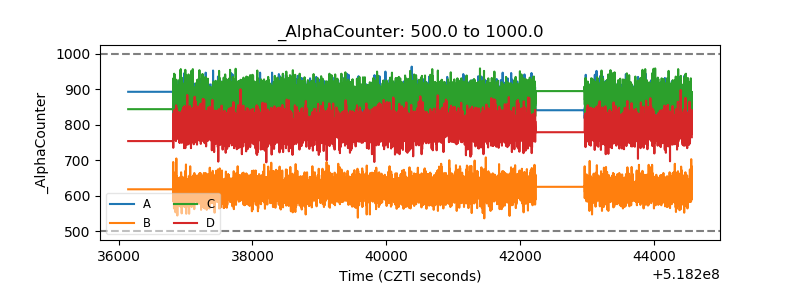 |
| _CPM_Rate | 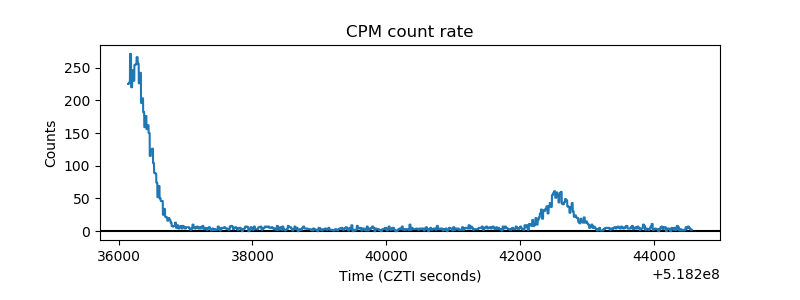 |
| CZT Counter | 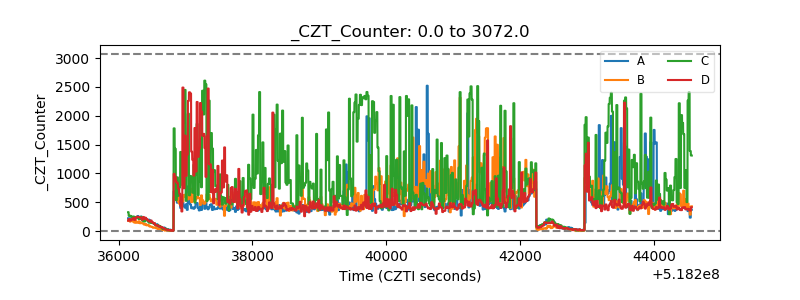 |
| +2.5 Volts monitor | 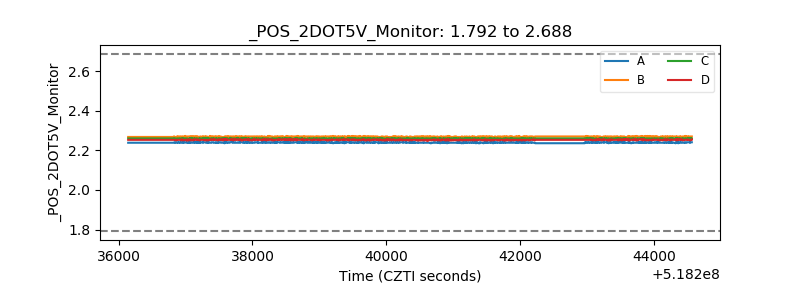 |
| +5 Volts monitor | 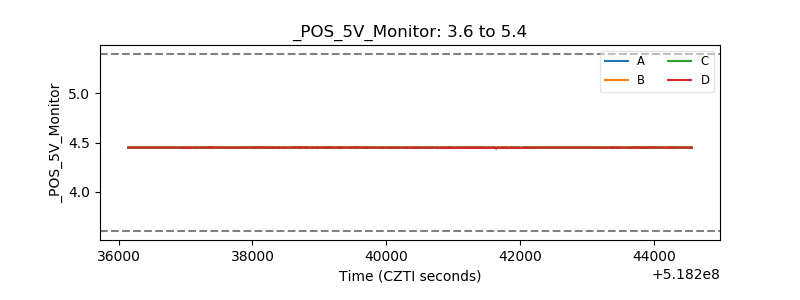 |
| _ROLL_ROT | 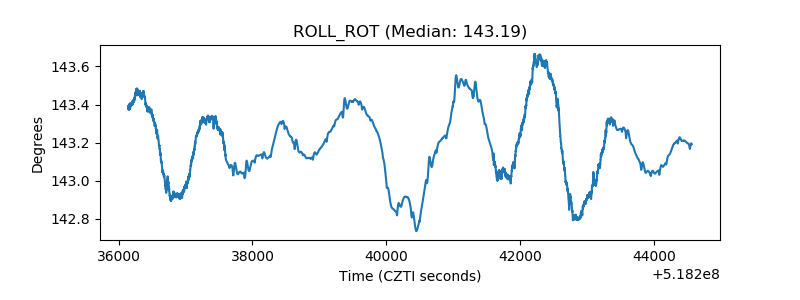 |
| _Roll_DEC | 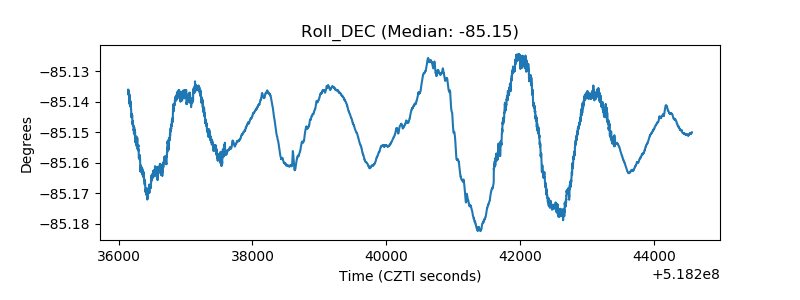 |
| _Roll_RA | 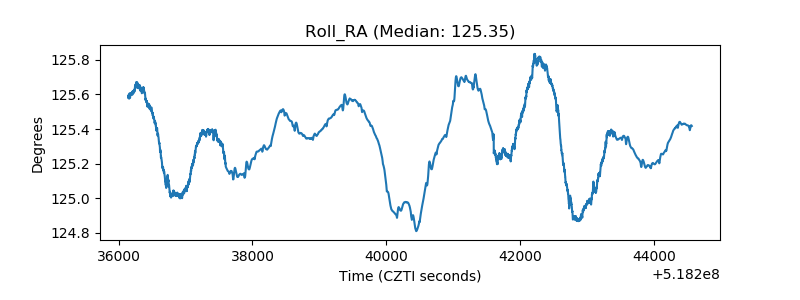 |
| Veto Counter | 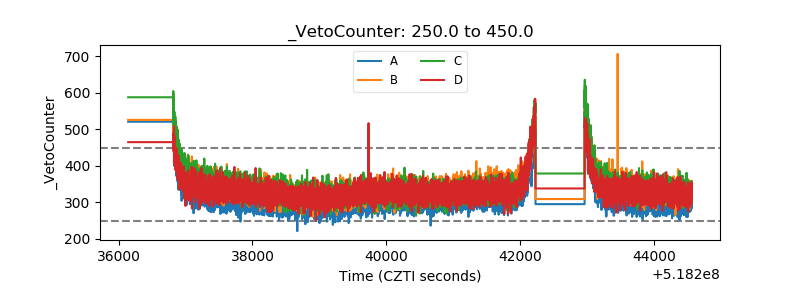 |