| Param | Original file | Final file |
|---|---|---|
| Filename | modeM0/AS1A14_083T16_9000006580_57804cztM0_level2.fits | modeM0/AS1A14_083T16_9000006580_57804cztM0_level2_quad_clean.evt |
| Size (bytes) | 652,305,600 | 103,273,920 |
| Size | 622.1 MB | 98.5 MB |
| Events in quadrant A | 3,978,711 | 719,489 |
| Events in quadrant B | 4,512,675 | 757,520 |
| Events in quadrant C | 11,133,819 | 463,341 |
| Events in quadrant D | 3,918,275 | 647,250 |
| Mode SS | |||
|---|---|---|---|
| Quadrant | BADHDUFLAG | Total packets | Discarded packets |
| A | 0 | 154 | 0 |
| B | 0 | 154 | 0 |
| C | 0 | 154 | 0 |
| D | 0 | 154 | 0 |
| Mode M0 | |||
|---|---|---|---|
| Quadrant | BADHDUFLAG | Total packets | Discarded packets |
| A | 0 | 17523 | 1 |
| B | 0 | 18865 | 1 |
| C | 0 | 38459 | 1 |
| D | 0 | 17387 | 1 |
| Quadrant | Total seconds | Saturated seconds | Saturation percentage |
|---|---|---|---|
| A | 7755 | 345 | 4.448743% |
| B | 7755 | 438 | 5.647969% |
| C | 7755 | 3059 | 39.445519% |
| D | 7755 | 246 | 3.172147% |
Noise dominated data is calculated using 1-second bins in cleaned event files. If a bin has >2000 counts, and if more than 50% of those come from <1% of pixels, then it is considered to be noise-dominated and hence unusable.
| Quadrant | # 1 sec bins | Bins with >0 counts | Bins with >2000 counts | High rate bins dominated by noise | Noise dominated (total time) | Noise dominated (detector-on time) | Marked lightcurve |
|---|---|---|---|---|---|---|---|
| A | 7755 | 7755 | 23 | 23 | 0.30% | 0.30% | 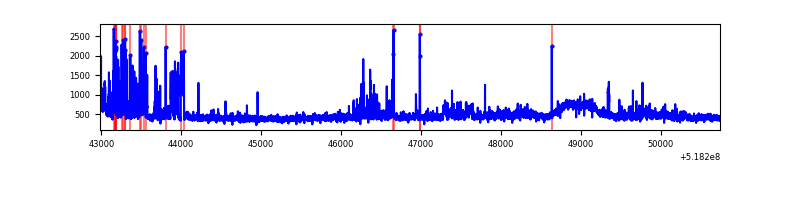 |
| B | 7755 | 7755 | 23 | 23 | 0.30% | 0.30% | 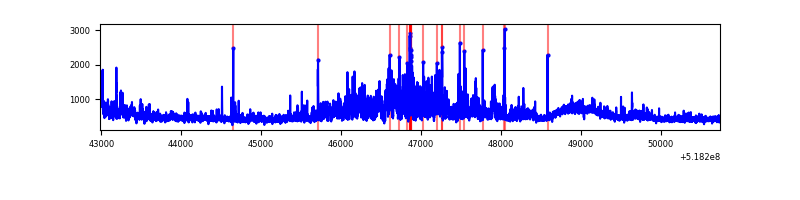 |
| C | 7754 | 7754 | 2370 | 2370 | 30.56% | 30.56% | 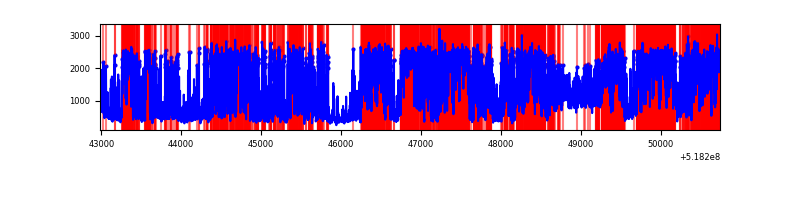 |
| D | 7755 | 7755 | 56 | 56 | 0.72% | 0.72% | 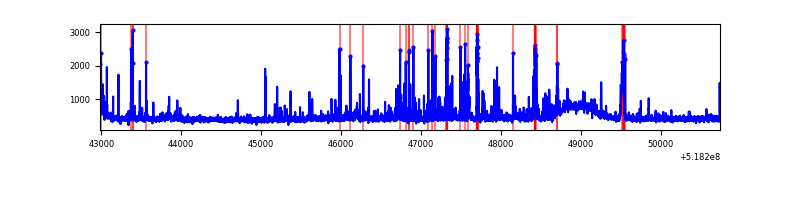 |
Top three noisy pixels from each quadrant. If the there are fewer than three noisy pixels in the level2.evt file, extra rows are filled as -1
| Pixel properties | Quadrant properties | ||||||
|---|---|---|---|---|---|---|---|
| Quadrant | DetID | PixID | Counts | Sigma | Mean | Median | Sigma |
| A | 10 | 251 | 466202 | 2258.68 | 845 | 824 | 206.0 |
| A | 3 | 14 | 194090 | 938.0 | 845 | 824 | 206.0 |
| A | 3 | 128 | 37961 | 180.24 | 845 | 824 | 206.0 |
| B | 4 | 80 | 925705 | 5216.16 | 835 | 800 | 177.3 |
| B | 10 | 247 | 52079 | 289.2 | 835 | 800 | 177.3 |
| B | 9 | 251 | 36309 | 200.26 | 835 | 800 | 177.3 |
| C | 9 | 38 | 6943716 | 35787.94 | 715 | 706 | 194.0 |
| C | 15 | 224 | 940371 | 4843.53 | 715 | 706 | 194.0 |
| C | 12 | 252 | 250752 | 1288.87 | 715 | 706 | 194.0 |
| D | 8 | 240 | 348827 | 1510.29 | 827 | 789 | 230.4 |
| D | 5 | 173 | 62008 | 265.65 | 827 | 789 | 230.4 |
| D | 3 | 12 | 54621 | 233.6 | 827 | 789 | 230.4 |
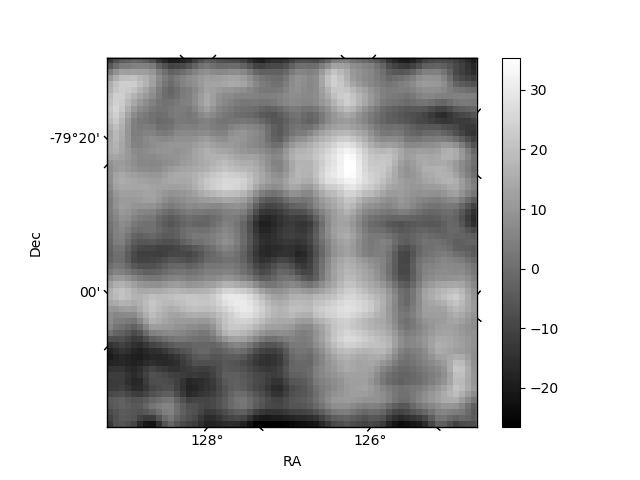
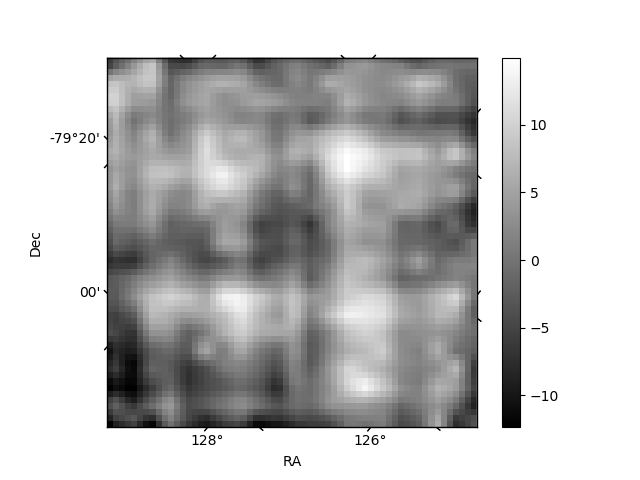
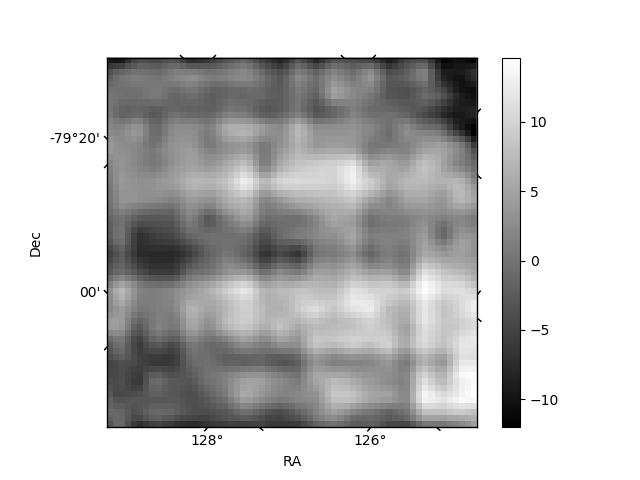
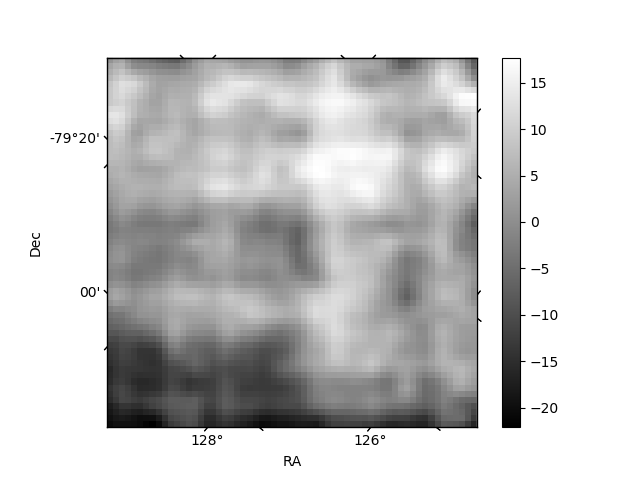
Histogram calculated using DETX and DETY for each event in the final _common_clean file
| Quadrant A | 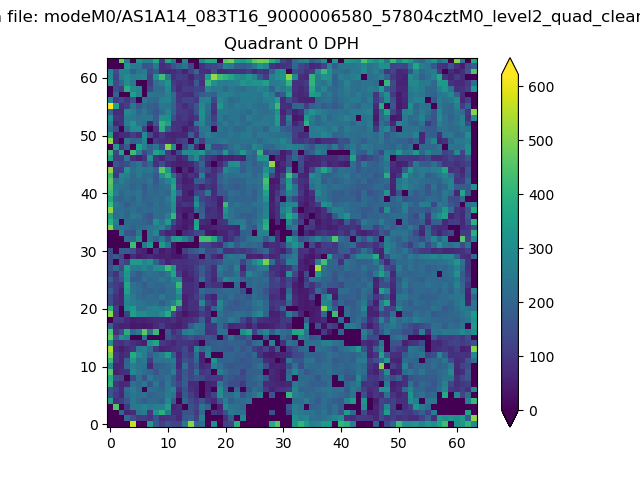 |
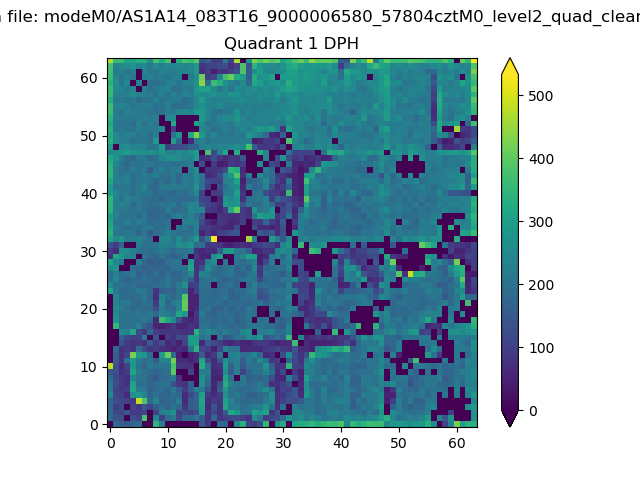 |
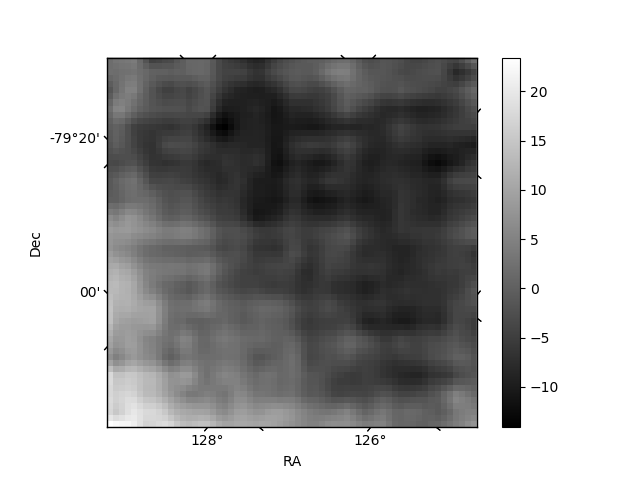
Quadrant B |
|---|---|---|---|
| Quadrant D | 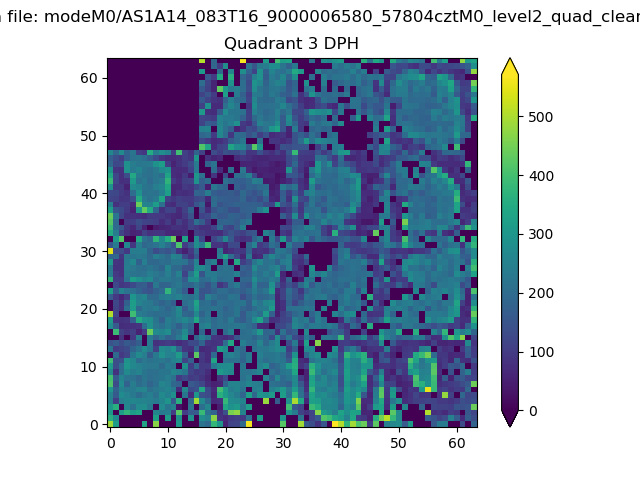 |
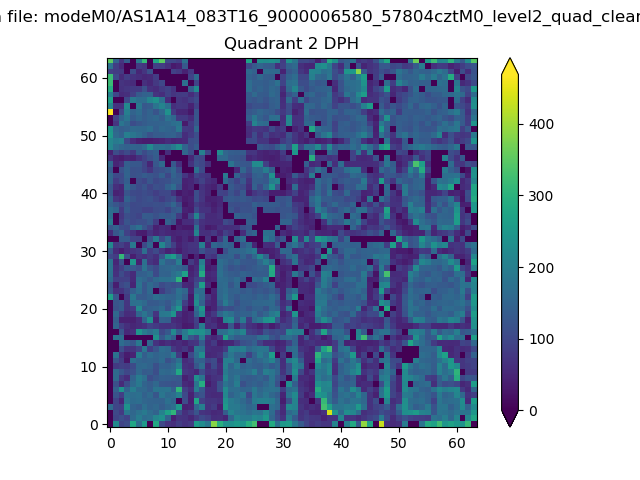 |
Quadrant C |
| Plot type | Count rate plots | Images |
|---|---|---|
| Comparison with Poisson distribution Blue bars denote a histogram of data divided into 1 sec bins. Red curve is a Poisson curve with rate = median count rate of data. |
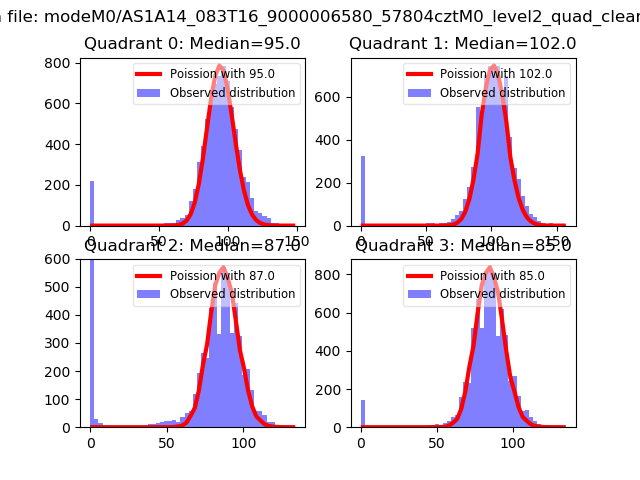 |
 |
| Quadrant-wise count rates Data is divided into 100 sec bins |
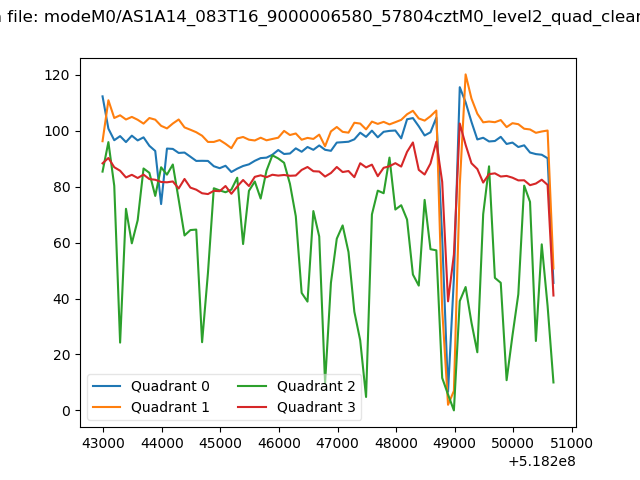 |
|
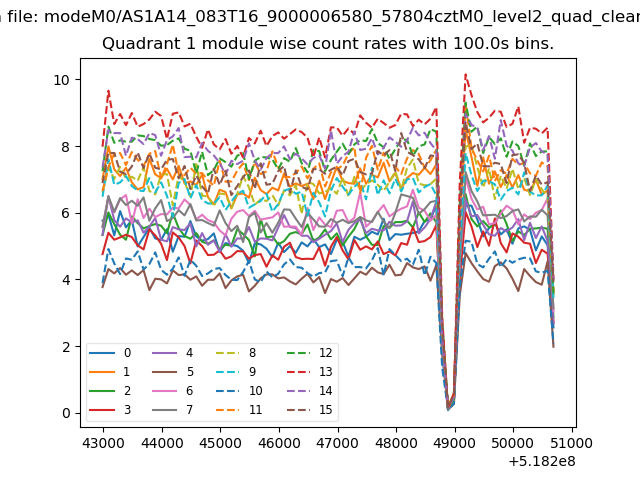
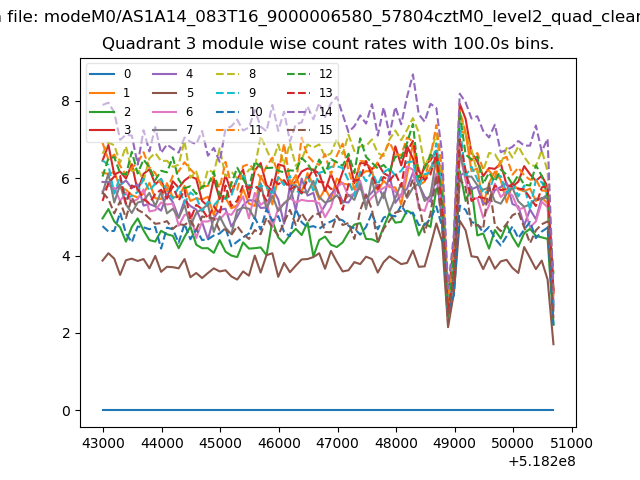
| Module-wise count rates for Quadrant A Data is divided into 100 sec bins |
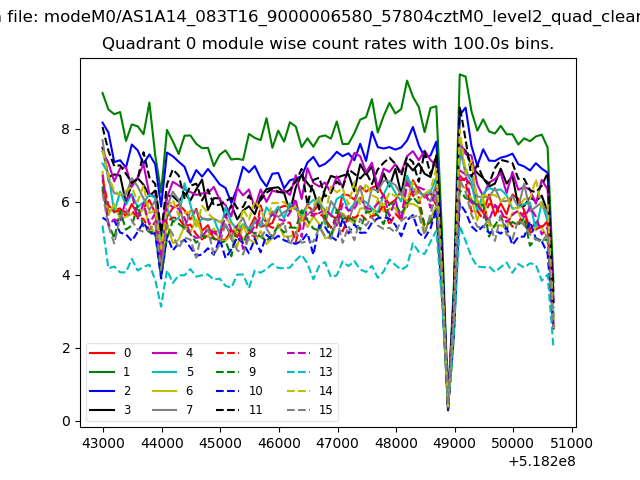 |
 |
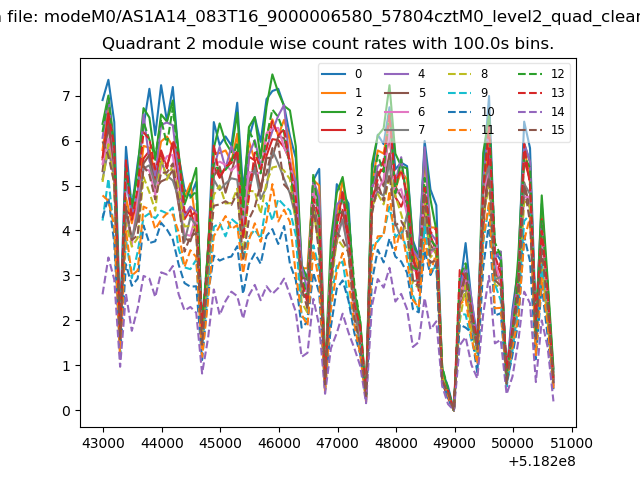
| Module-wise count rates for Quadrant B Data is divided into 100 sec bins |
 |
 |
| Module-wise count rates for Quadrant C Data is divided into 100 sec bins |
 |
 |
| Module-wise count rates for Quadrant D Data is divided into 100 sec bins |
 |
 |
| Parameter | Plot |
|---|---|
| CZT HV Monitor | 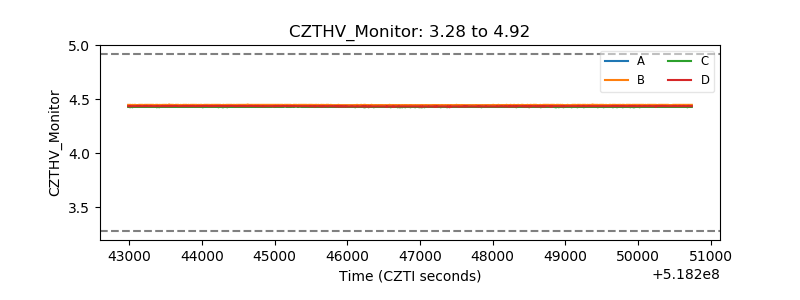 |
| D_VDD | 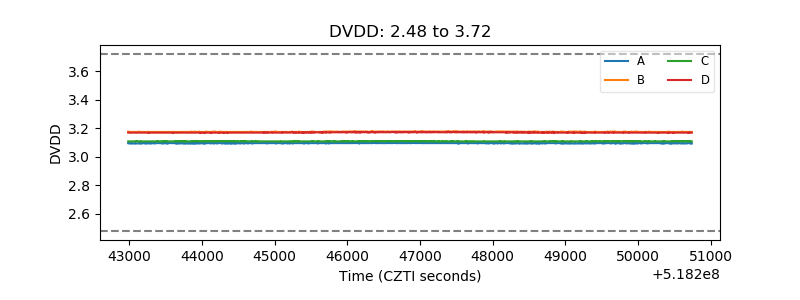 |
| Temperature 1 | 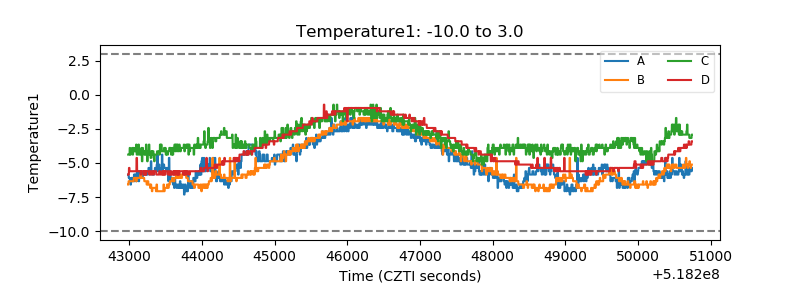 |
| Veto HV Monitor | 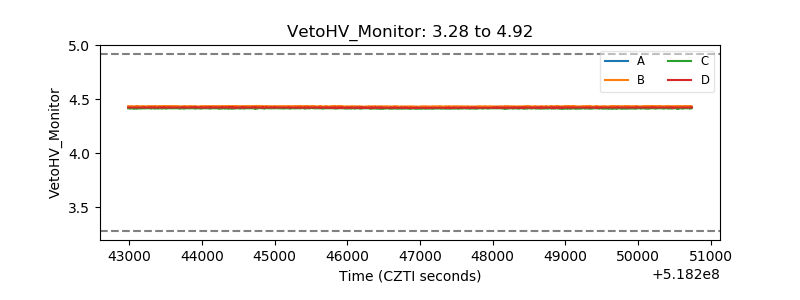 |
| Veto LLD | 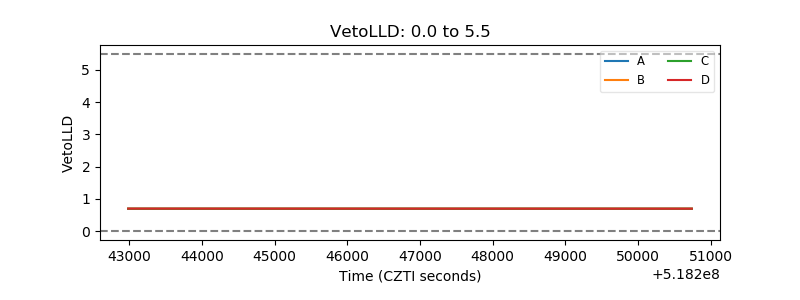 |
| Alpha Counter | 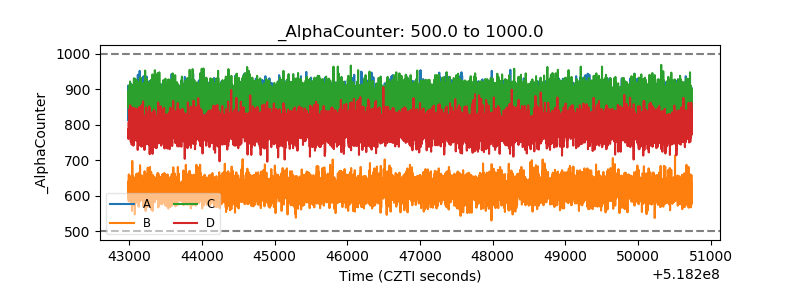 |
| _CPM_Rate | 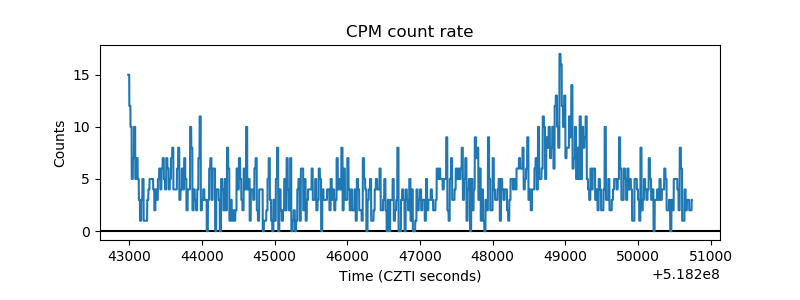 |
| CZT Counter | 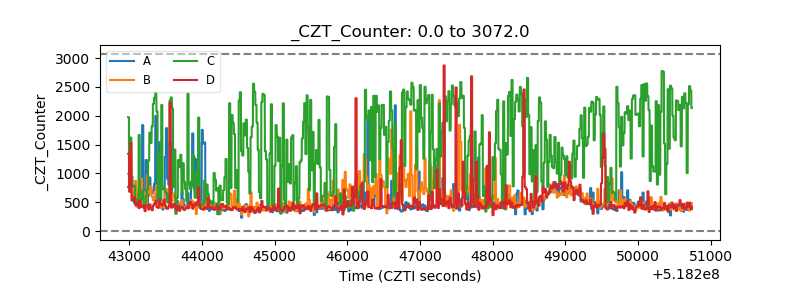 |
| +2.5 Volts monitor | 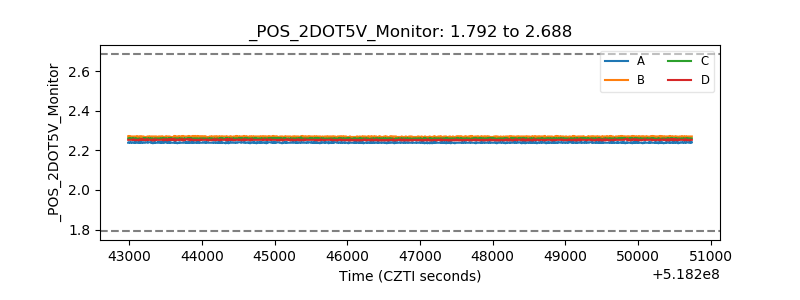 |
| +5 Volts monitor |  |
| _ROLL_ROT | 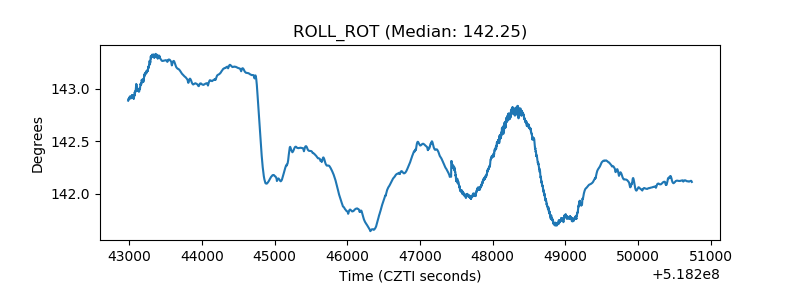 |
| _Roll_DEC | 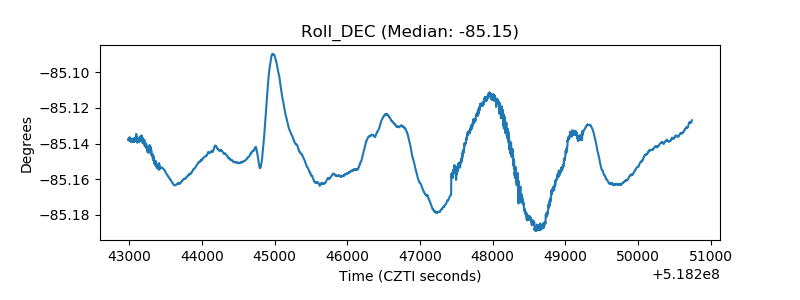 |
| _Roll_RA | 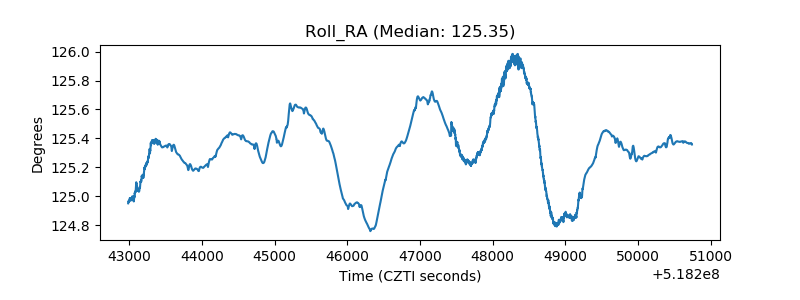 |
| Veto Counter | 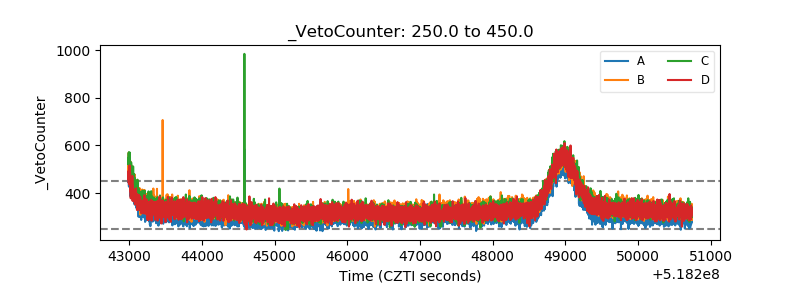 |