| Param | Original file | Final file |
|---|---|---|
| Filename | modeM0/AS1A14_083T16_9000006580_57805cztM0_level2.fits | modeM0/AS1A14_083T16_9000006580_57805cztM0_level2_quad_clean.evt |
| Size (bytes) | 589,458,240 | 96,416,640 |
| Size | 562.2 MB | 92.0 MB |
| Events in quadrant A | 3,239,911 | 669,524 |
| Events in quadrant B | 3,233,655 | 720,736 |
| Events in quadrant C | 11,013,549 | 434,686 |
| Events in quadrant D | 3,778,025 | 597,385 |
| Mode SS | |||
|---|---|---|---|
| Quadrant | BADHDUFLAG | Total packets | Discarded packets |
| A | 0 | 142 | 0 |
| B | 0 | 142 | 0 |
| C | 0 | 142 | 0 |
| D | 0 | 142 | 0 |
| Mode M0 | |||
|---|---|---|---|
| Quadrant | BADHDUFLAG | Total packets | Discarded packets |
| A | 0 | 14714 | 0 |
| B | 0 | 14921 | 0 |
| C | 0 | 37681 | 0 |
| D | 0 | 16383 | 0 |
| Quadrant | Total seconds | Saturated seconds | Saturation percentage |
|---|---|---|---|
| A | 7138 | 8 | 0.112076% |
| B | 7139 | 47 | 0.658356% |
| C | 7139 | 2734 | 38.296680% |
| D | 7139 | 92 | 1.288696% |
Noise dominated data is calculated using 1-second bins in cleaned event files. If a bin has >2000 counts, and if more than 50% of those come from <1% of pixels, then it is considered to be noise-dominated and hence unusable.
| Quadrant | # 1 sec bins | Bins with >0 counts | Bins with >2000 counts | High rate bins dominated by noise | Noise dominated (total time) | Noise dominated (detector-on time) | Marked lightcurve |
|---|---|---|---|---|---|---|---|
| A | 7138 | 7138 | 4 | 4 | 0.06% | 0.06% | 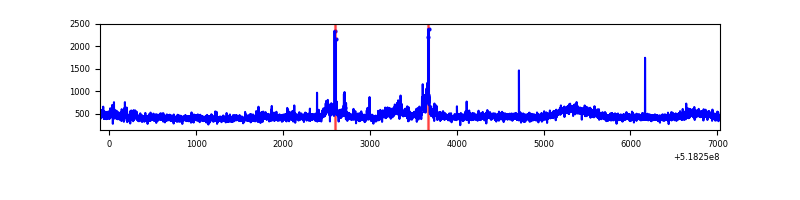 |
| B | 7139 | 7139 | 21 | 21 | 0.29% | 0.29% | 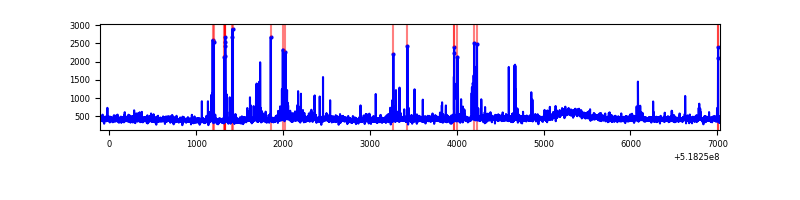 |
| C | 7139 | 7139 | 2454 | 2454 | 34.37% | 34.37% | 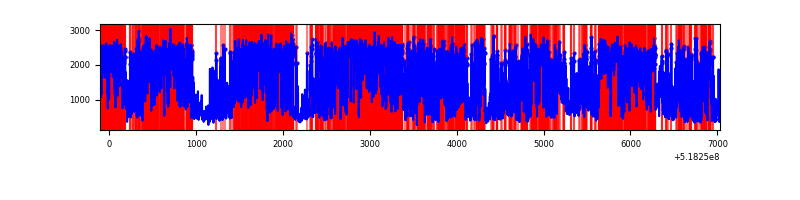 |
| D | 7139 | 7139 | 98 | 98 | 1.37% | 1.37% | 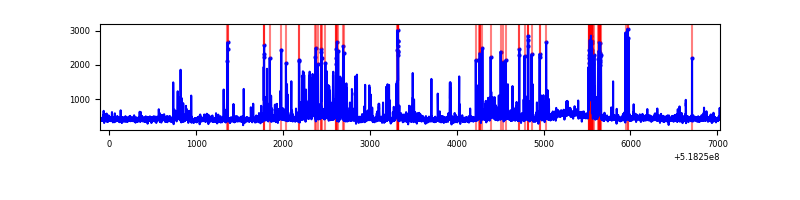 |
Top three noisy pixels from each quadrant. If the there are fewer than three noisy pixels in the level2.evt file, extra rows are filled as -1
| Pixel properties | Quadrant properties | ||||||
|---|---|---|---|---|---|---|---|
| Quadrant | DetID | PixID | Counts | Sigma | Mean | Median | Sigma |
| A | 3 | 14 | 238110 | 1260.99 | 753 | 732 | 188.2 |
| A | 3 | 128 | 69547 | 365.56 | 753 | 732 | 188.2 |
| A | 3 | 245 | 12020 | 59.96 | 753 | 732 | 188.2 |
| B | 7 | 252 | 75583 | 466.38 | 747 | 719 | 160.5 |
| B | 4 | 142 | 33660 | 205.21 | 747 | 719 | 160.5 |
| B | 5 | 185 | 25975 | 157.34 | 747 | 719 | 160.5 |
| C | 9 | 38 | 6775055 | 38874.71 | 640 | 631 | 174.3 |
| C | 15 | 224 | 1588139 | 9109.84 | 640 | 631 | 174.3 |
| C | 14 | 254 | 55996 | 317.71 | 640 | 631 | 174.3 |
| D | 12 | 251 | 269321 | 1293.84 | 731 | 697 | 207.6 |
| D | 8 | 240 | 158977 | 762.36 | 731 | 697 | 207.6 |
| D | 12 | 0 | 131656 | 630.77 | 731 | 697 | 207.6 |
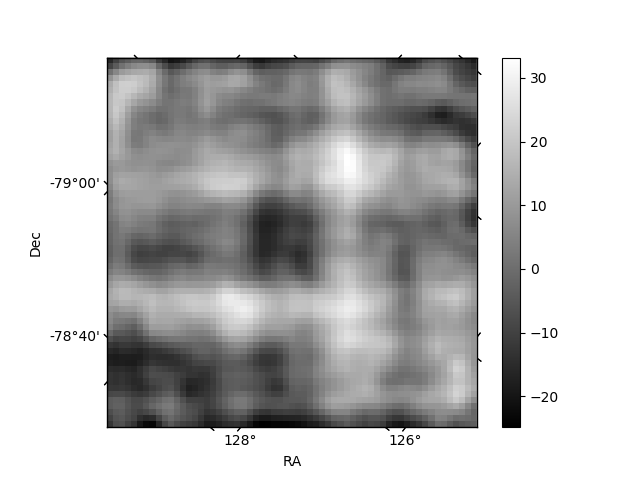
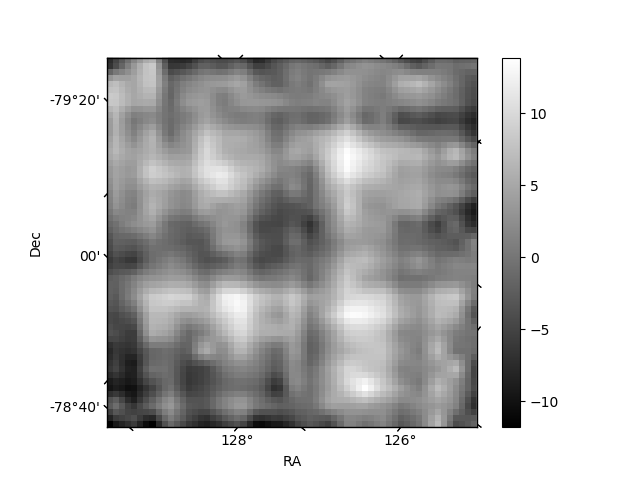
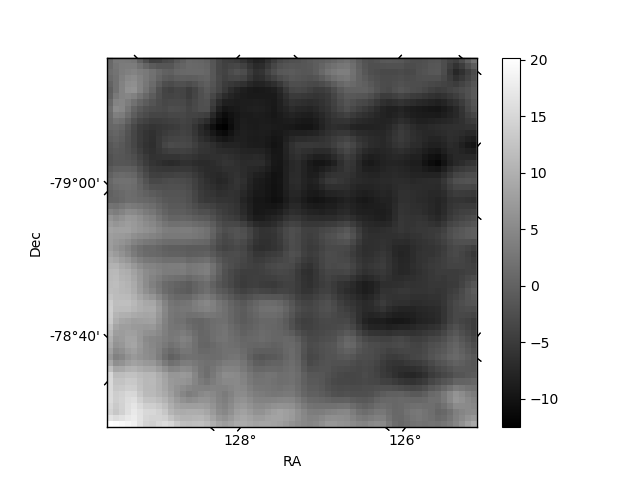
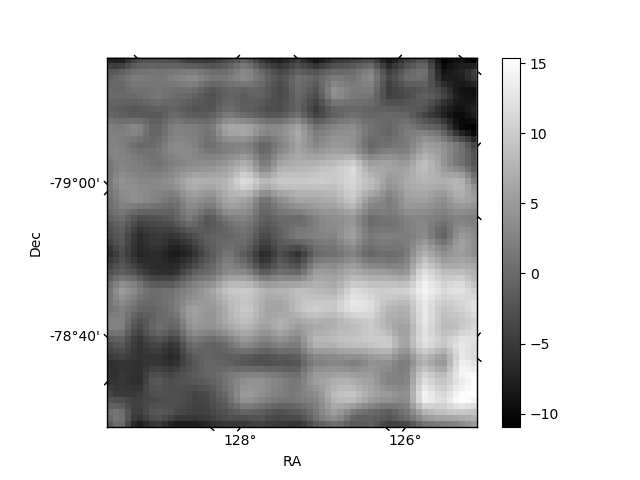
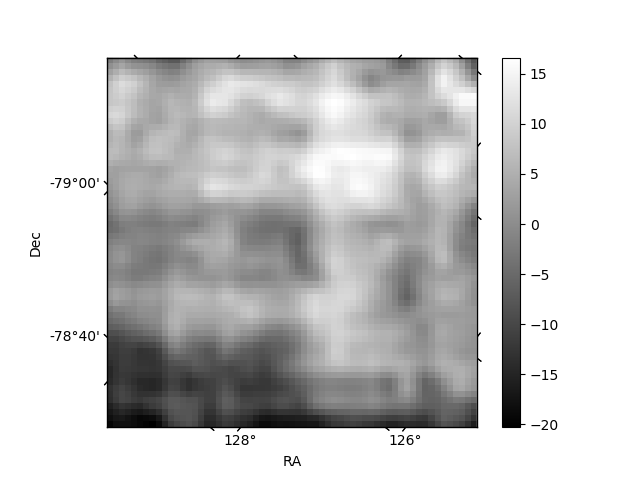
Histogram calculated using DETX and DETY for each event in the final _common_clean file
| Quadrant A | 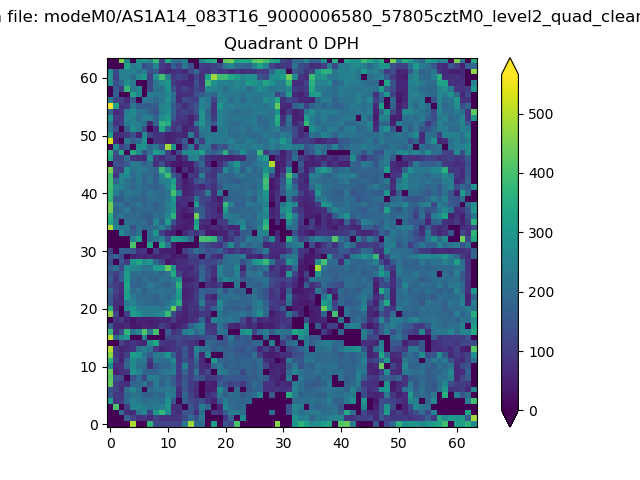 |
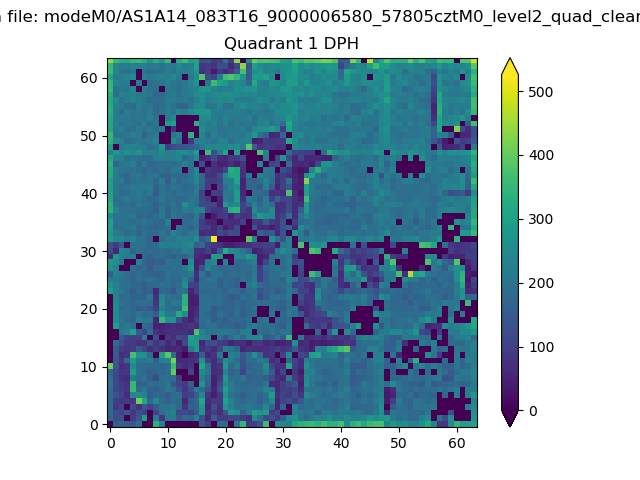 |
Quadrant B |
|---|---|---|---|
| Quadrant D | 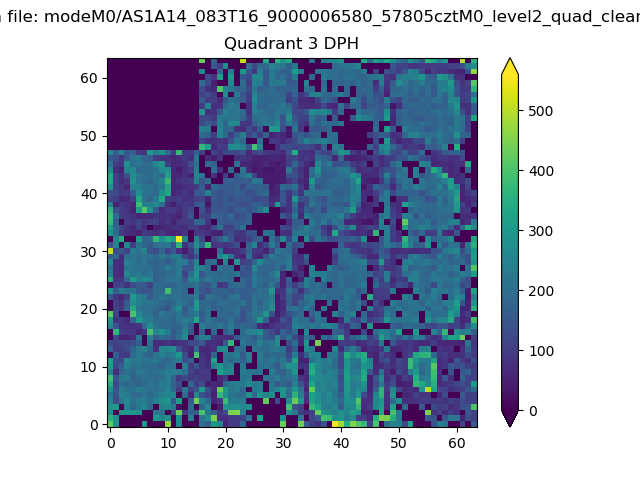 |
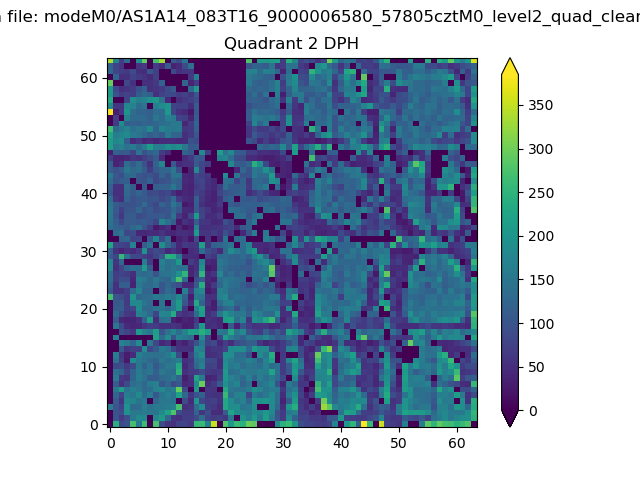 |
Quadrant C |
| Plot type | Count rate plots | Images |
|---|---|---|
| Comparison with Poisson distribution Blue bars denote a histogram of data divided into 1 sec bins. Red curve is a Poisson curve with rate = median count rate of data. |
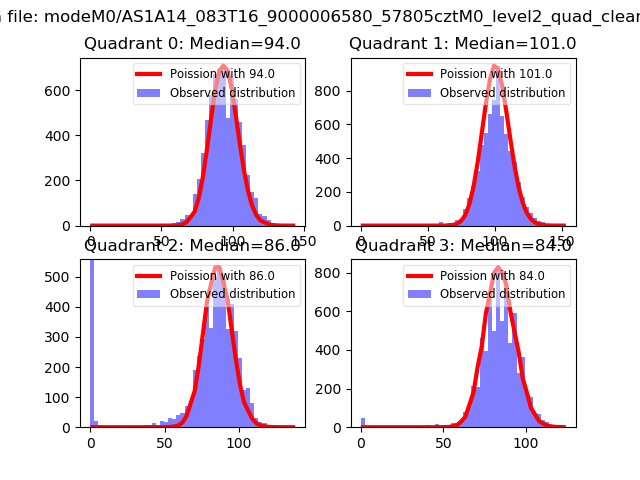 |
 |
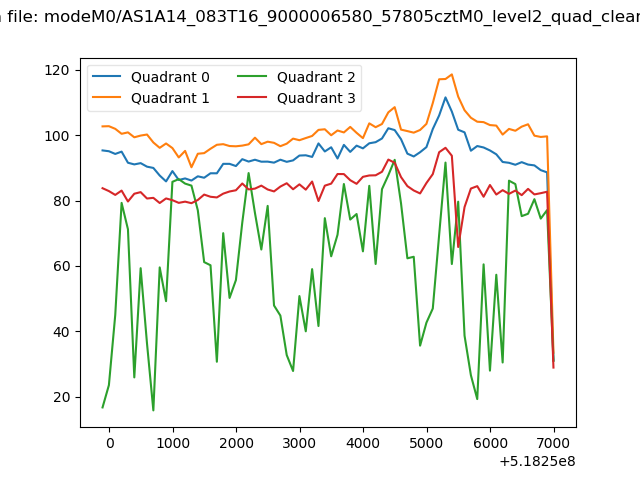
| Quadrant-wise count rates Data is divided into 100 sec bins |
 |
|
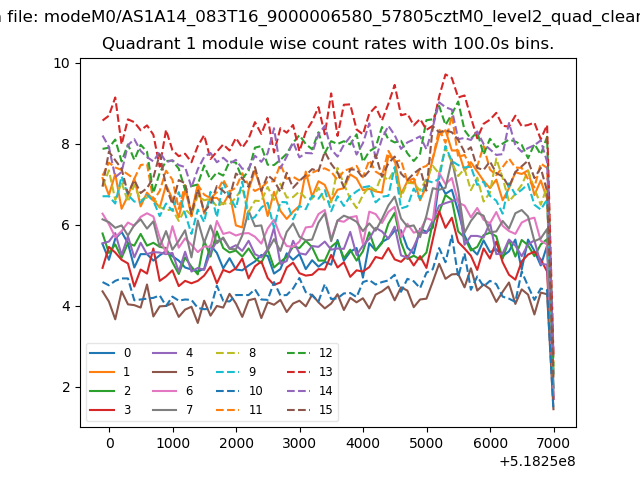
| Module-wise count rates for Quadrant A Data is divided into 100 sec bins |
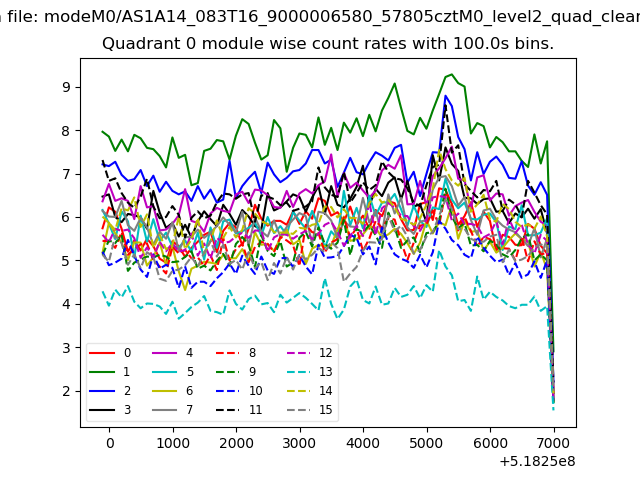 |
 |
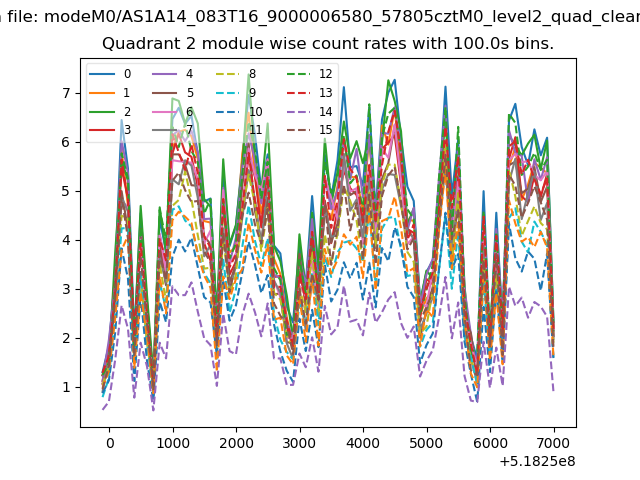
| Module-wise count rates for Quadrant B Data is divided into 100 sec bins |
 |
 |
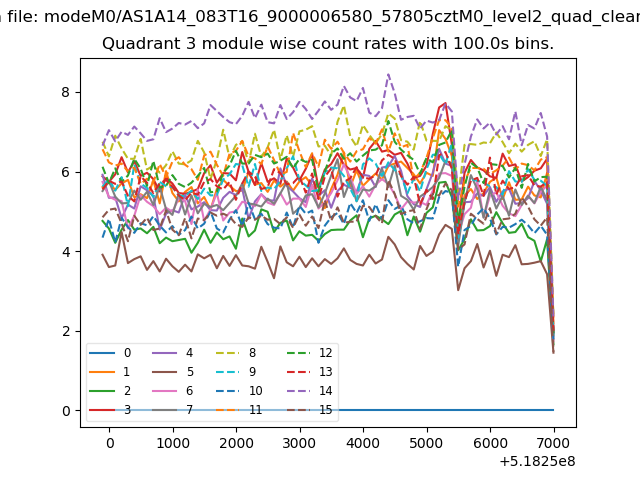
| Module-wise count rates for Quadrant C Data is divided into 100 sec bins |
 |
 |
| Module-wise count rates for Quadrant D Data is divided into 100 sec bins |
 |
 |
| Parameter | Plot |
|---|---|
| CZT HV Monitor | 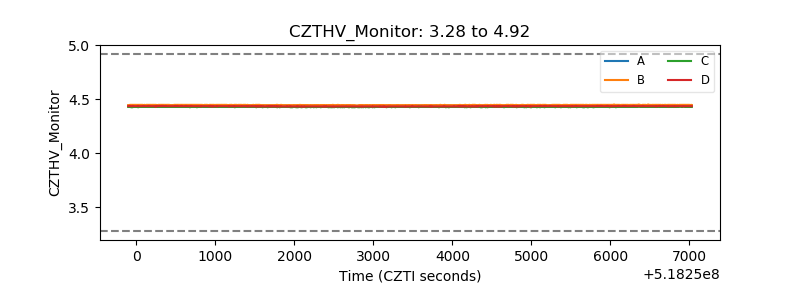 |
| D_VDD | 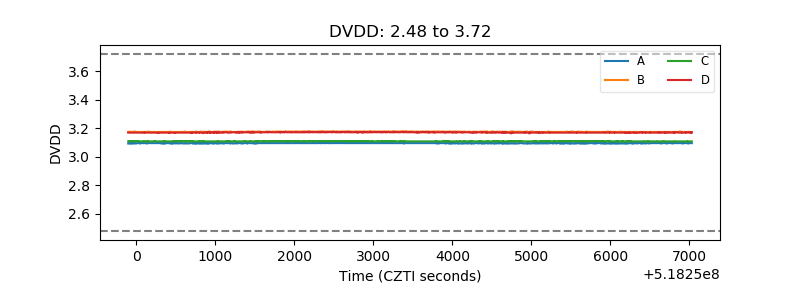 |
| Temperature 1 | 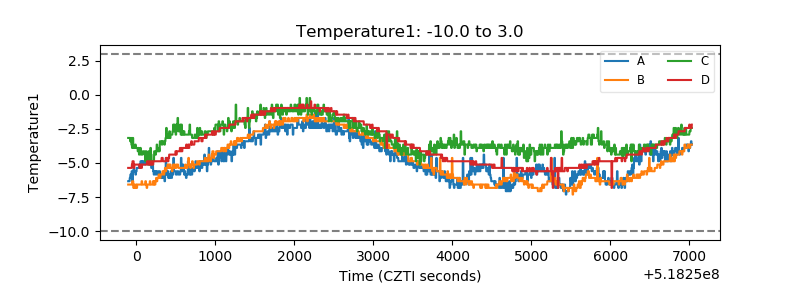 |
| Veto HV Monitor |  |
| Veto LLD | 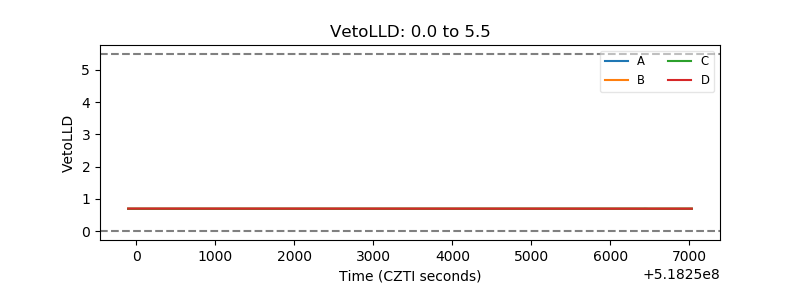 |
| Alpha Counter | 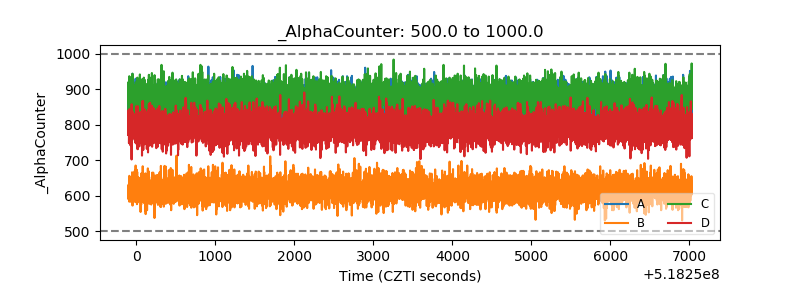 |
| _CPM_Rate | 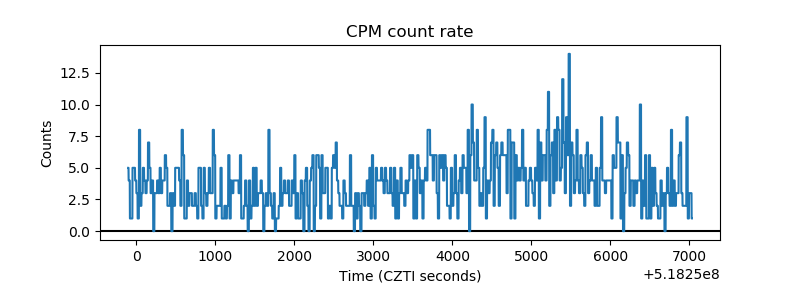 |
| CZT Counter | 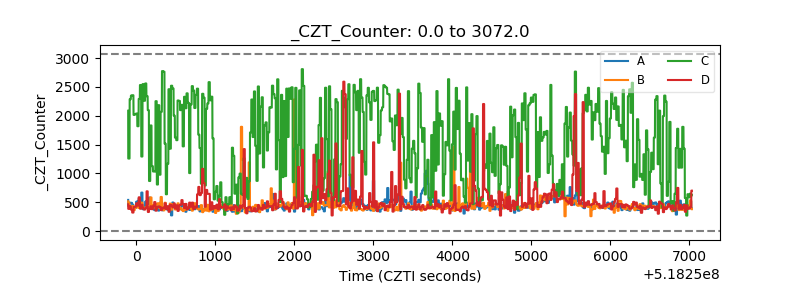 |
| +2.5 Volts monitor | 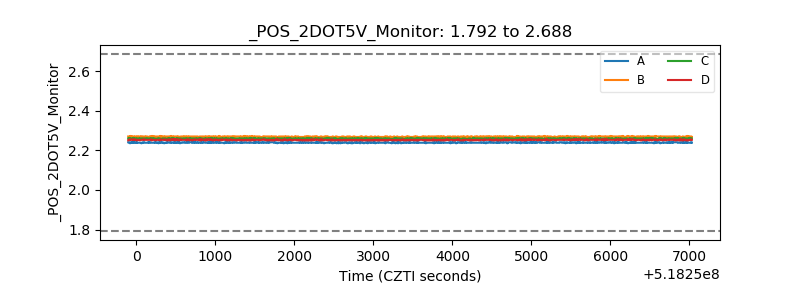 |
| +5 Volts monitor |  |
| _ROLL_ROT | 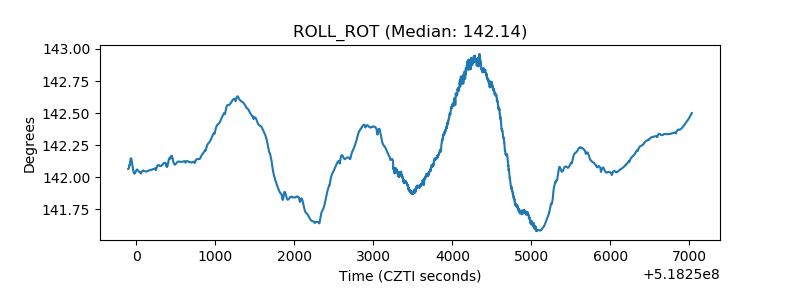 |
| _Roll_DEC | 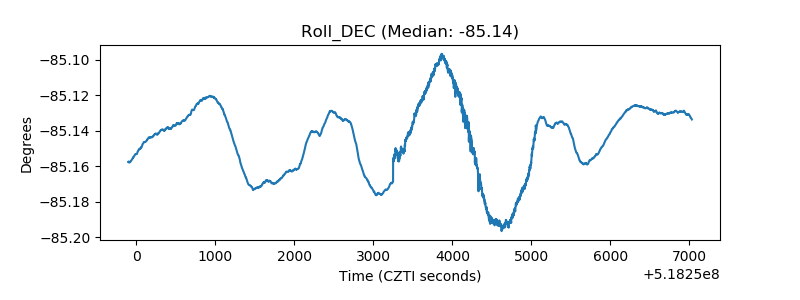 |
| _Roll_RA | 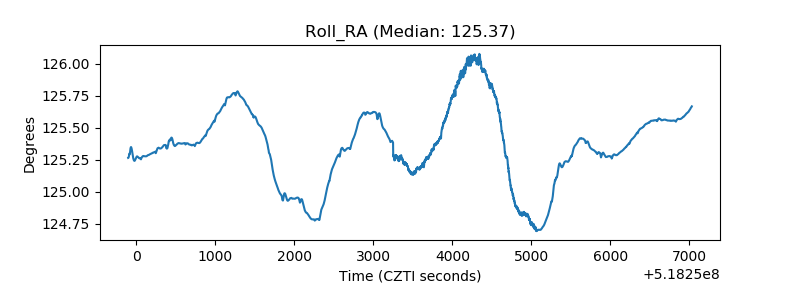 |
| Veto Counter | 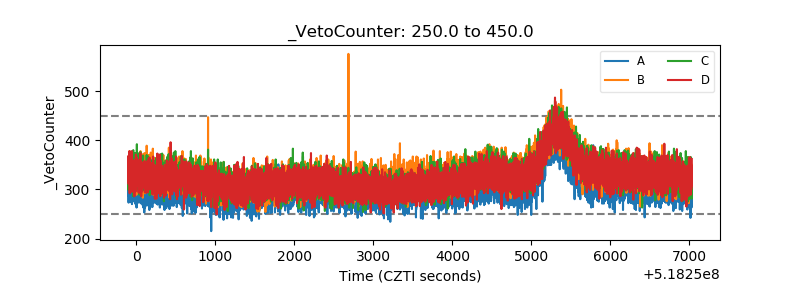 |