| Param | Original file | Final file |
|---|---|---|
| Filename | modeM0/AS1A14_083T16_9000006580_57809cztM0_level2.fits | modeM0/AS1A14_083T16_9000006580_57809cztM0_level2_quad_clean.evt |
| Size (bytes) | 2,003,483,520 | 339,108,480 |
| Size | 1.9 GB | 323.4 MB |
| Events in quadrant A | 14,328,916 | 2,336,432 |
| Events in quadrant B | 11,475,849 | 2,498,091 |
| Events in quadrant C | 32,771,431 | 1,616,808 |
| Events in quadrant D | 13,647,075 | 2,089,066 |
| Mode SS | |||
|---|---|---|---|
| Quadrant | BADHDUFLAG | Total packets | Discarded packets |
| A | 0 | 508 | 0 |
| B | 0 | 508 | 0 |
| C | 0 | 508 | 0 |
| D | 0 | 508 | 0 |
| Mode M0 | |||
|---|---|---|---|
| Quadrant | BADHDUFLAG | Total packets | Discarded packets |
| A | 0 | 58893 | 3 |
| B | 0 | 52661 | 3 |
| C | 0 | 114855 | 3 |
| D | 0 | 58504 | 3 |
| Mode M9 | |||
|---|---|---|---|
| Quadrant | BADHDUFLAG | Total packets | Discarded packets |
| A | 0 | 11 | 0 |
| B | 0 | 11 | 0 |
| C | 0 | 11 | 0 |
| D | 0 | 11 | 0 |
| Quadrant | Total seconds | Saturated seconds | Saturation percentage |
|---|---|---|---|
| A | 25081 | 492 | 1.961644% |
| B | 25082 | 502 | 2.001435% |
| C | 25082 | 6900 | 27.509768% |
| D | 25082 | 719 | 2.866598% |
Noise dominated data is calculated using 1-second bins in cleaned event files. If a bin has >2000 counts, and if more than 50% of those come from <1% of pixels, then it is considered to be noise-dominated and hence unusable.
| Quadrant | # 1 sec bins | Bins with >0 counts | Bins with >2000 counts | High rate bins dominated by noise | Noise dominated (total time) | Noise dominated (detector-on time) | Marked lightcurve |
|---|---|---|---|---|---|---|---|
| A | 26325 | 25081 | 95 | 95 | 0.36% | 0.38% | 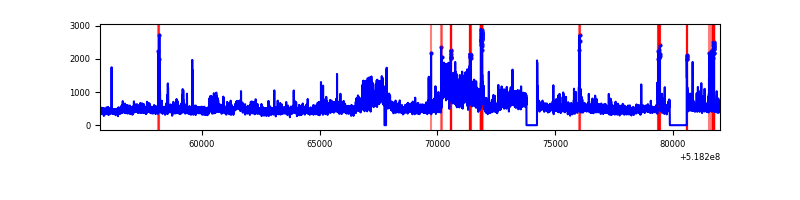 |
| B | 26326 | 25082 | 46 | 46 | 0.17% | 0.18% | 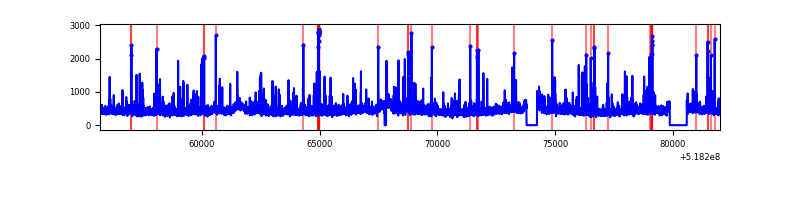 |
| C | 26326 | 25082 | 5739 | 5739 | 21.80% | 22.88% | 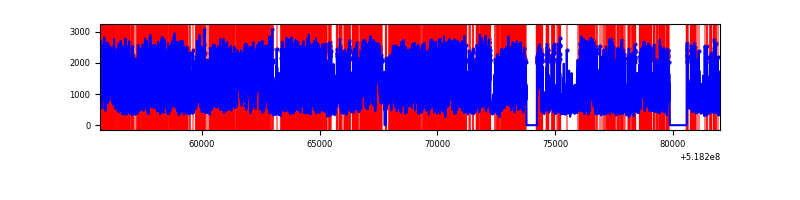 |
| D | 26326 | 25082 | 477 | 477 | 1.81% | 1.90% | 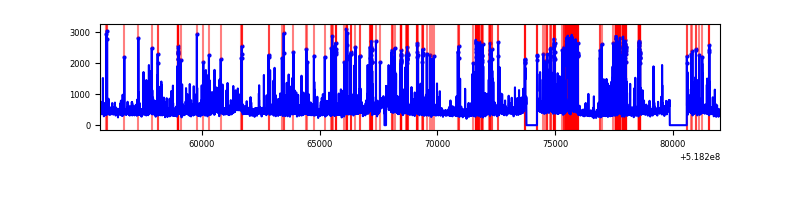 |
Top three noisy pixels from each quadrant. If the there are fewer than three noisy pixels in the level2.evt file, extra rows are filled as -1
| Pixel properties | Quadrant properties | ||||||
|---|---|---|---|---|---|---|---|
| Quadrant | DetID | PixID | Counts | Sigma | Mean | Median | Sigma |
| A | 3 | 14 | 2910434 | 4398.73 | 2677 | 2605 | 661.1 |
| A | 3 | 128 | 768941 | 1159.25 | 2677 | 2605 | 661.1 |
| A | 3 | 245 | 155840 | 231.8 | 2677 | 2605 | 661.1 |
| B | 7 | 252 | 200206 | 348.71 | 2653 | 2549 | 566.8 |
| B | 10 | 247 | 172546 | 299.91 | 2653 | 2549 | 566.8 |
| B | 0 | 245 | 72054 | 122.62 | 2653 | 2549 | 566.8 |
| C | 9 | 38 | 17190492 | 27038.57 | 2343 | 2319 | 635.7 |
| C | 15 | 224 | 5519807 | 8679.51 | 2343 | 2319 | 635.7 |
| C | 14 | 254 | 322931 | 504.35 | 2343 | 2319 | 635.7 |
| D | 8 | 240 | 1730192 | 2369.61 | 2592 | 2472 | 729.1 |
| D | 3 | 12 | 476928 | 650.73 | 2592 | 2472 | 729.1 |
| D | 5 | 173 | 249798 | 339.21 | 2592 | 2472 | 729.1 |
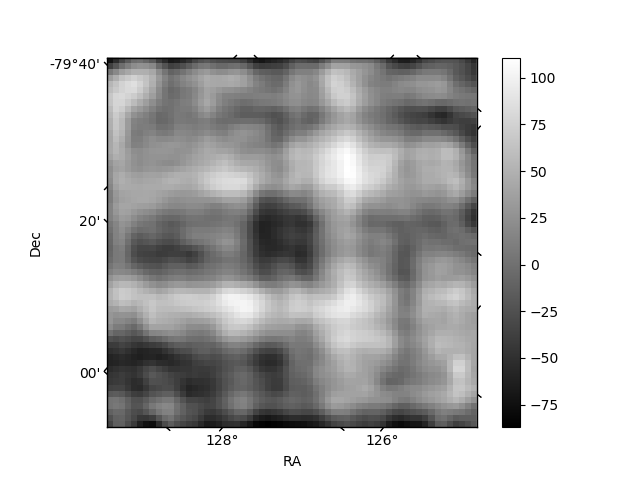
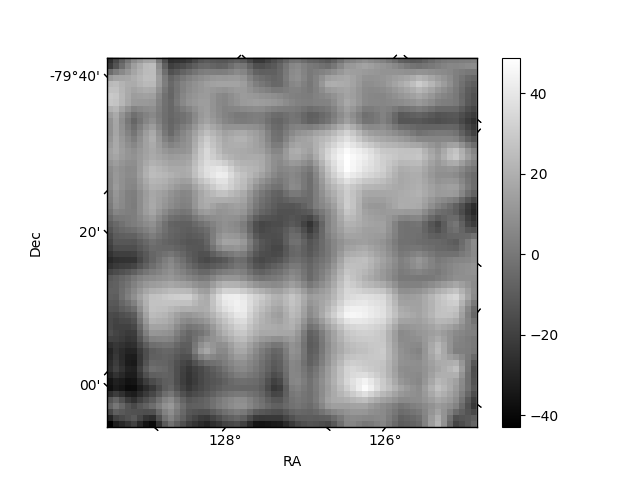
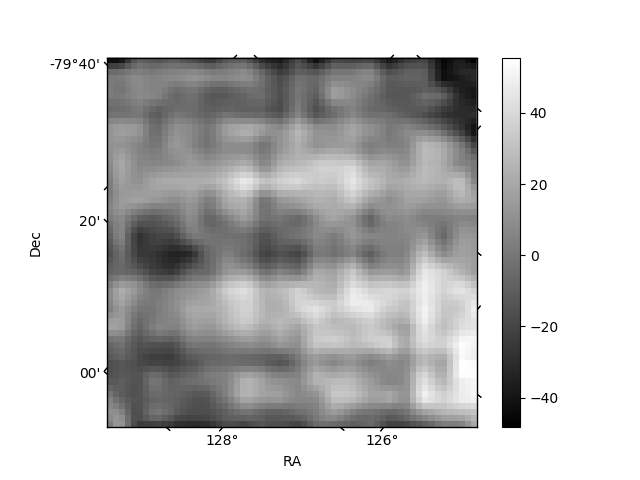
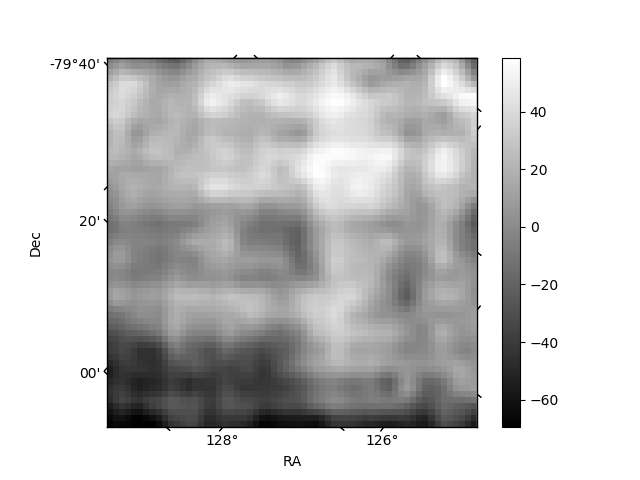
Histogram calculated using DETX and DETY for each event in the final _common_clean file
| Quadrant A | 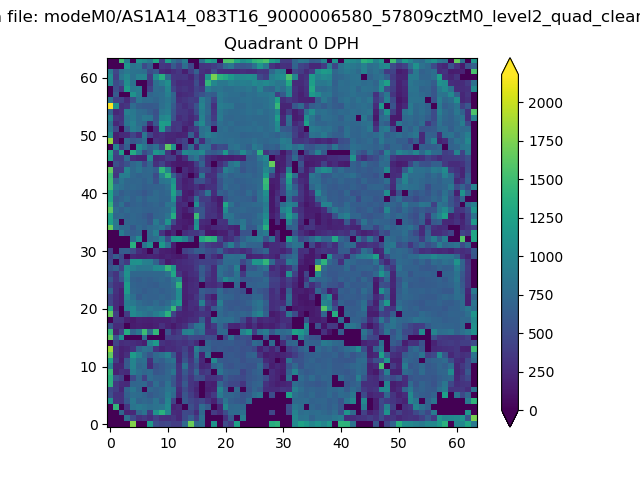 |
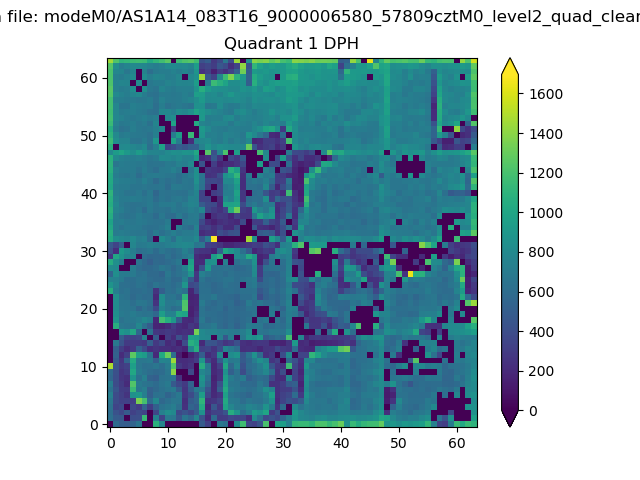 |
Quadrant B |
|---|---|---|---|
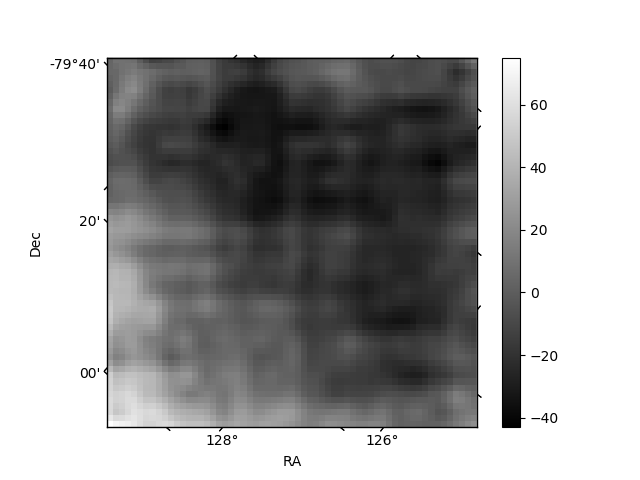
| Quadrant D | 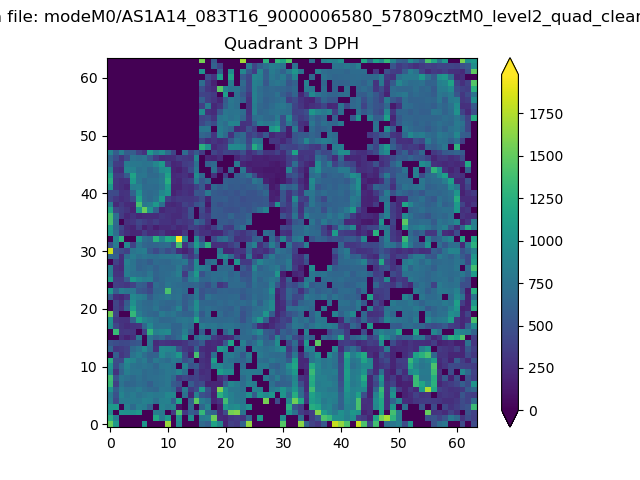 |
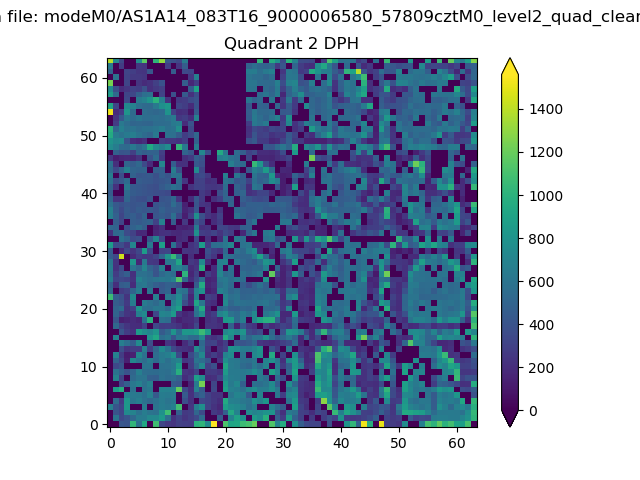 |
Quadrant C |
| Plot type | Count rate plots | Images |
|---|---|---|
| Comparison with Poisson distribution Blue bars denote a histogram of data divided into 1 sec bins. Red curve is a Poisson curve with rate = median count rate of data. |
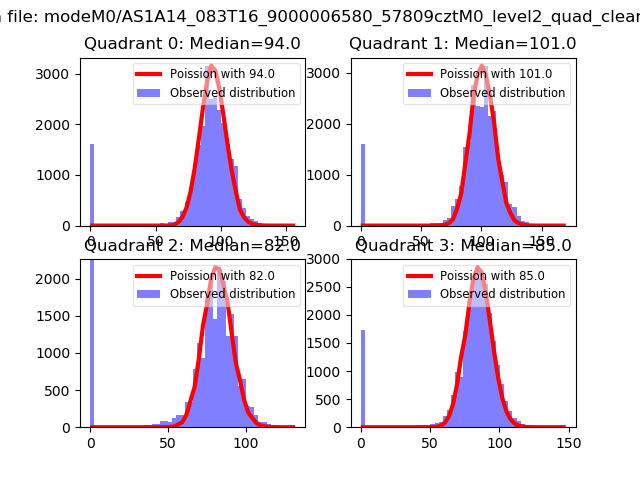 |
 |
| Quadrant-wise count rates Data is divided into 100 sec bins |
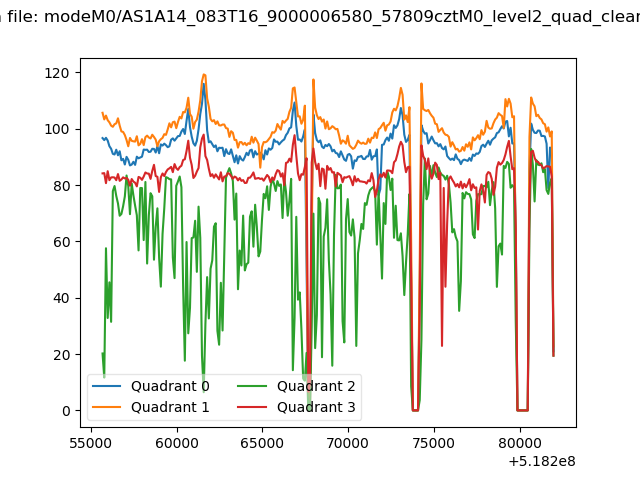 |
|
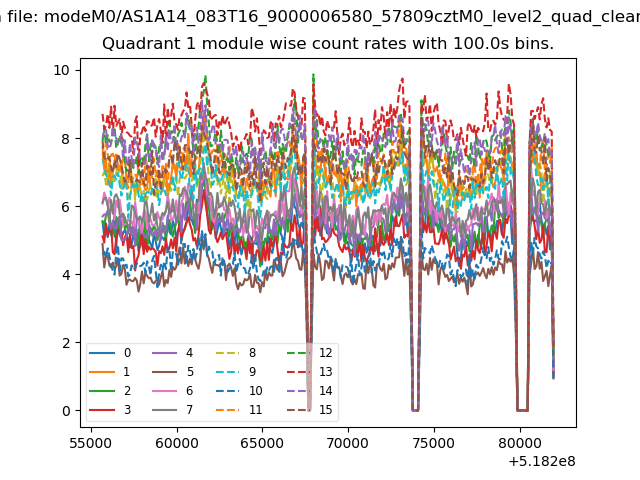
| Module-wise count rates for Quadrant A Data is divided into 100 sec bins |
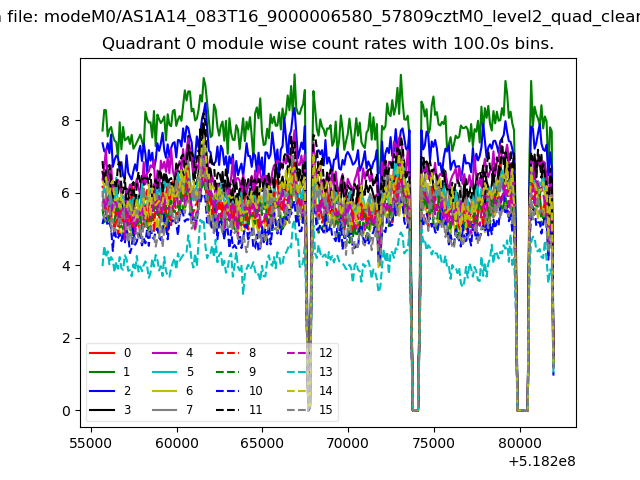 |
 |
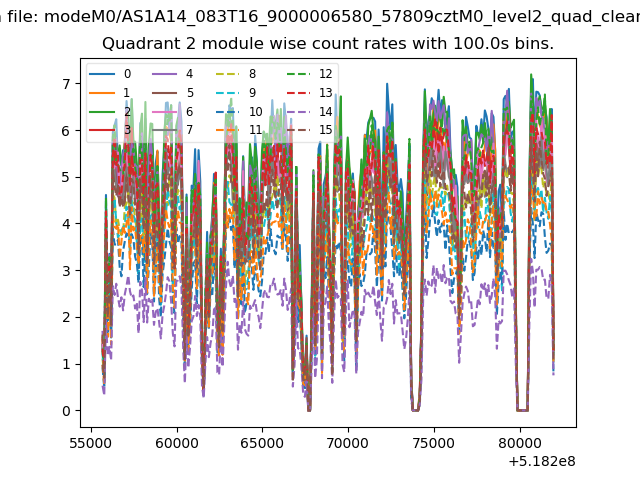
| Module-wise count rates for Quadrant B Data is divided into 100 sec bins |
 |
 |
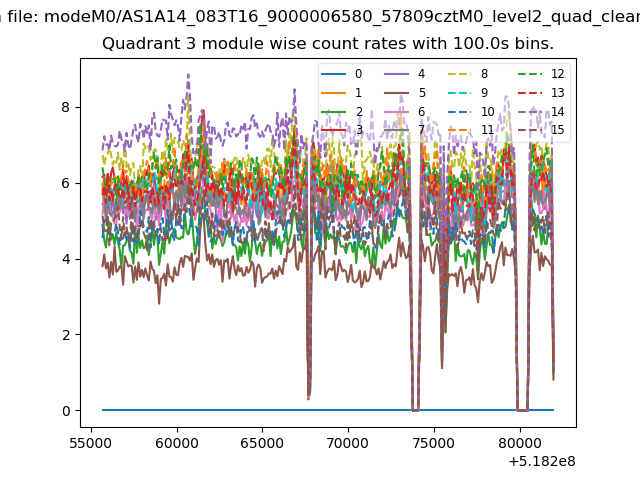
| Module-wise count rates for Quadrant C Data is divided into 100 sec bins |
 |
 |
| Module-wise count rates for Quadrant D Data is divided into 100 sec bins |
 |
 |
| Parameter | Plot |
|---|---|
| CZT HV Monitor | 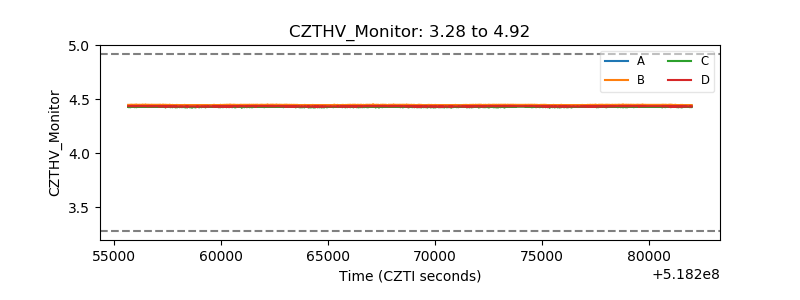 |
| D_VDD | 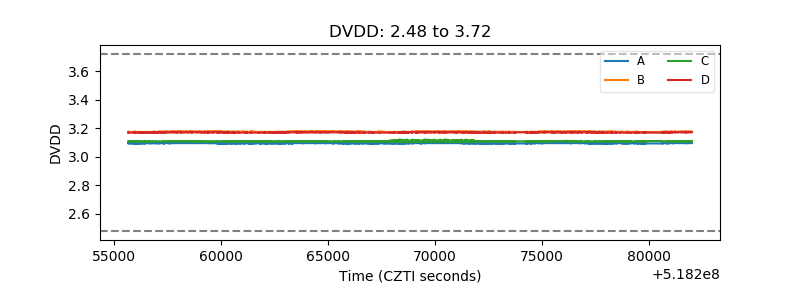 |
| Temperature 1 | 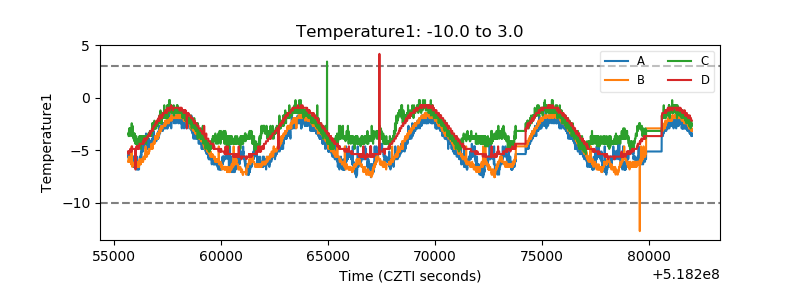 |
| Veto HV Monitor | 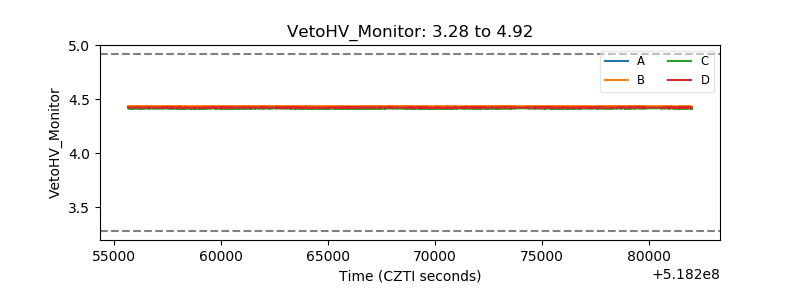 |
| Veto LLD | 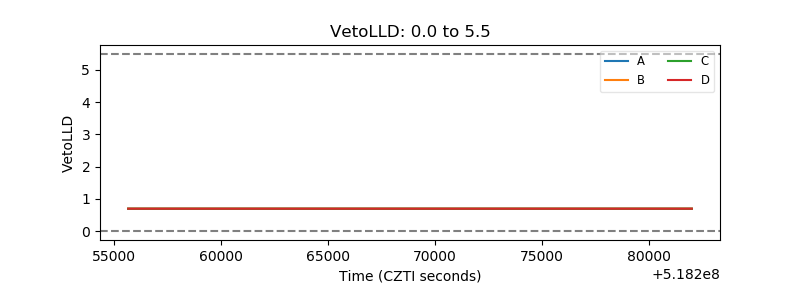 |
| Alpha Counter | 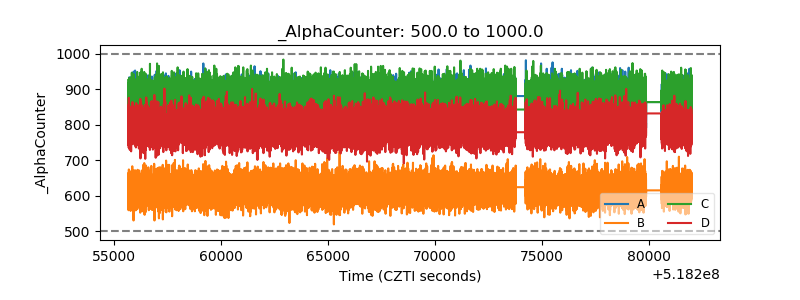 |
| _CPM_Rate | 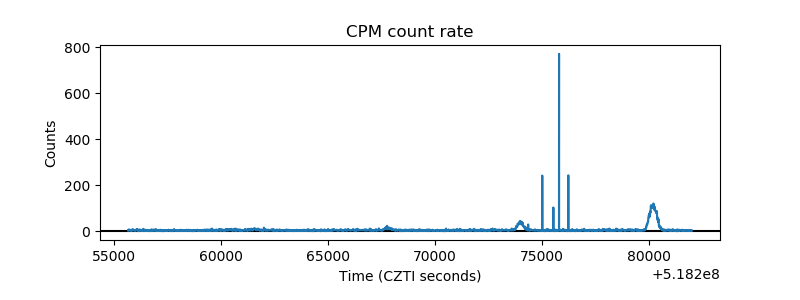 |
| CZT Counter | 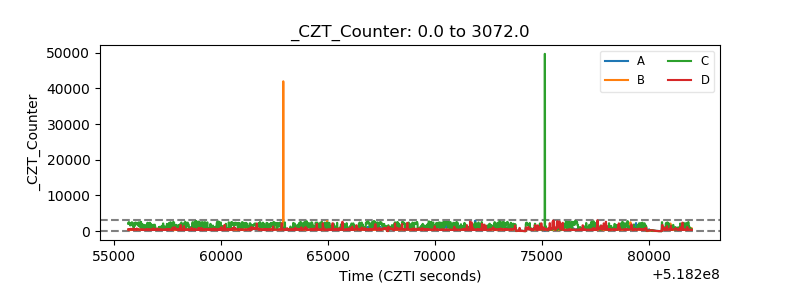 |
| +2.5 Volts monitor |  |
| +5 Volts monitor | 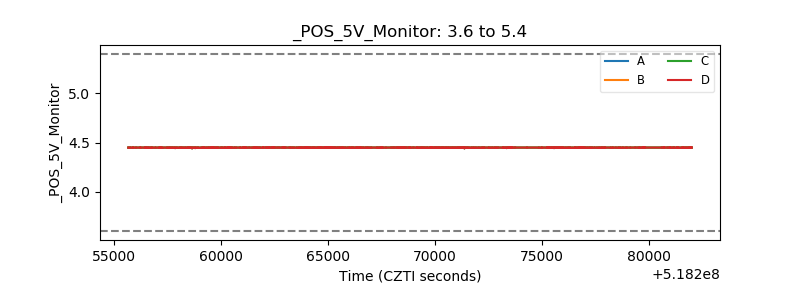 |
| _ROLL_ROT | 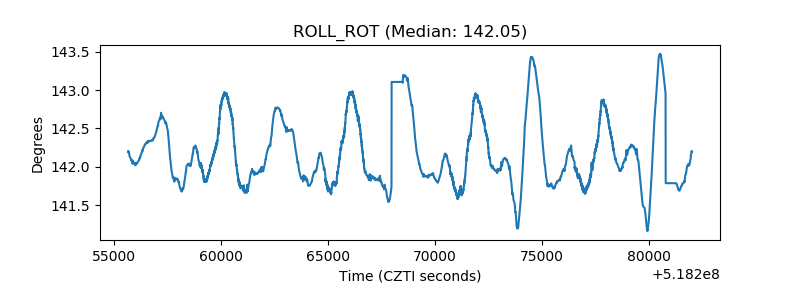 |
| _Roll_DEC | 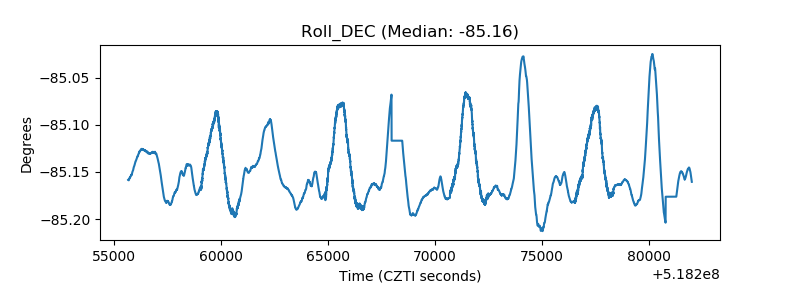 |
| _Roll_RA | 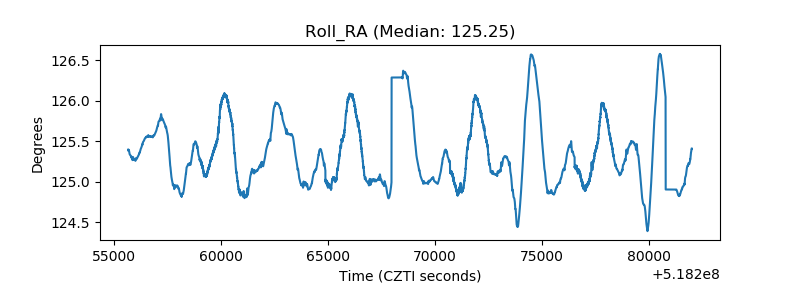 |
| Veto Counter | 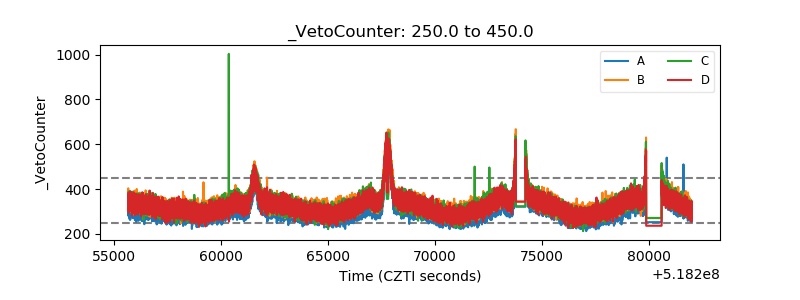 |