| Param | Original file | Final file |
|---|---|---|
| Filename | modeM0/AS1A14_083T16_9000006580_57812cztM0_level2.fits | modeM0/AS1A14_083T16_9000006580_57812cztM0_level2_quad_clean.evt |
| Size (bytes) | 693,815,040 | 74,373,120 |
| Size | 661.7 MB | 70.9 MB |
| Events in quadrant A | 3,415,413 | 584,512 |
| Events in quadrant B | 3,054,958 | 624,098 |
| Events in quadrant C | 10,722,468 | 274,855 |
| Events in quadrant D | 8,013,094 | 339,819 |
| Mode SS | |||
|---|---|---|---|
| Quadrant | BADHDUFLAG | Total packets | Discarded packets |
| A | 0 | 126 | 2 |
| B | 0 | 126 | 2 |
| C | 0 | 125 | 1 |
| D | 0 | 126 | 2 |
| Mode M0 | |||
|---|---|---|---|
| Quadrant | BADHDUFLAG | Total packets | Discarded packets |
| A | 0 | 14158 | 98 |
| B | 0 | 13757 | 64 |
| C | 0 | 36180 | 69 |
| D | 0 | 28466 | 294 |
| Mode M9 | |||
|---|---|---|---|
| Quadrant | BADHDUFLAG | Total packets | Discarded packets |
| A | 0 | 10 | 0 |
| B | 0 | 10 | 0 |
| C | 0 | 10 | 0 |
| D | 0 | 10 | 0 |
| Quadrant | Total seconds | Saturated seconds | Saturation percentage |
|---|---|---|---|
| A | 6138 | 121 | 1.971326% |
| B | 6143 | 112 | 1.823213% |
| C | 6140 | 3386 | 55.146580% |
| D | 6127 | 2242 | 36.592133% |
Noise dominated data is calculated using 1-second bins in cleaned event files. If a bin has >2000 counts, and if more than 50% of those come from <1% of pixels, then it is considered to be noise-dominated and hence unusable.
| Quadrant | # 1 sec bins | Bins with >0 counts | Bins with >2000 counts | High rate bins dominated by noise | Noise dominated (total time) | Noise dominated (detector-on time) | Marked lightcurve |
|---|---|---|---|---|---|---|---|
| A | 7114 | 6140 | 56 | 56 | 0.79% | 0.91% | 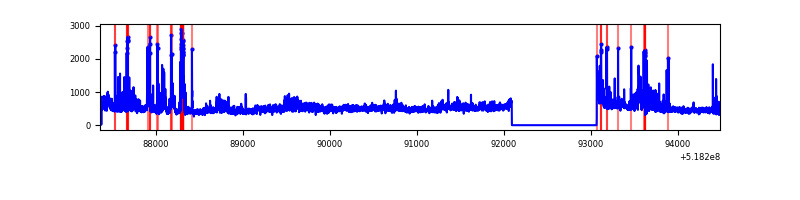 |
| B | 7120 | 6146 | 35 | 35 | 0.49% | 0.57% | 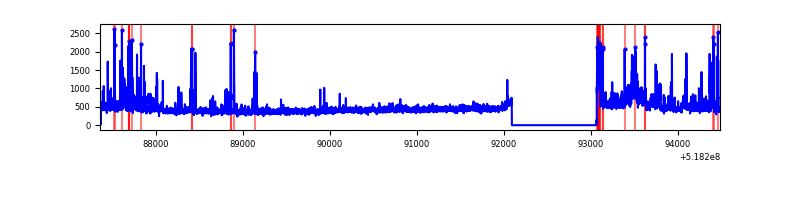 |
| C | 7118 | 6144 | 2993 | 2993 | 42.05% | 48.71% | 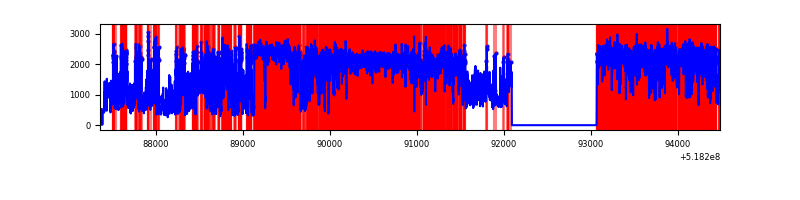 |
| D | 7113 | 6135 | 2020 | 2020 | 28.40% | 32.93% | 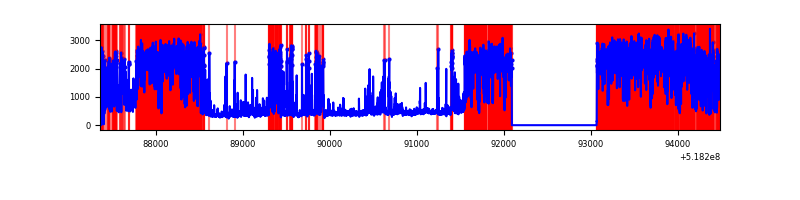 |
Top three noisy pixels from each quadrant. If the there are fewer than three noisy pixels in the level2.evt file, extra rows are filled as -1
| Pixel properties | Quadrant properties | ||||||
|---|---|---|---|---|---|---|---|
| Quadrant | DetID | PixID | Counts | Sigma | Mean | Median | Sigma |
| A | 3 | 14 | 471881 | 2959.25 | 642 | 627 | 159.2 |
| A | 10 | 251 | 274072 | 1717.1 | 642 | 627 | 159.2 |
| A | 3 | 128 | 134393 | 839.98 | 642 | 627 | 159.2 |
| B | 10 | 16 | 167759 | 1229.11 | 639 | 616 | 136.0 |
| B | 0 | 245 | 64743 | 471.57 | 639 | 616 | 136.0 |
| B | 7 | 252 | 61425 | 447.17 | 639 | 616 | 136.0 |
| C | 9 | 38 | 7829554 | 58638.41 | 487 | 482 | 133.5 |
| C | 15 | 224 | 742117 | 5554.72 | 487 | 482 | 133.5 |
| C | 12 | 2 | 126431 | 943.34 | 487 | 482 | 133.5 |
| D | 2 | 249 | 4395039 | 31972.9 | 476 | 453 | 137.4 |
| D | 8 | 240 | 1265278 | 9202.26 | 476 | 453 | 137.4 |
| D | 3 | 12 | 150088 | 1088.67 | 476 | 453 | 137.4 |
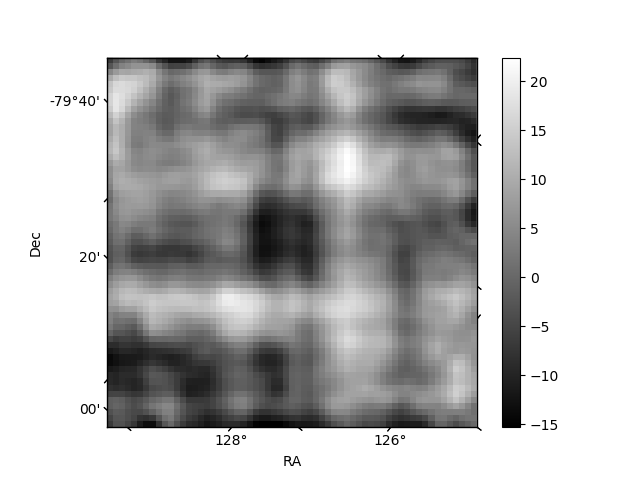
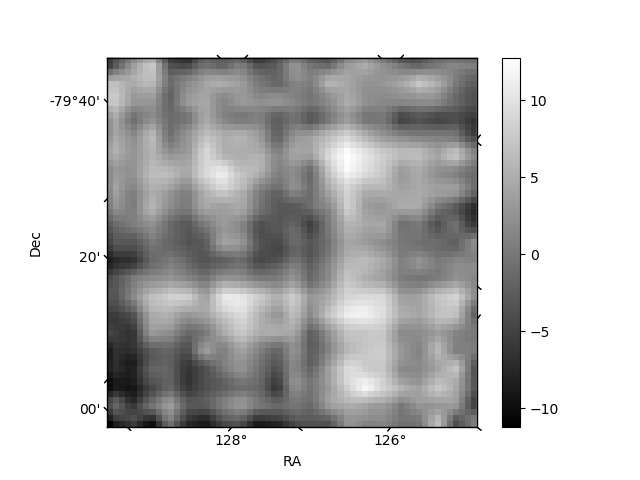
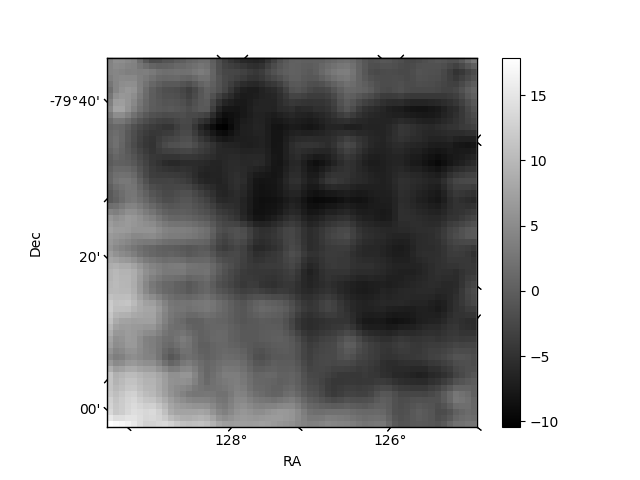
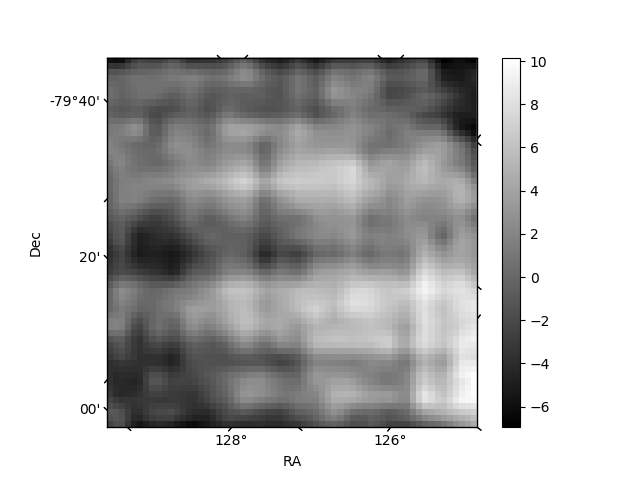
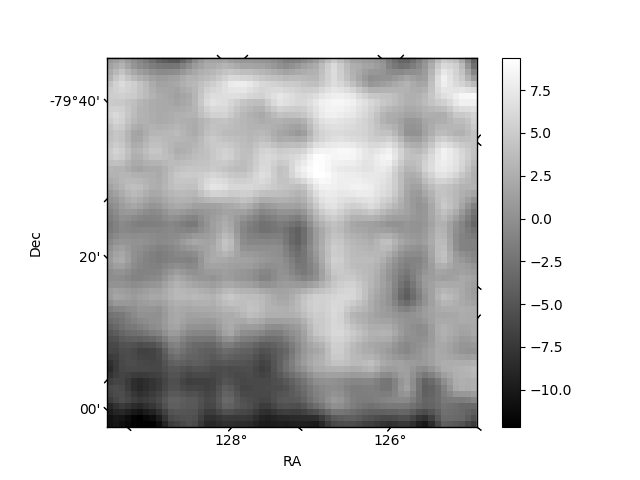
Histogram calculated using DETX and DETY for each event in the final _common_clean file
| Quadrant A | 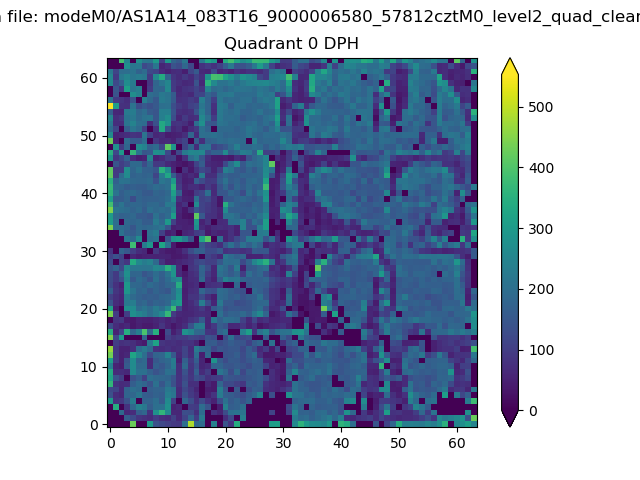 |
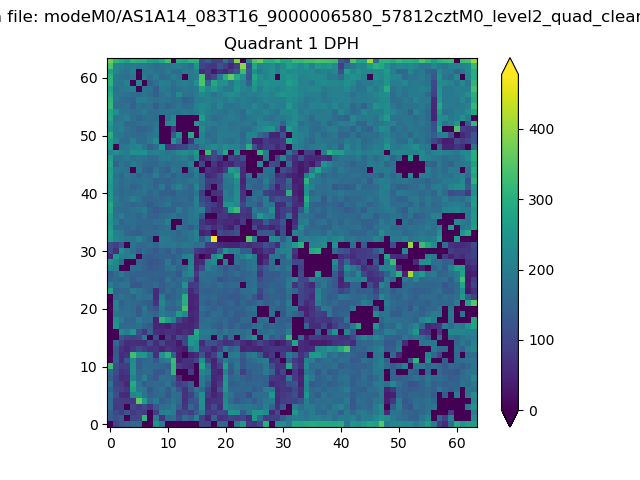 |
Quadrant B |
|---|---|---|---|
| Quadrant D | 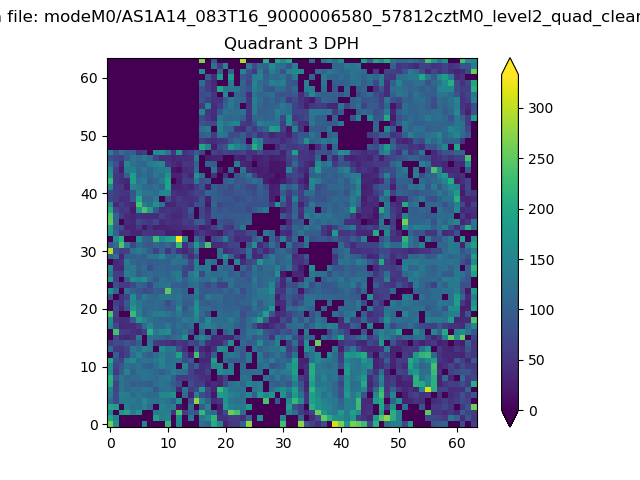 |
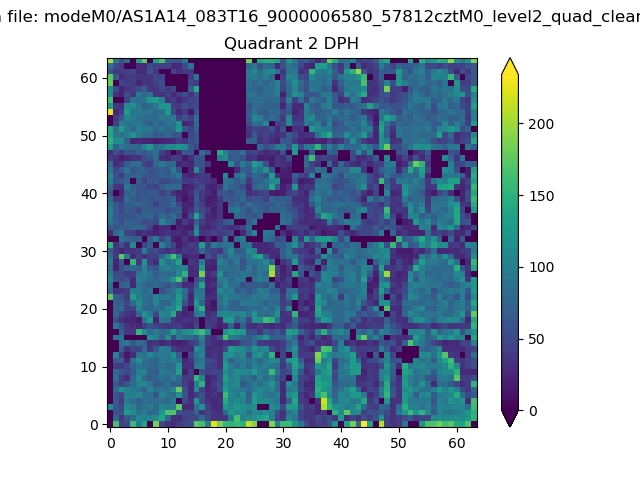 |
Quadrant C |
| Plot type | Count rate plots | Images |
|---|---|---|
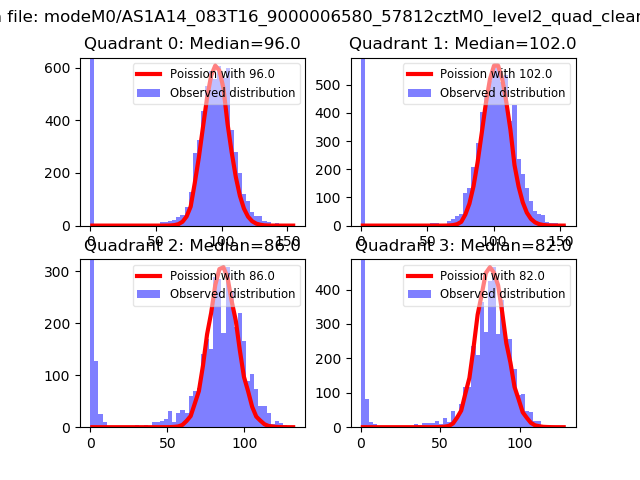
| Comparison with Poisson distribution Blue bars denote a histogram of data divided into 1 sec bins. Red curve is a Poisson curve with rate = median count rate of data. |
 |
 |
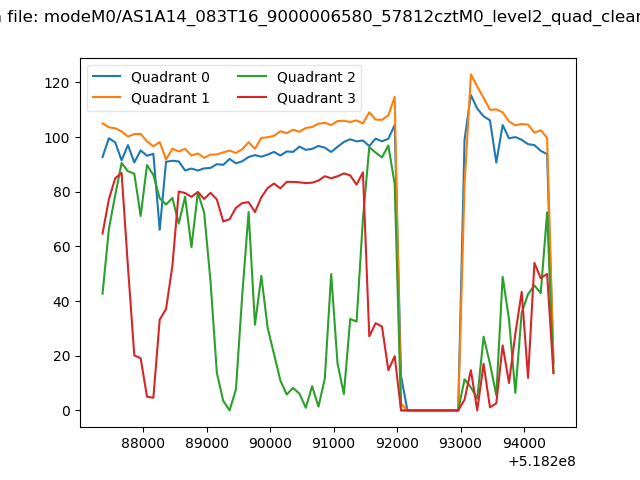
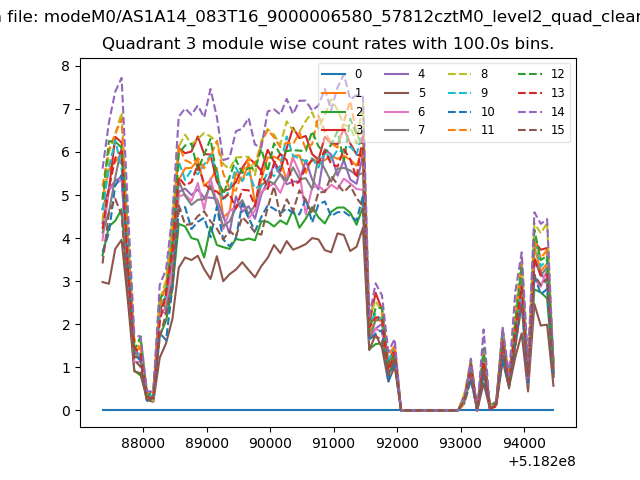
| Quadrant-wise count rates Data is divided into 100 sec bins |
 |
|
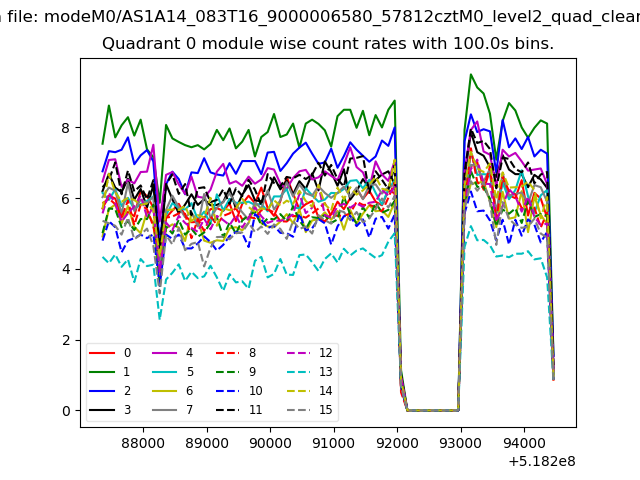
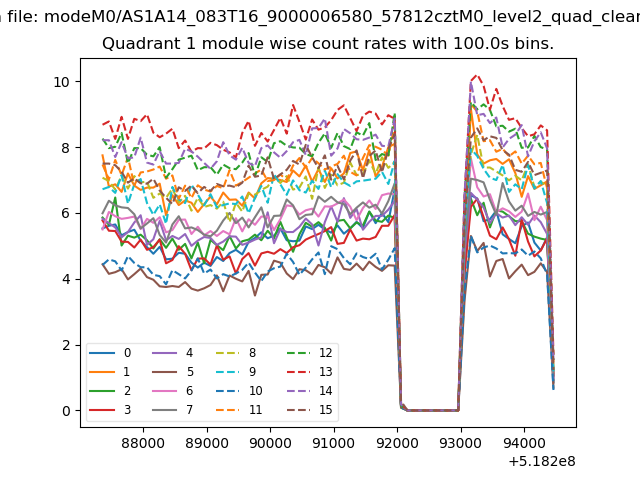
| Module-wise count rates for Quadrant A Data is divided into 100 sec bins |
 |
 |
| Module-wise count rates for Quadrant B Data is divided into 100 sec bins |
 |
 |
| Module-wise count rates for Quadrant C Data is divided into 100 sec bins |
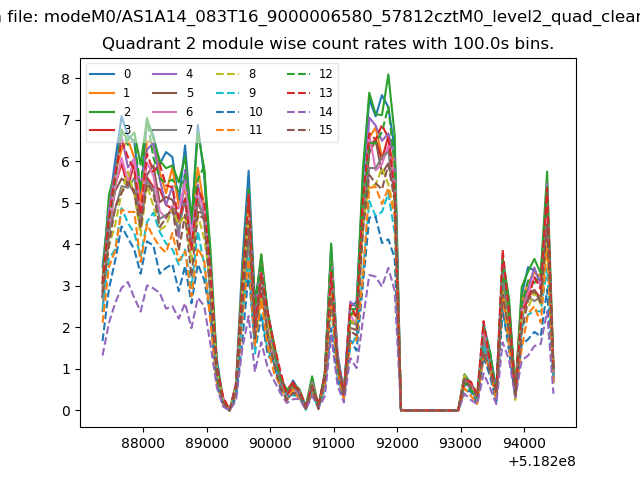 |
 |
| Module-wise count rates for Quadrant D Data is divided into 100 sec bins |
 |
 |
| Parameter | Plot |
|---|---|
| CZT HV Monitor |  |
| D_VDD | 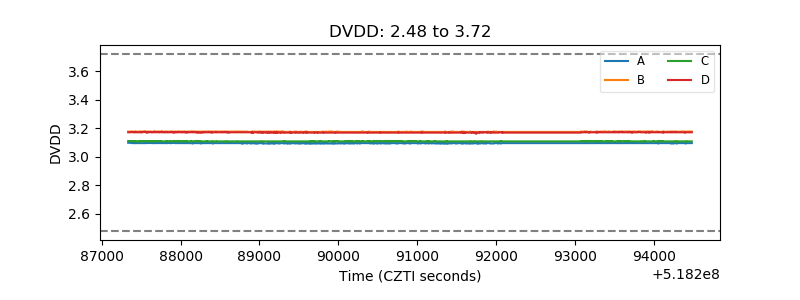 |
| Temperature 1 | 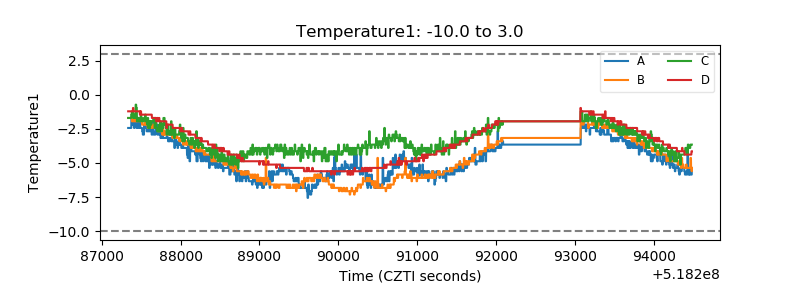 |
| Veto HV Monitor | 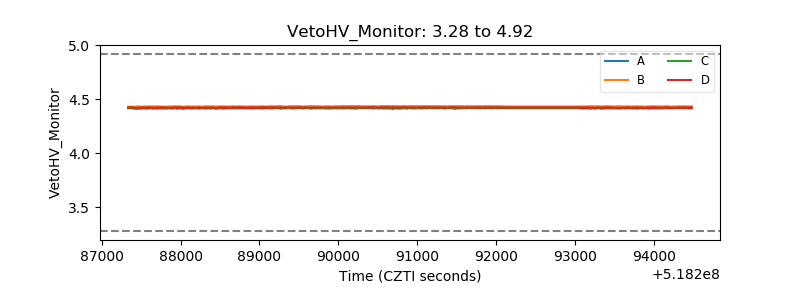 |
| Veto LLD | 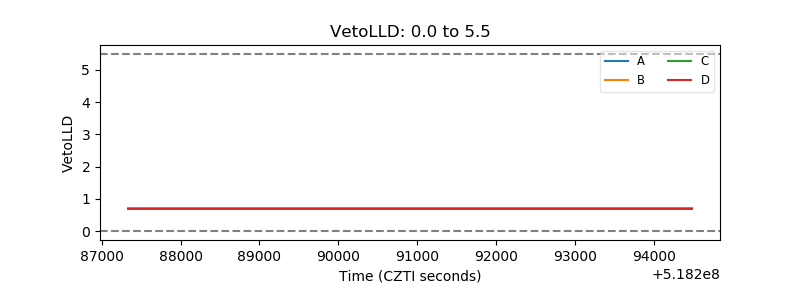 |
| Alpha Counter | 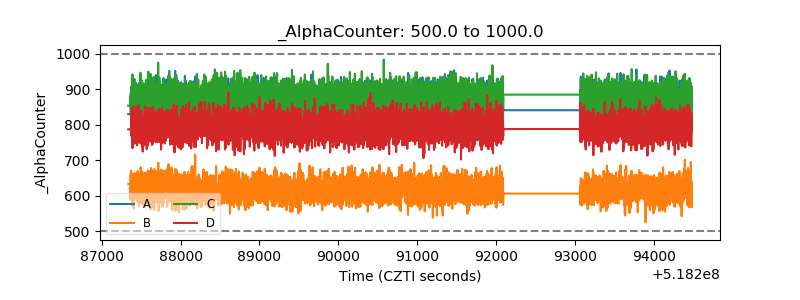 |
| _CPM_Rate | 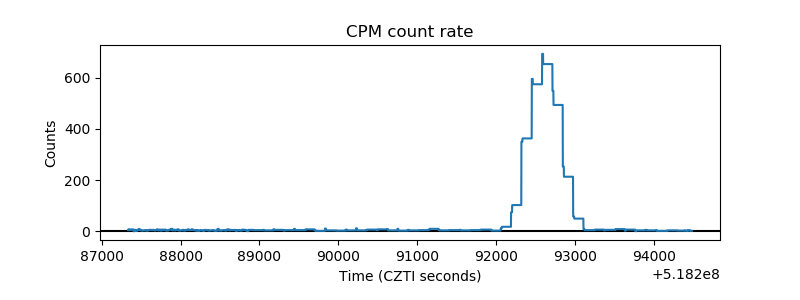 |
| CZT Counter | 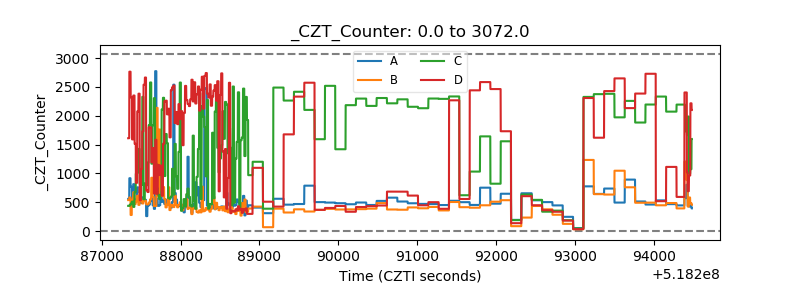 |
| +2.5 Volts monitor | 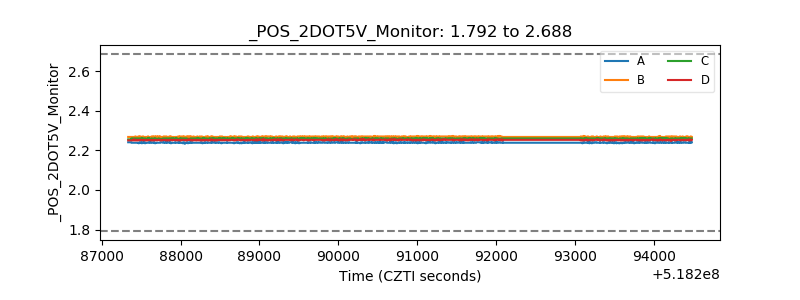 |
| +5 Volts monitor |  |
| _ROLL_ROT | 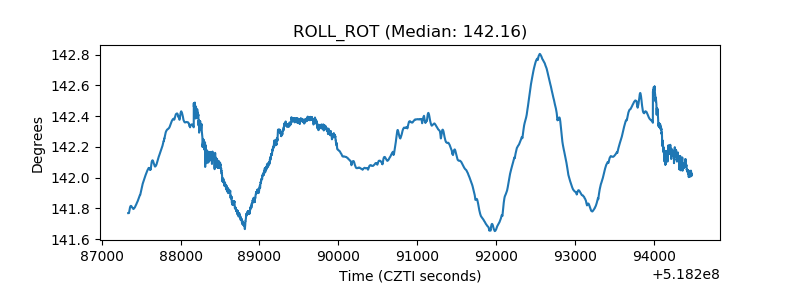 |
| _Roll_DEC | 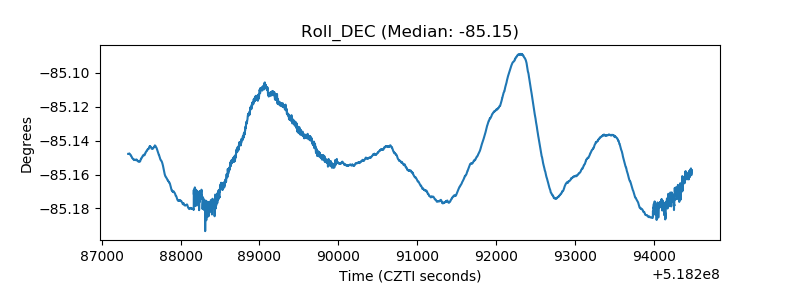 |
| _Roll_RA | 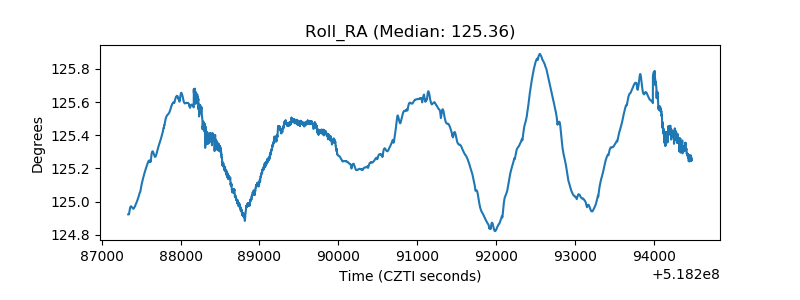 |
| Veto Counter | 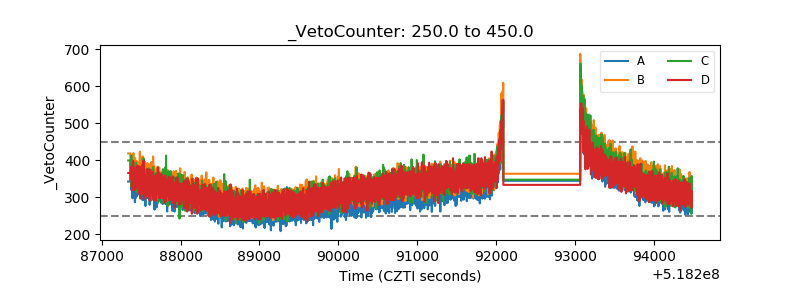 |