| Param | Original file | Final file |
|---|---|---|
| Filename | modeM0/AS1A14_083T16_9000006580_57817cztM0_level2.fits | modeM0/AS1A14_083T16_9000006580_57817cztM0_level2_quad_clean.evt |
| Size (bytes) | 553,815,360 | 80,899,200 |
| Size | 528.2 MB | 77.2 MB |
| Events in quadrant A | 3,336,975 | 558,874 |
| Events in quadrant B | 2,923,941 | 607,889 |
| Events in quadrant C | 10,476,216 | 335,542 |
| Events in quadrant D | 3,251,408 | 488,339 |
| Mode SS | |||
|---|---|---|---|
| Quadrant | BADHDUFLAG | Total packets | Discarded packets |
| A | 0 | 132 | 0 |
| B | 0 | 132 | 0 |
| C | 0 | 132 | 0 |
| D | 0 | 132 | 0 |
| Mode M0 | |||
|---|---|---|---|
| Quadrant | BADHDUFLAG | Total packets | Discarded packets |
| A | 0 | 14641 | 1 |
| B | 0 | 13649 | 1 |
| C | 0 | 35654 | 1 |
| D | 0 | 14550 | 1 |
| Mode M9 | |||
|---|---|---|---|
| Quadrant | BADHDUFLAG | Total packets | Discarded packets |
| A | 0 | 10 | 0 |
| B | 0 | 10 | 0 |
| C | 0 | 10 | 0 |
| D | 0 | 10 | 0 |
| Quadrant | Total seconds | Saturated seconds | Saturation percentage |
|---|---|---|---|
| A | 6584 | 91 | 1.382139% |
| B | 6585 | 67 | 1.017464% |
| C | 6585 | 2666 | 40.485953% |
| D | 6585 | 53 | 0.804860% |
Noise dominated data is calculated using 1-second bins in cleaned event files. If a bin has >2000 counts, and if more than 50% of those come from <1% of pixels, then it is considered to be noise-dominated and hence unusable.
| Quadrant | # 1 sec bins | Bins with >0 counts | Bins with >2000 counts | High rate bins dominated by noise | Noise dominated (total time) | Noise dominated (detector-on time) | Marked lightcurve |
|---|---|---|---|---|---|---|---|
| A | 7814 | 6860 | 63 | 63 | 0.81% | 0.92% | 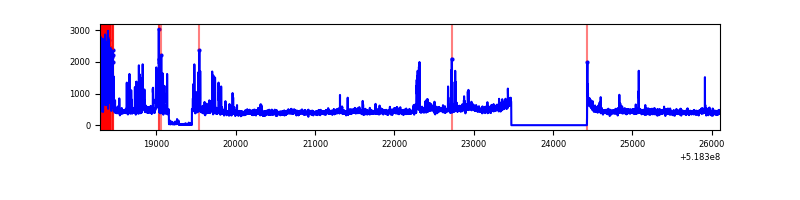 |
| B | 7815 | 6861 | 7 | 7 | 0.09% | 0.10% | 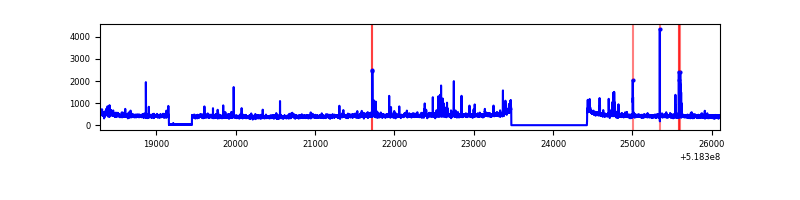 |
| C | 7815 | 6837 | 2387 | 2387 | 30.54% | 34.91% | 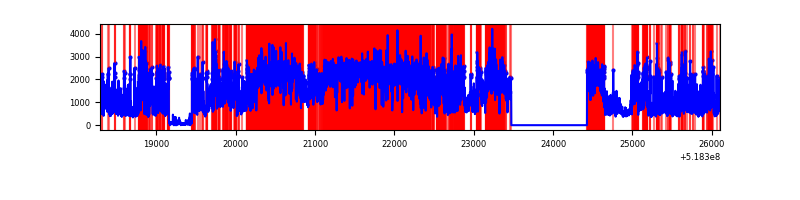 |
| D | 7815 | 6861 | 27 | 27 | 0.35% | 0.39% | 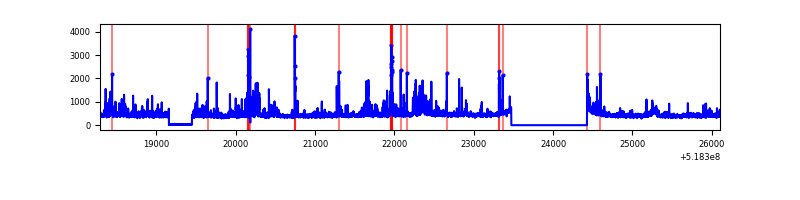 |
Top three noisy pixels from each quadrant. If the there are fewer than three noisy pixels in the level2.evt file, extra rows are filled as -1
| Pixel properties | Quadrant properties | ||||||
|---|---|---|---|---|---|---|---|
| Quadrant | DetID | PixID | Counts | Sigma | Mean | Median | Sigma |
| A | 3 | 14 | 512587 | 2972.53 | 687 | 669 | 172.2 |
| A | 3 | 128 | 98204 | 566.35 | 687 | 669 | 172.2 |
| A | 10 | 251 | 33254 | 189.21 | 687 | 669 | 172.2 |
| B | 7 | 252 | 37214 | 252.17 | 685 | 659 | 145.0 |
| B | 0 | 63 | 31759 | 214.54 | 685 | 659 | 145.0 |
| B | 4 | 142 | 28230 | 190.2 | 685 | 659 | 145.0 |
| C | 9 | 38 | 6332340 | 40867.58 | 573 | 568 | 154.9 |
| C | 15 | 224 | 1576536 | 10171.88 | 573 | 568 | 154.9 |
| C | 14 | 254 | 215643 | 1388.17 | 573 | 568 | 154.9 |
| D | 3 | 12 | 164293 | 869.65 | 665 | 635 | 188.2 |
| D | 2 | 153 | 128762 | 680.84 | 665 | 635 | 188.2 |
| D | 3 | 224 | 121100 | 640.13 | 665 | 635 | 188.2 |
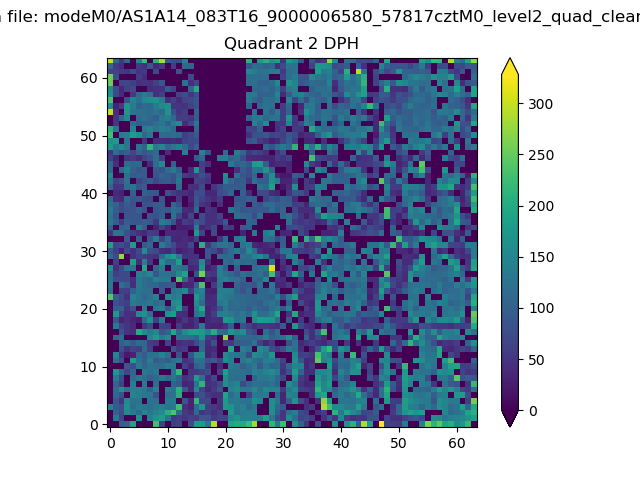
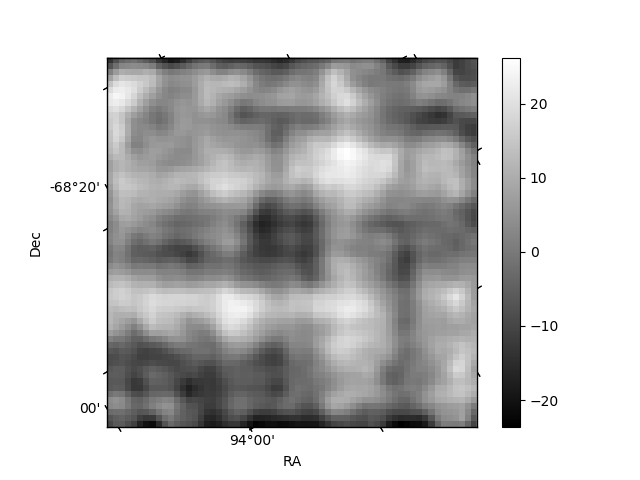
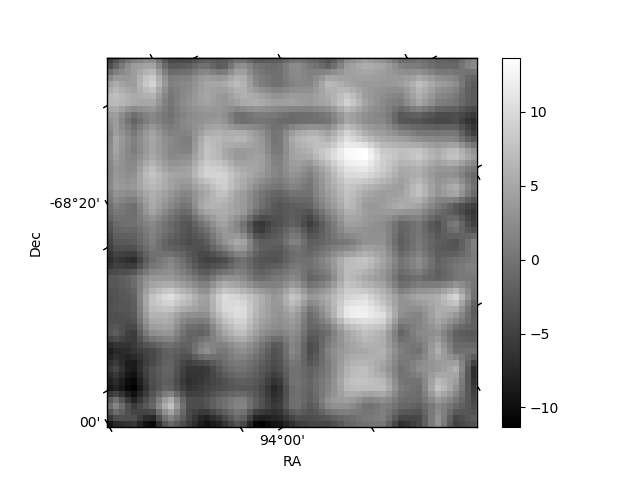
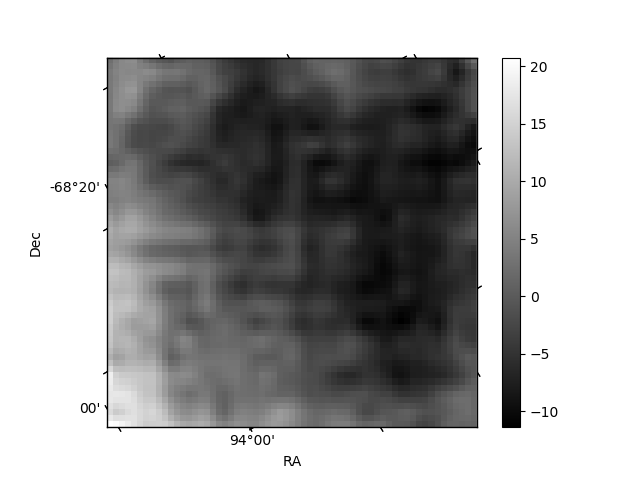
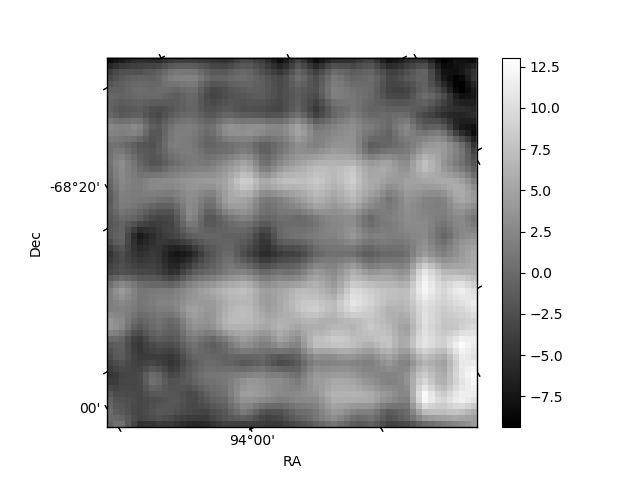
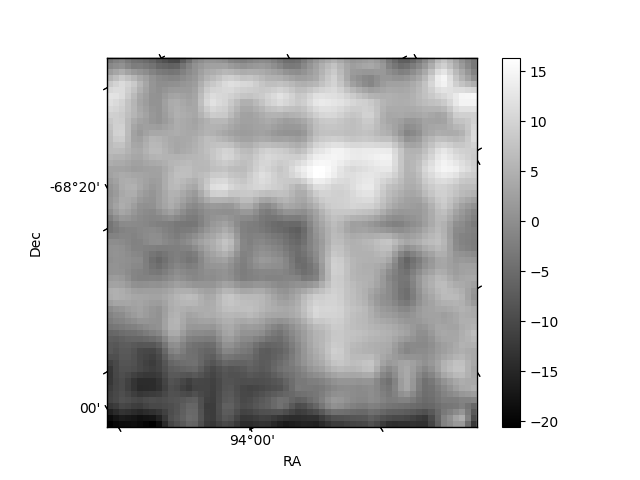
Histogram calculated using DETX and DETY for each event in the final _common_clean file
| Quadrant A | 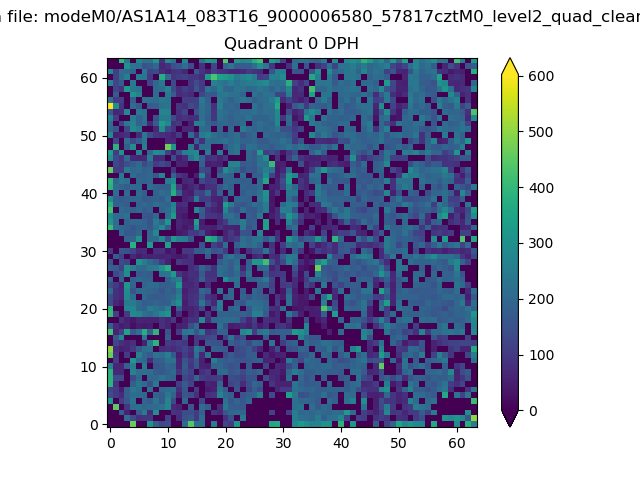 |
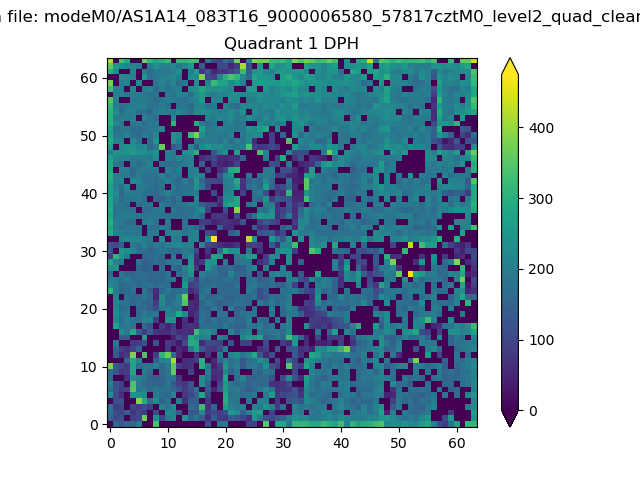 |
Quadrant B |
|---|---|---|---|
| Quadrant D | 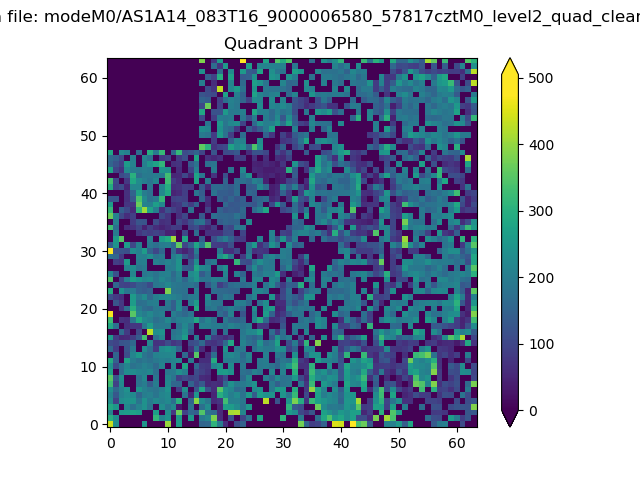 |
 |
Quadrant C |
| Plot type | Count rate plots | Images |
|---|---|---|
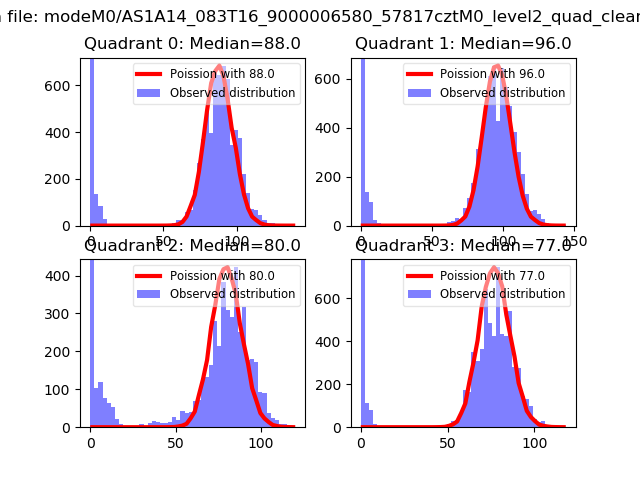
| Comparison with Poisson distribution Blue bars denote a histogram of data divided into 1 sec bins. Red curve is a Poisson curve with rate = median count rate of data. |
 |
 |
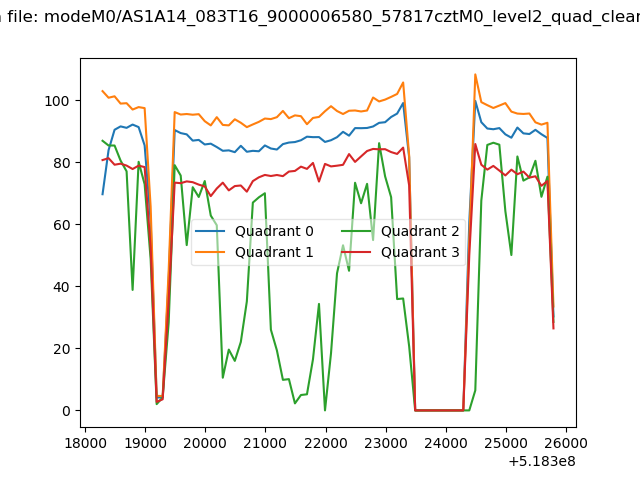
| Quadrant-wise count rates Data is divided into 100 sec bins |
 |
|
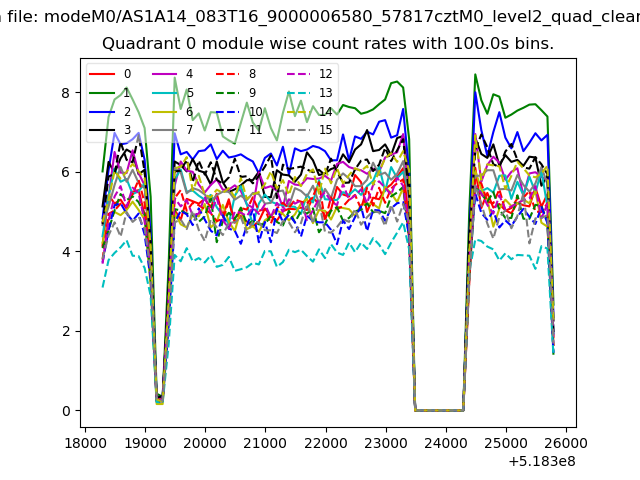
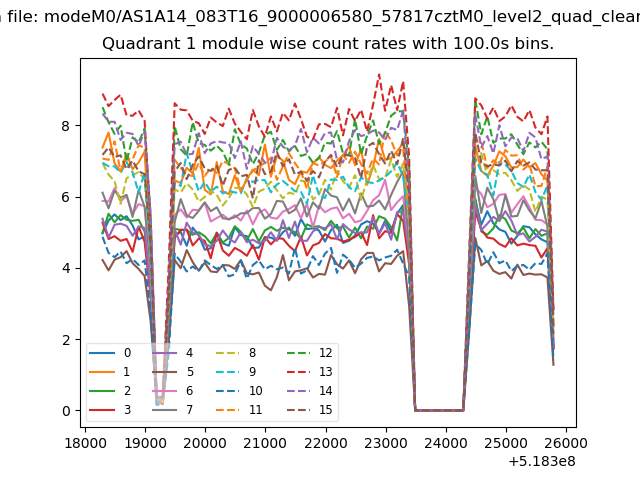
| Module-wise count rates for Quadrant A Data is divided into 100 sec bins |
 |
 |
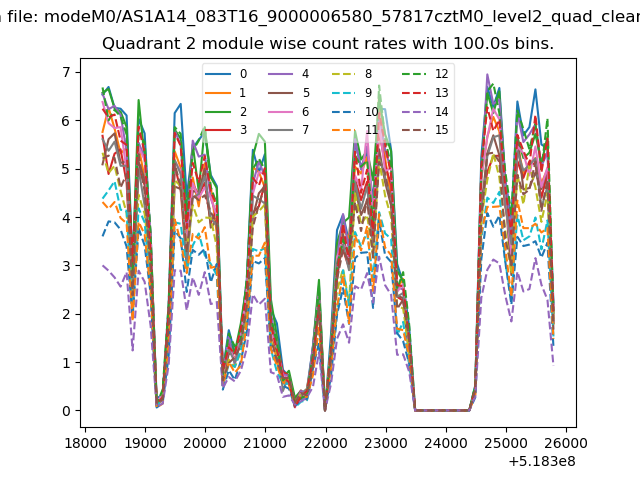
| Module-wise count rates for Quadrant B Data is divided into 100 sec bins |
 |
 |
| Module-wise count rates for Quadrant C Data is divided into 100 sec bins |
 |
 |
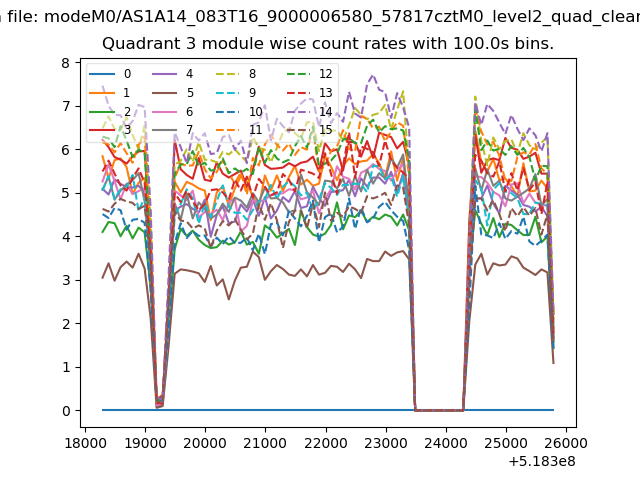
| Module-wise count rates for Quadrant D Data is divided into 100 sec bins |
 |
 |
| Parameter | Plot |
|---|---|
| CZT HV Monitor | 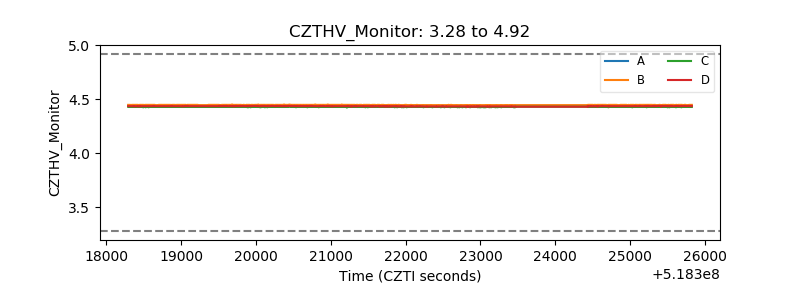 |
| D_VDD | 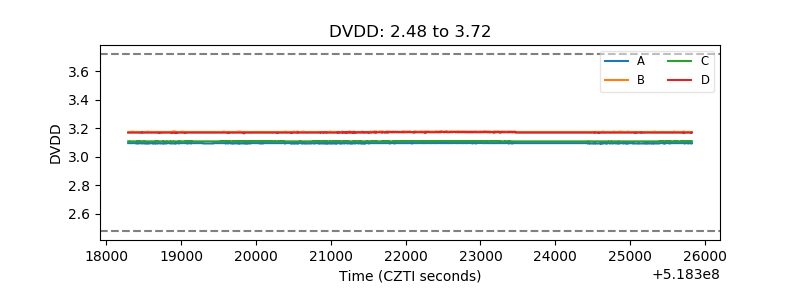 |
| Temperature 1 | 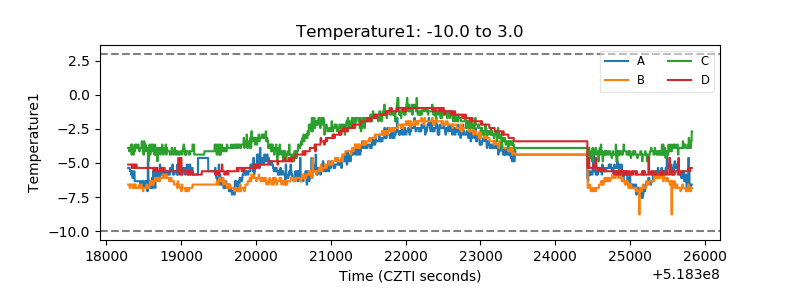 |
| Veto HV Monitor | 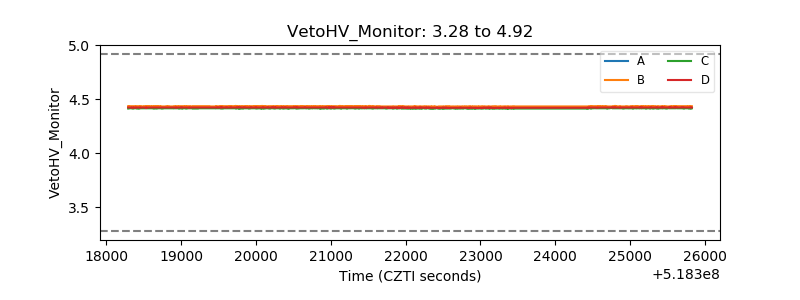 |
| Veto LLD | 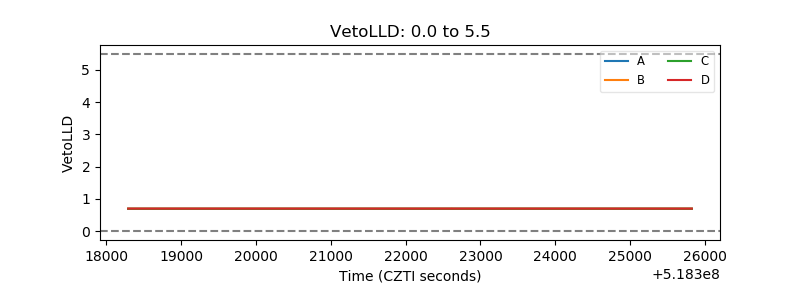 |
| Alpha Counter | 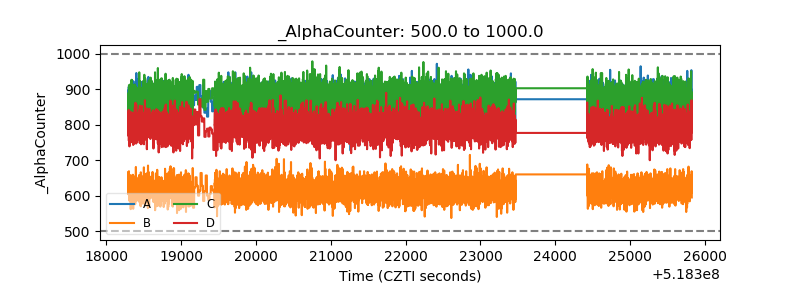 |
| _CPM_Rate | 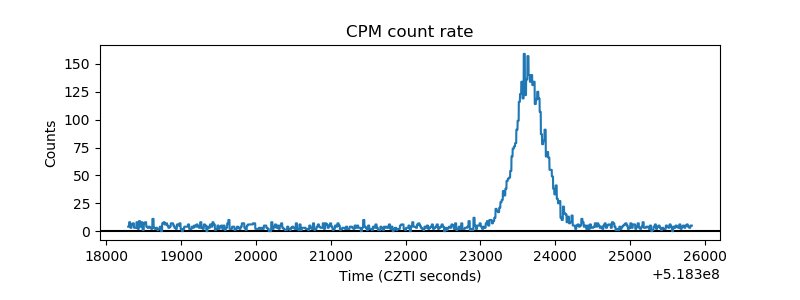 |
| CZT Counter | 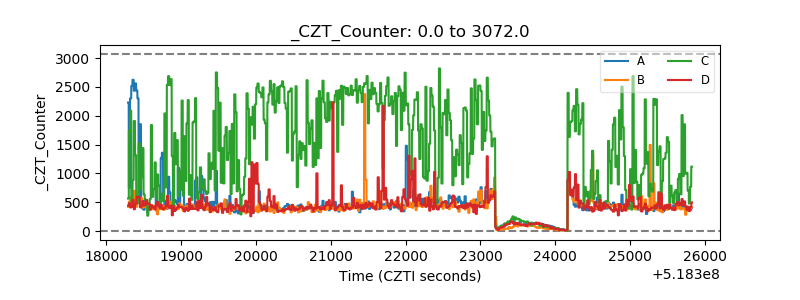 |
| +2.5 Volts monitor | 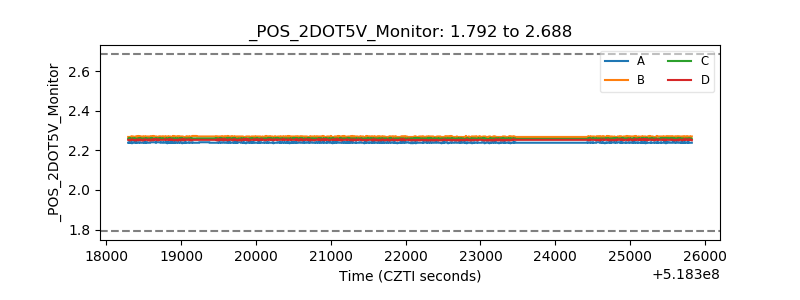 |
| +5 Volts monitor |  |
| _ROLL_ROT | 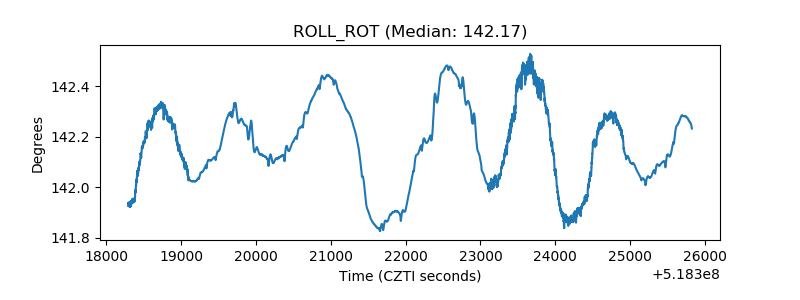 |
| _Roll_DEC | 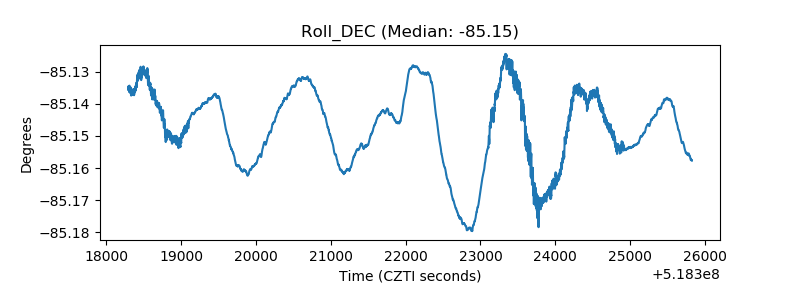 |
| _Roll_RA | 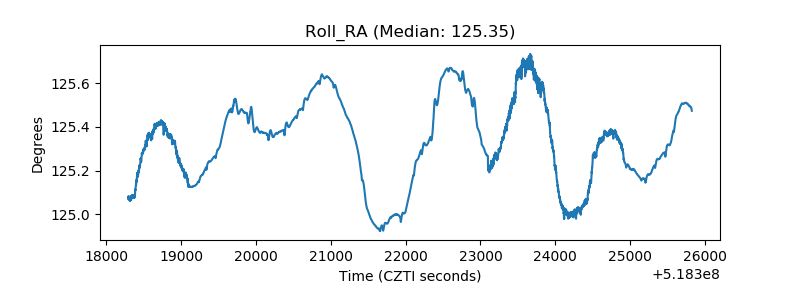 |
| Veto Counter | 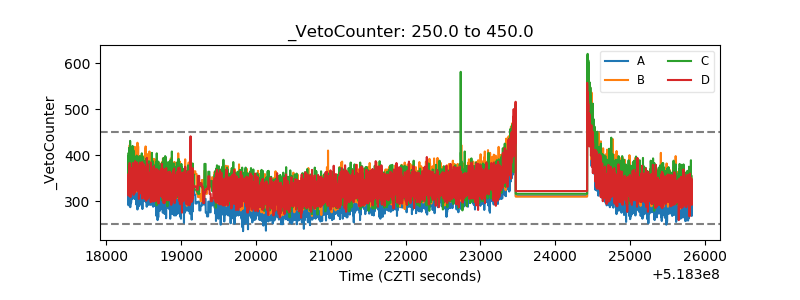 |