| Param | Original file | Final file |
|---|---|---|
| Filename | modeM0/AS1A14_083T16_9000006580_57818cztM0_level2.fits | modeM0/AS1A14_083T16_9000006580_57818cztM0_level2_quad_clean.evt |
| Size (bytes) | 469,566,720 | 97,824,960 |
| Size | 447.8 MB | 93.3 MB |
| Events in quadrant A | 3,215,061 | 651,360 |
| Events in quadrant B | 3,165,925 | 692,265 |
| Events in quadrant C | 6,238,372 | 561,344 |
| Events in quadrant D | 4,221,420 | 572,674 |
| Mode SS | |||
|---|---|---|---|
| Quadrant | BADHDUFLAG | Total packets | Discarded packets |
| A | 0 | 140 | 0 |
| B | 0 | 140 | 0 |
| C | 0 | 140 | 0 |
| D | 0 | 140 | 0 |
| Mode M0 | |||
|---|---|---|---|
| Quadrant | BADHDUFLAG | Total packets | Discarded packets |
| A | 0 | 14416 | 1 |
| B | 0 | 14671 | 1 |
| C | 0 | 23398 | 1 |
| D | 0 | 17606 | 2 |
| Mode M9 | |||
|---|---|---|---|
| Quadrant | BADHDUFLAG | Total packets | Discarded packets |
| A | 0 | 5 | 0 |
| B | 0 | 5 | 0 |
| C | 0 | 5 | 0 |
| D | 0 | 5 | 0 |
| Quadrant | Total seconds | Saturated seconds | Saturation percentage |
|---|---|---|---|
| A | 6955 | 134 | 1.926671% |
| B | 6956 | 210 | 3.018976% |
| C | 6956 | 930 | 13.369753% |
| D | 6955 | 261 | 3.752696% |
Noise dominated data is calculated using 1-second bins in cleaned event files. If a bin has >2000 counts, and if more than 50% of those come from <1% of pixels, then it is considered to be noise-dominated and hence unusable.
| Quadrant | # 1 sec bins | Bins with >0 counts | Bins with >2000 counts | High rate bins dominated by noise | Noise dominated (total time) | Noise dominated (detector-on time) | Marked lightcurve |
|---|---|---|---|---|---|---|---|
| A | 7410 | 6956 | 1 | 1 | 0.01% | 0.01% | 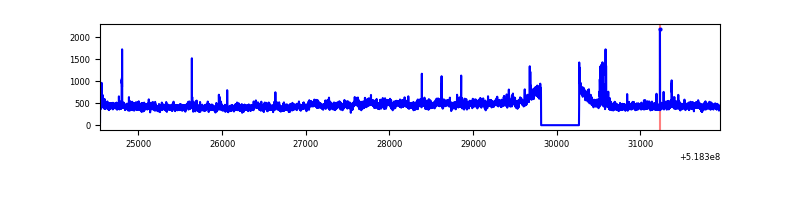 |
| B | 7411 | 6957 | 14 | 14 | 0.19% | 0.20% | 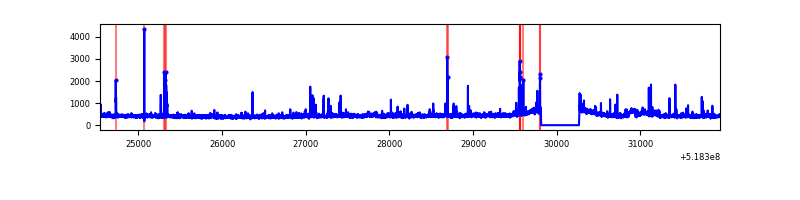 |
| C | 7411 | 6957 | 671 | 671 | 9.05% | 9.64% | 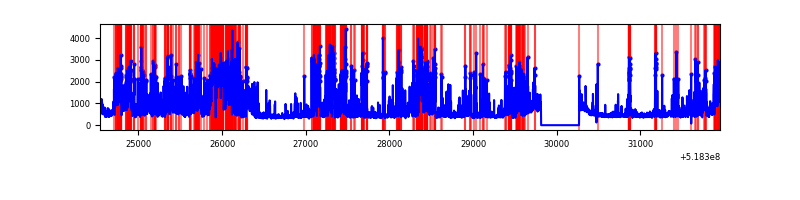 |
| D | 7410 | 6956 | 150 | 150 | 2.02% | 2.16% | 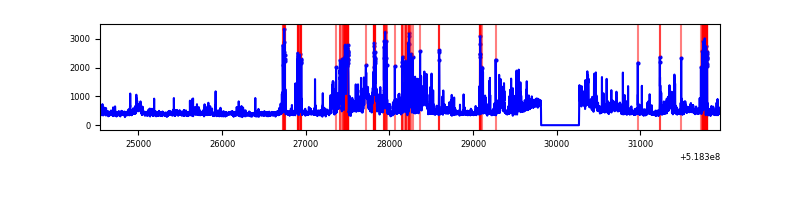 |
Top three noisy pixels from each quadrant. If the there are fewer than three noisy pixels in the level2.evt file, extra rows are filled as -1
| Pixel properties | Quadrant properties | ||||||
|---|---|---|---|---|---|---|---|
| Quadrant | DetID | PixID | Counts | Sigma | Mean | Median | Sigma |
| A | 3 | 128 | 201339 | 1092.19 | 739 | 720 | 183.7 |
| A | 3 | 14 | 128223 | 694.14 | 739 | 720 | 183.7 |
| A | 7 | 64 | 11912 | 60.93 | 739 | 720 | 183.7 |
| B | 7 | 252 | 78611 | 502.18 | 730 | 701 | 155.1 |
| B | 5 | 172 | 47836 | 303.82 | 730 | 701 | 155.1 |
| B | 10 | 247 | 34050 | 214.96 | 730 | 701 | 155.1 |
| C | 15 | 224 | 1937588 | 10408.54 | 692 | 683 | 186.1 |
| C | 9 | 38 | 1203908 | 6465.89 | 692 | 683 | 186.1 |
| C | 14 | 254 | 130650 | 698.42 | 692 | 683 | 186.1 |
| D | 12 | 110 | 685663 | 3437.53 | 713 | 681 | 199.3 |
| D | 2 | 249 | 214697 | 1074.02 | 713 | 681 | 199.3 |
| D | 3 | 224 | 138264 | 690.45 | 713 | 681 | 199.3 |
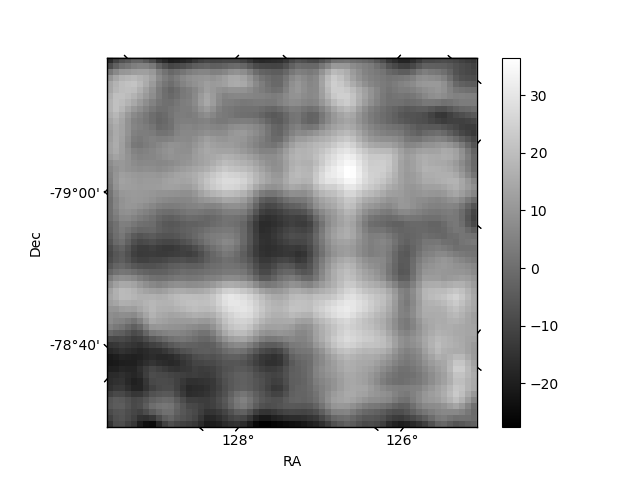
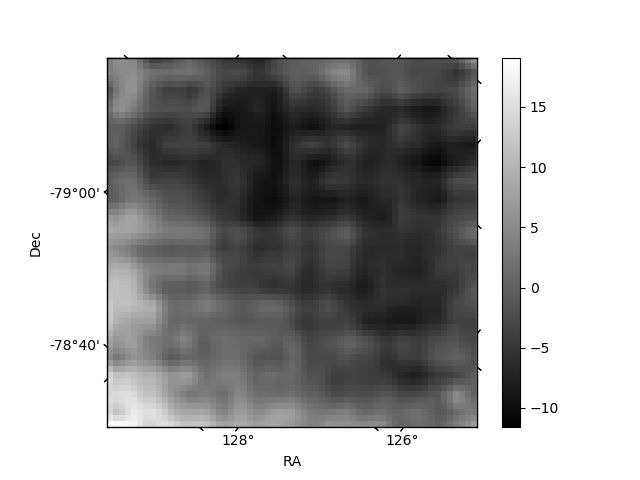
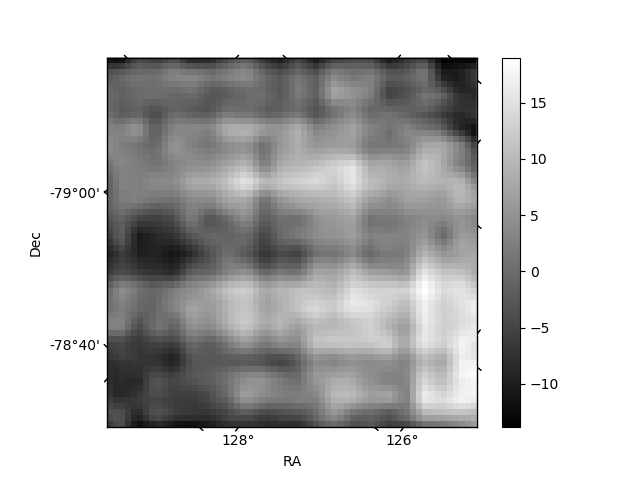
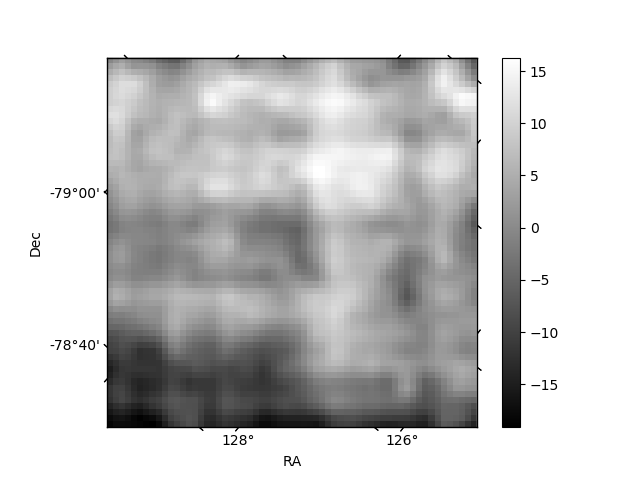
Histogram calculated using DETX and DETY for each event in the final _common_clean file
| Quadrant A | 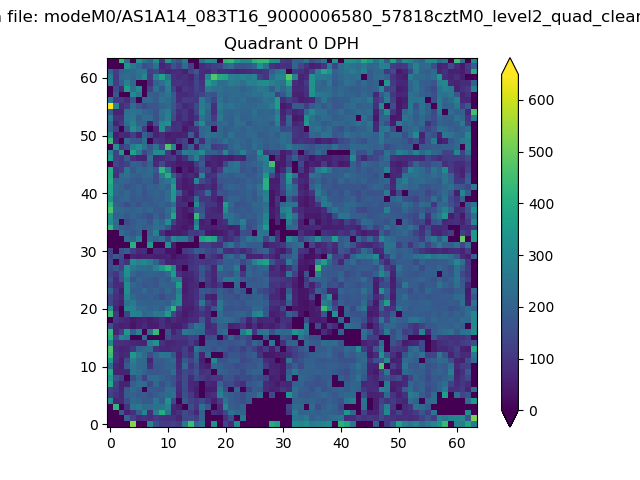 |
 |
Quadrant B |
|---|---|---|---|
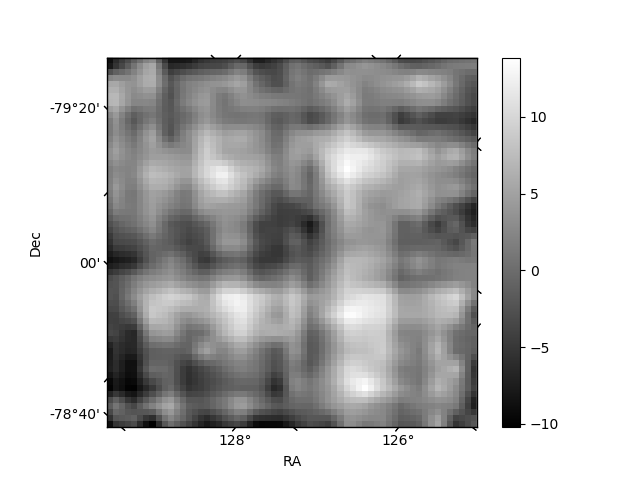
| Quadrant D | 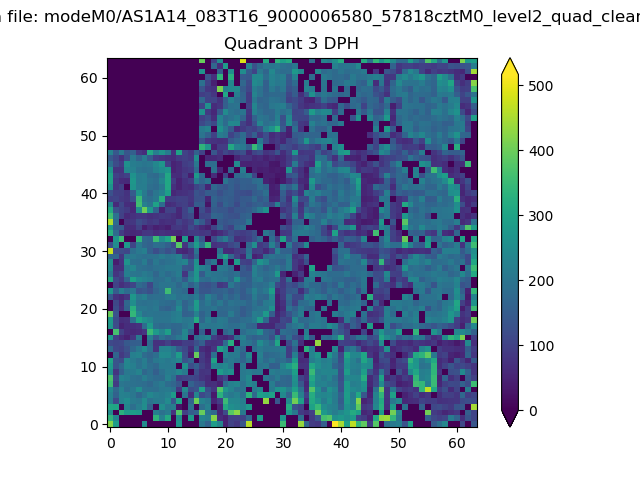 |
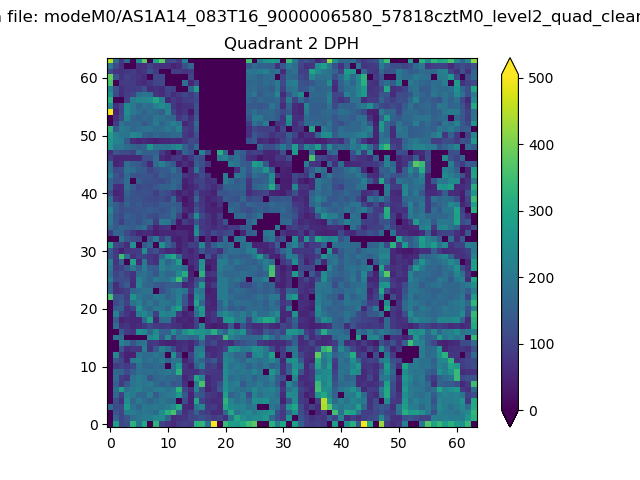 |
Quadrant C |
| Plot type | Count rate plots | Images |
|---|---|---|
| Comparison with Poisson distribution Blue bars denote a histogram of data divided into 1 sec bins. Red curve is a Poisson curve with rate = median count rate of data. |
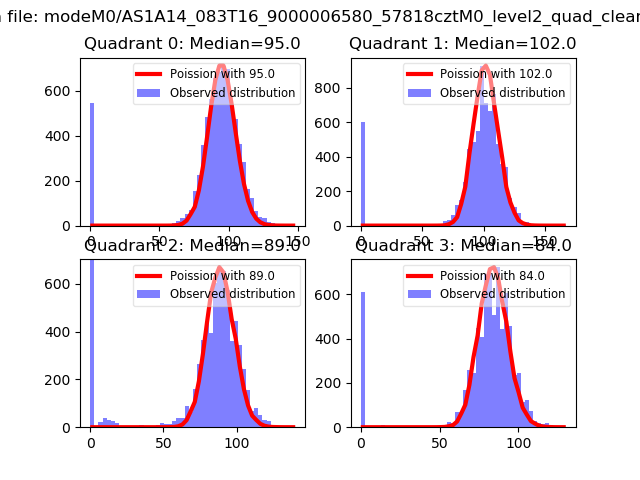 |
 |
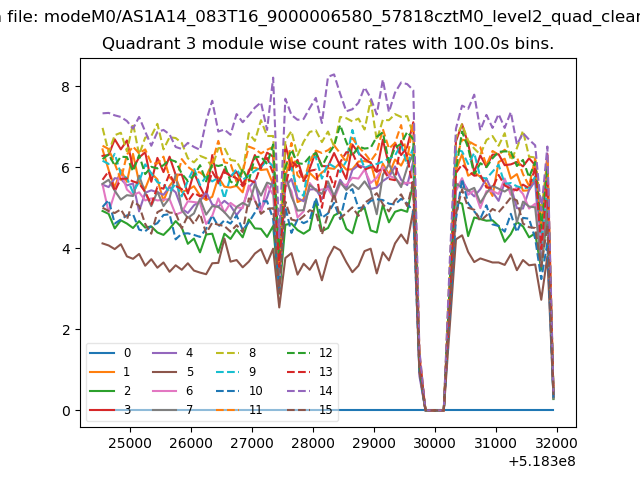
| Quadrant-wise count rates Data is divided into 100 sec bins |
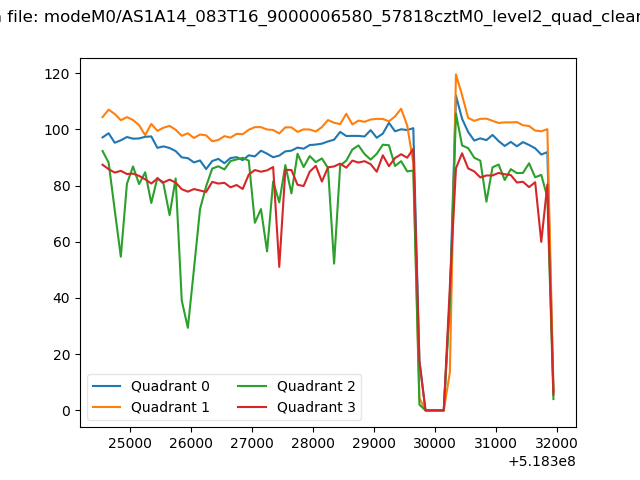 |
|
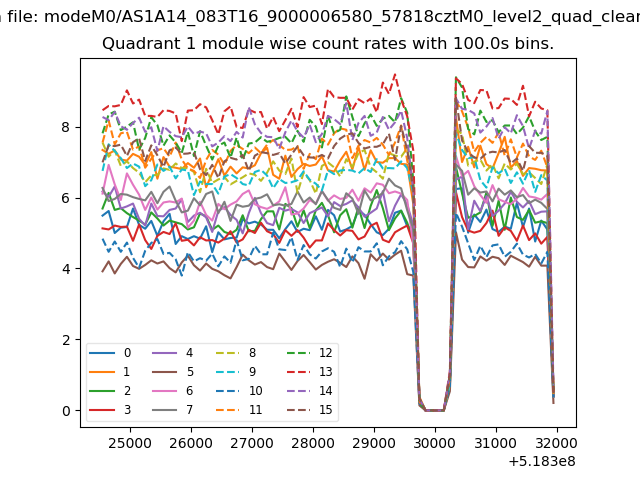
| Module-wise count rates for Quadrant A Data is divided into 100 sec bins |
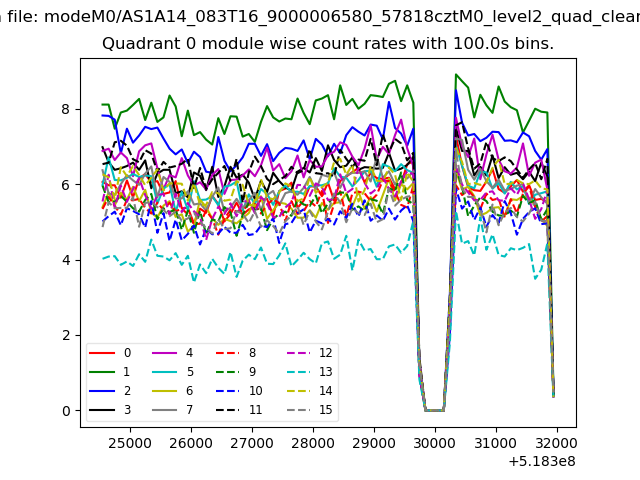 |
 |
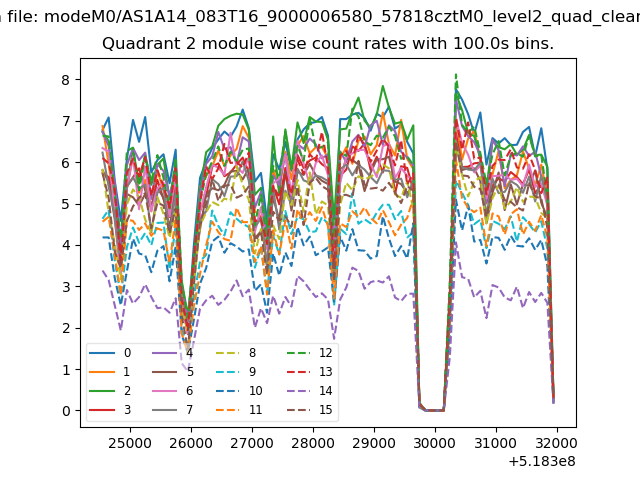
| Module-wise count rates for Quadrant B Data is divided into 100 sec bins |
 |
 |
| Module-wise count rates for Quadrant C Data is divided into 100 sec bins |
 |
 |
| Module-wise count rates for Quadrant D Data is divided into 100 sec bins |
 |
 |
| Parameter | Plot |
|---|---|
| CZT HV Monitor | 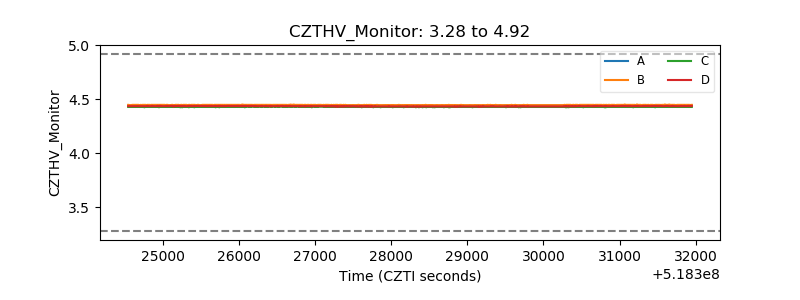 |
| D_VDD | 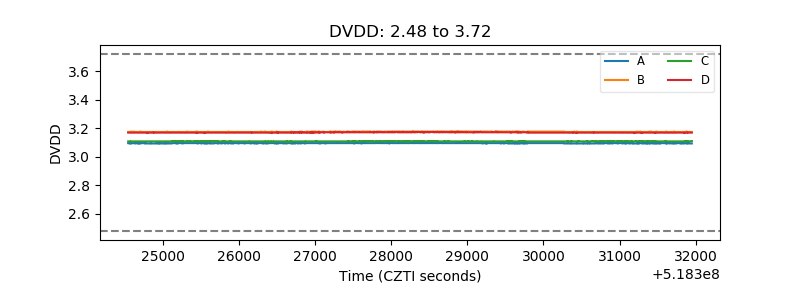 |
| Temperature 1 | 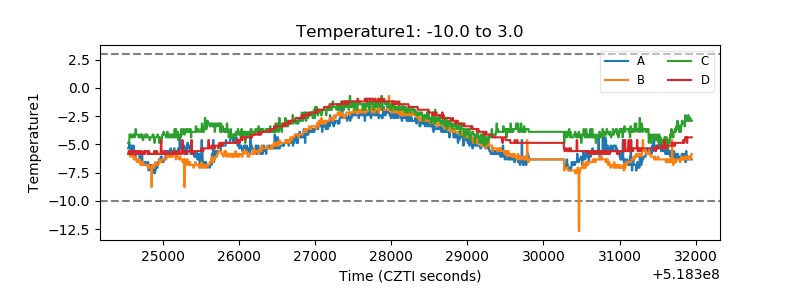 |
| Veto HV Monitor | 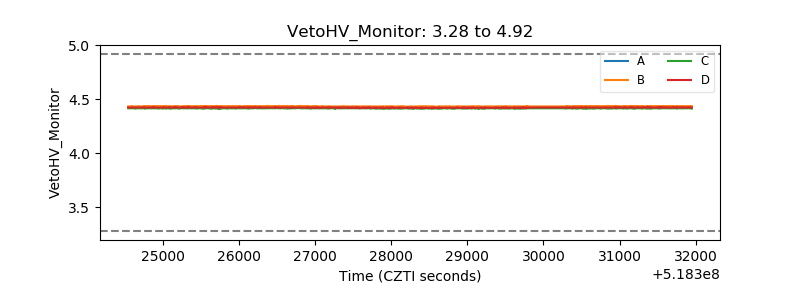 |
| Veto LLD | 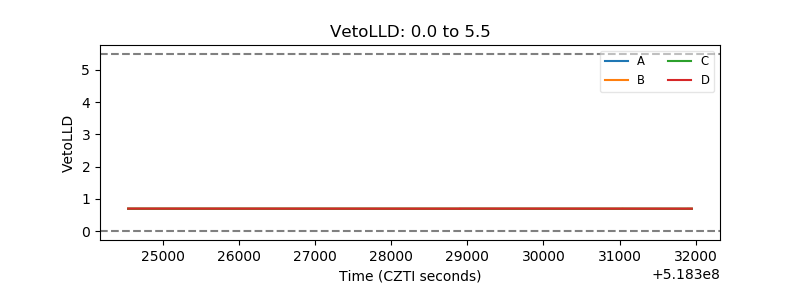 |
| Alpha Counter | 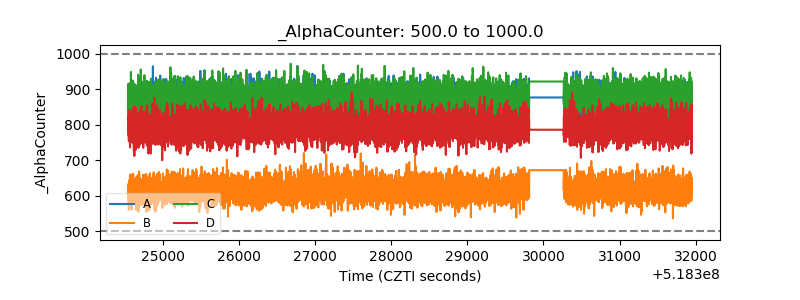 |
| _CPM_Rate | 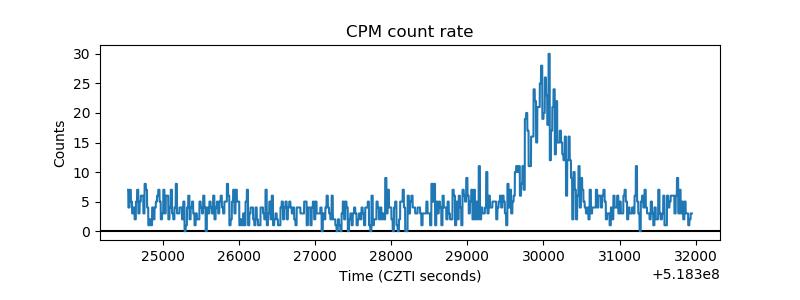 |
| CZT Counter | 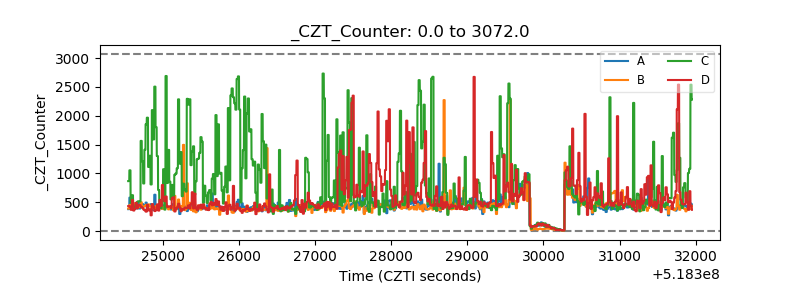 |
| +2.5 Volts monitor | 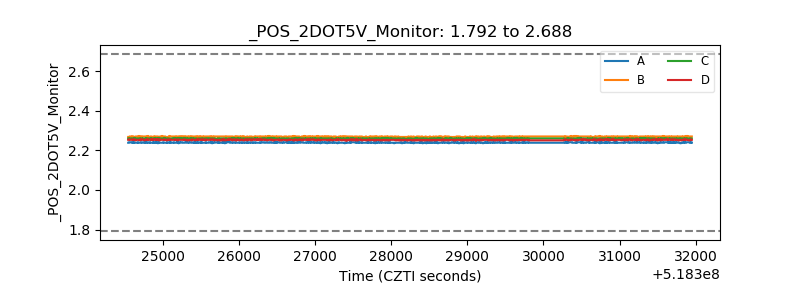 |
| +5 Volts monitor |  |
| _ROLL_ROT | 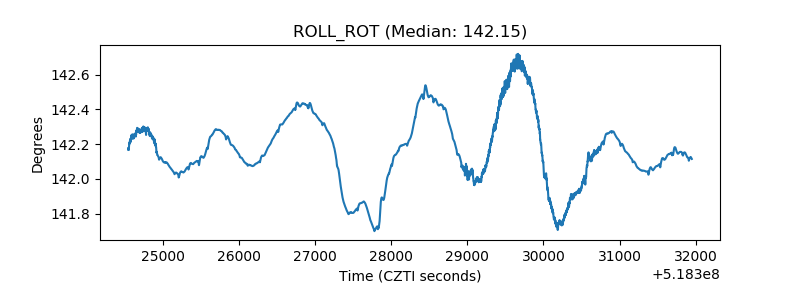 |
| _Roll_DEC | 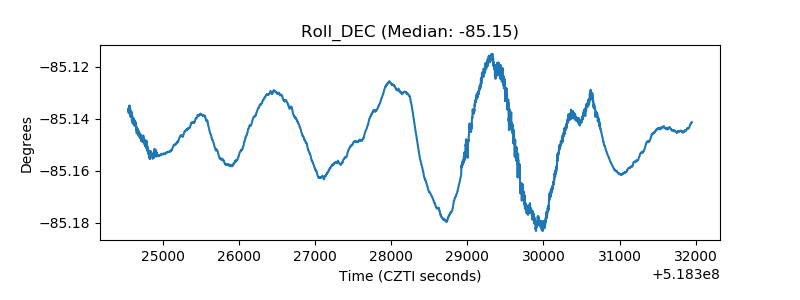 |
| _Roll_RA | 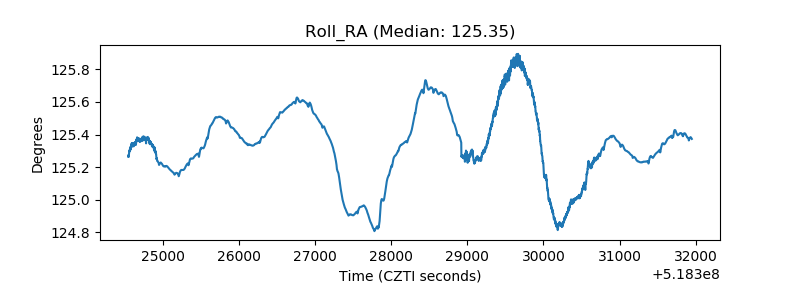 |
| Veto Counter | 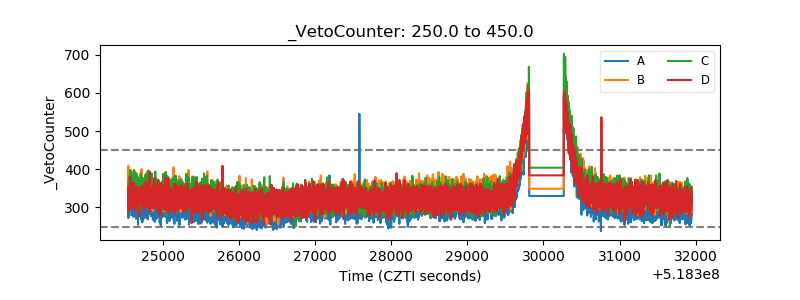 |