| Param | Original file | Final file |
|---|---|---|
| Filename | modeM0/AS1A14_083T16_9000006580_57819cztM0_level2.fits | modeM0/AS1A14_083T16_9000006580_57819cztM0_level2_quad_clean.evt |
| Size (bytes) | 572,713,920 | 99,599,040 |
| Size | 546.2 MB | 95.0 MB |
| Events in quadrant A | 3,419,116 | 672,159 |
| Events in quadrant B | 3,194,161 | 717,299 |
| Events in quadrant C | 8,001,548 | 543,530 |
| Events in quadrant D | 6,031,081 | 585,625 |
| Mode SS | |||
|---|---|---|---|
| Quadrant | BADHDUFLAG | Total packets | Discarded packets |
| A | 0 | 142 | 0 |
| B | 0 | 142 | 0 |
| C | 0 | 142 | 0 |
| D | 0 | 142 | 0 |
| Mode M0 | |||
|---|---|---|---|
| Quadrant | BADHDUFLAG | Total packets | Discarded packets |
| A | 0 | 15207 | 0 |
| B | 0 | 14958 | 0 |
| C | 0 | 28747 | 0 |
| D | 0 | 22866 | 0 |
| Quadrant | Total seconds | Saturated seconds | Saturation percentage |
|---|---|---|---|
| A | 7141 | 65 | 0.910237% |
| B | 7141 | 152 | 2.128553% |
| C | 7141 | 1347 | 18.862904% |
| D | 7141 | 302 | 4.229100% |
Noise dominated data is calculated using 1-second bins in cleaned event files. If a bin has >2000 counts, and if more than 50% of those come from <1% of pixels, then it is considered to be noise-dominated and hence unusable.
| Quadrant | # 1 sec bins | Bins with >0 counts | Bins with >2000 counts | High rate bins dominated by noise | Noise dominated (total time) | Noise dominated (detector-on time) | Marked lightcurve |
|---|---|---|---|---|---|---|---|
| A | 7141 | 7141 | 12 | 12 | 0.17% | 0.17% |  |
| B | 7141 | 7141 | 5 | 5 | 0.07% | 0.07% |  |
| C | 7140 | 7140 | 1249 | 1249 | 17.49% | 17.49% | 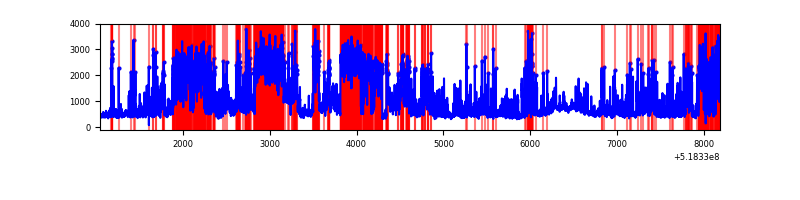 |
| D | 7141 | 7141 | 311 | 311 | 4.36% | 4.36% | 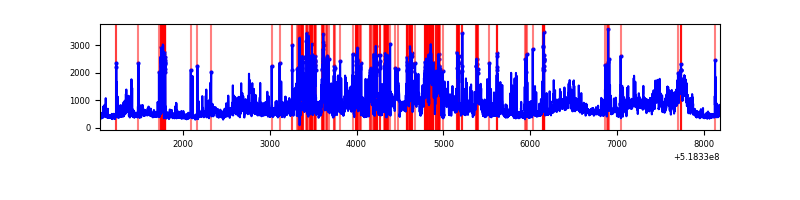 |
Top three noisy pixels from each quadrant. If the there are fewer than three noisy pixels in the level2.evt file, extra rows are filled as -1
| Pixel properties | Quadrant properties | ||||||
|---|---|---|---|---|---|---|---|
| Quadrant | DetID | PixID | Counts | Sigma | Mean | Median | Sigma |
| A | 3 | 14 | 200319 | 1065.29 | 757 | 737 | 187.4 |
| A | 3 | 128 | 190112 | 1010.81 | 757 | 737 | 187.4 |
| A | 7 | 64 | 83785 | 443.28 | 757 | 737 | 187.4 |
| B | 7 | 252 | 59244 | 365.14 | 752 | 721 | 160.3 |
| B | 10 | 247 | 28475 | 173.16 | 752 | 721 | 160.3 |
| B | 5 | 172 | 20387 | 122.7 | 752 | 721 | 160.3 |
| C | 5 | 80 | 2101330 | 11241.64 | 694 | 686 | 186.9 |
| C | 9 | 38 | 1906680 | 10199.96 | 694 | 686 | 186.9 |
| C | 15 | 224 | 975640 | 5217.48 | 694 | 686 | 186.9 |
| D | 12 | 110 | 2239680 | 11006.19 | 727 | 694 | 203.4 |
| D | 2 | 249 | 350791 | 1720.97 | 727 | 694 | 203.4 |
| D | 3 | 12 | 264727 | 1297.91 | 727 | 694 | 203.4 |
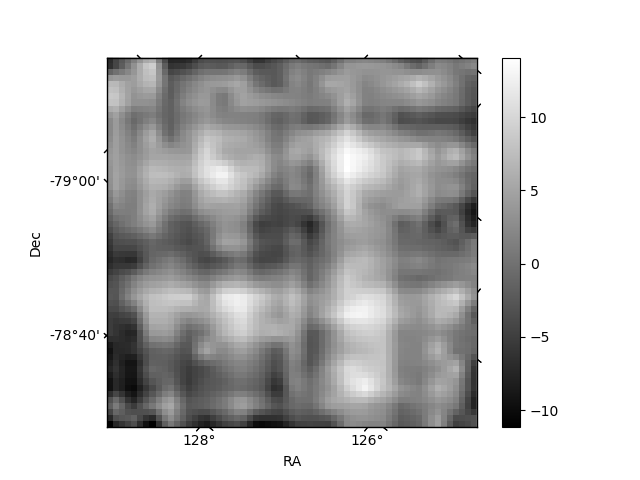
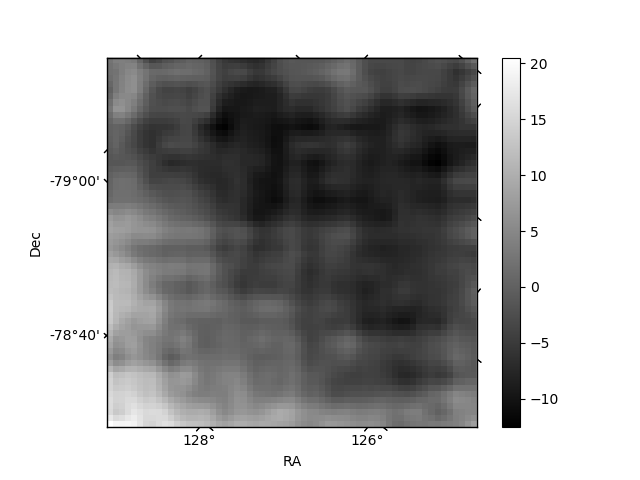
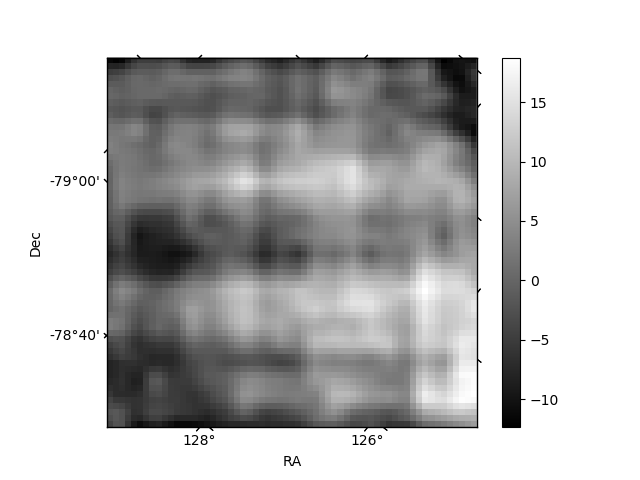
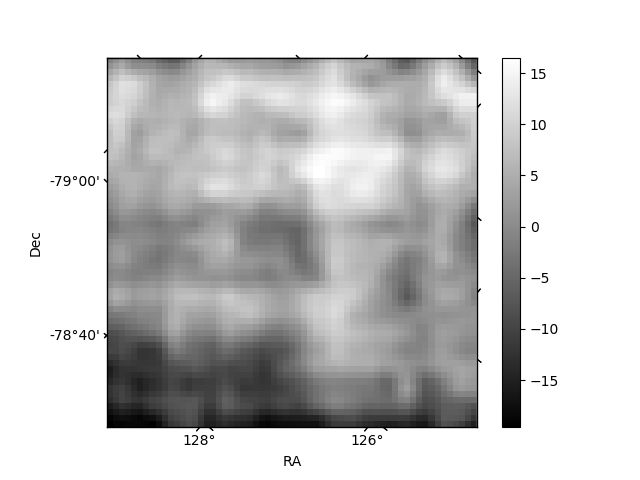
Histogram calculated using DETX and DETY for each event in the final _common_clean file
| Quadrant A | 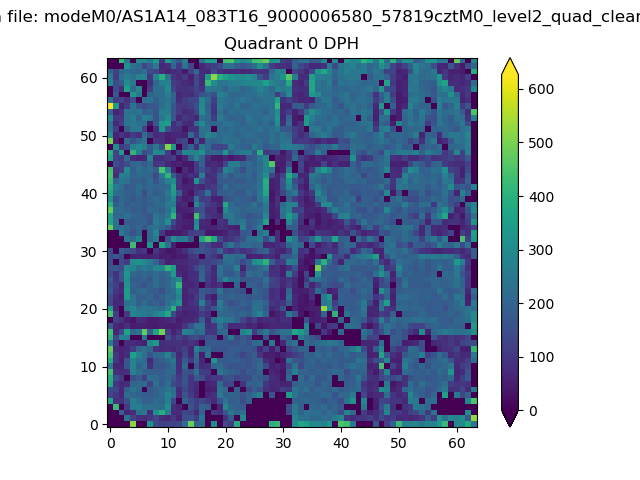 |
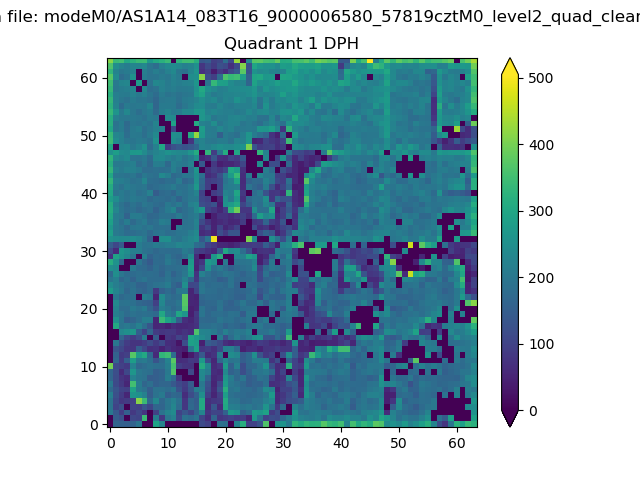 |
Quadrant B |
|---|---|---|---|
| Quadrant D | 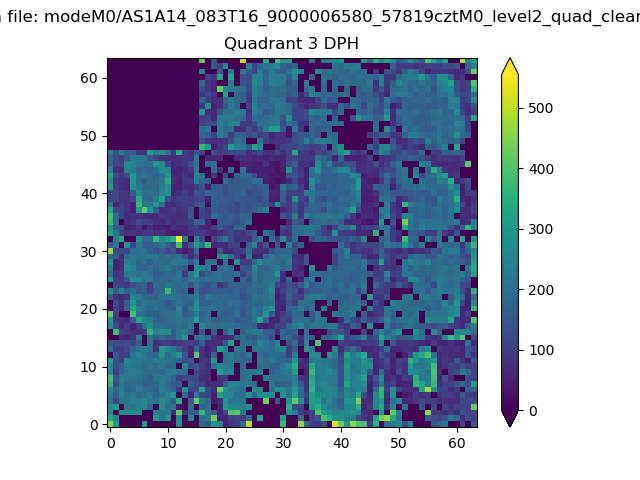 |
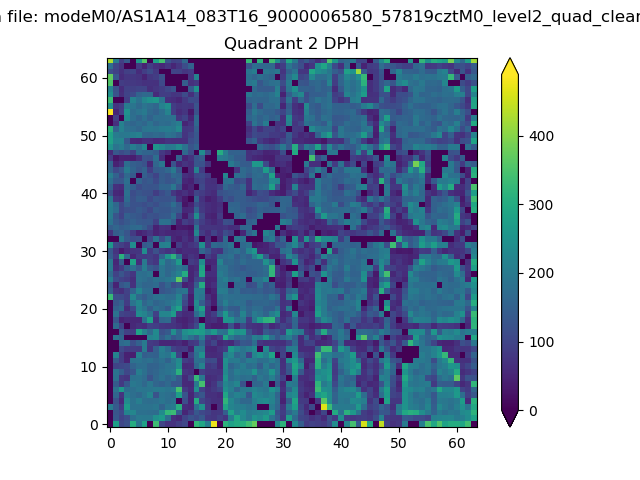 |
Quadrant C |
| Plot type | Count rate plots | Images |
|---|---|---|
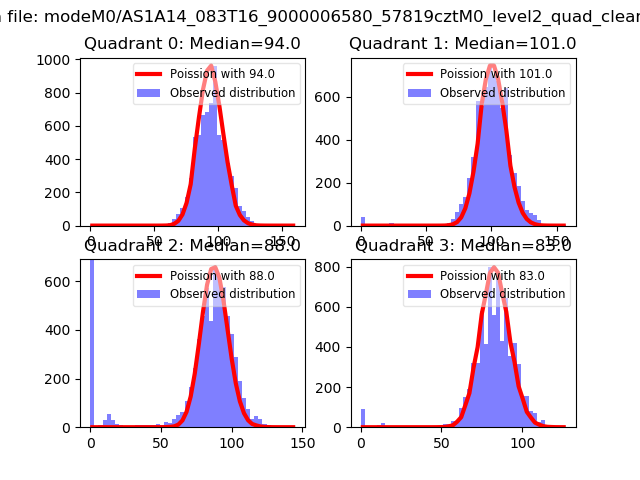
| Comparison with Poisson distribution Blue bars denote a histogram of data divided into 1 sec bins. Red curve is a Poisson curve with rate = median count rate of data. |
 |
 |
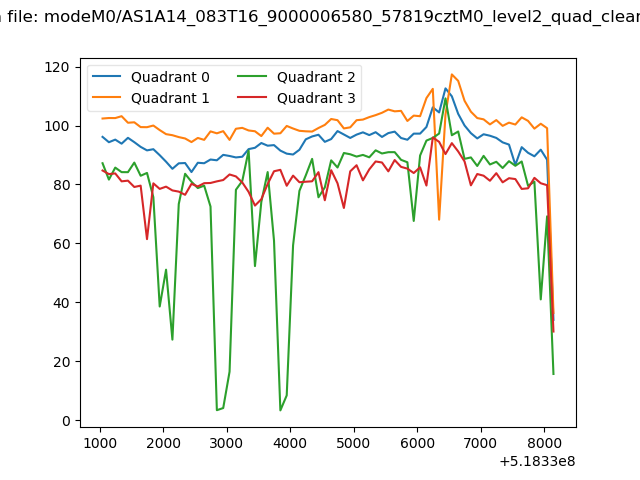
| Quadrant-wise count rates Data is divided into 100 sec bins |
 |
|
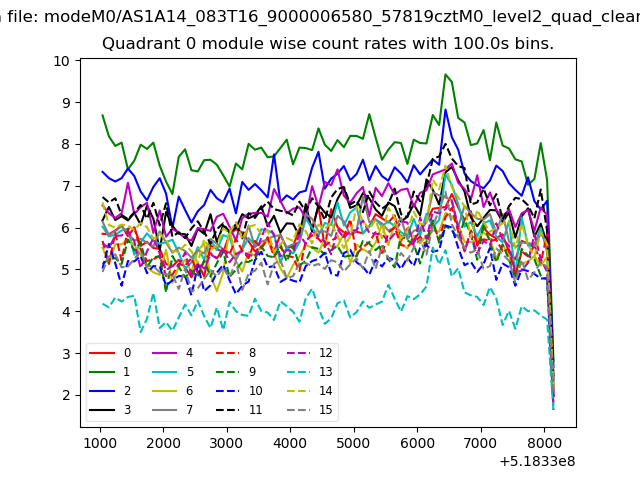
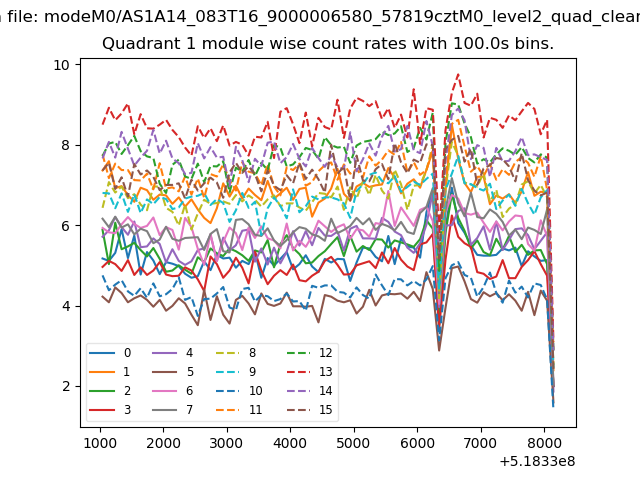
| Module-wise count rates for Quadrant A Data is divided into 100 sec bins |
 |
 |
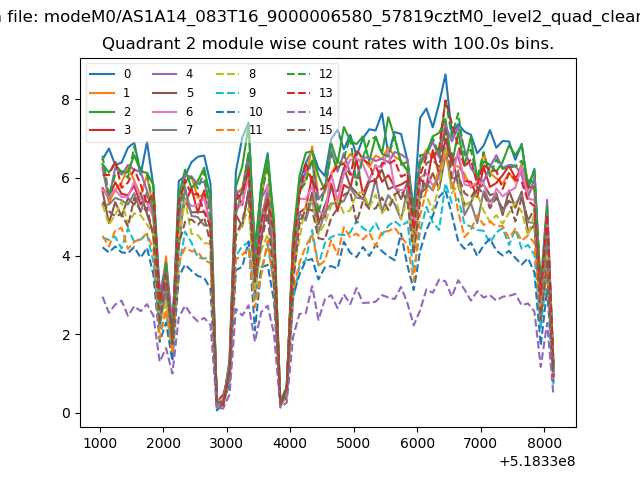
| Module-wise count rates for Quadrant B Data is divided into 100 sec bins |
 |
 |
| Module-wise count rates for Quadrant C Data is divided into 100 sec bins |
 |
 |
| Module-wise count rates for Quadrant D Data is divided into 100 sec bins |
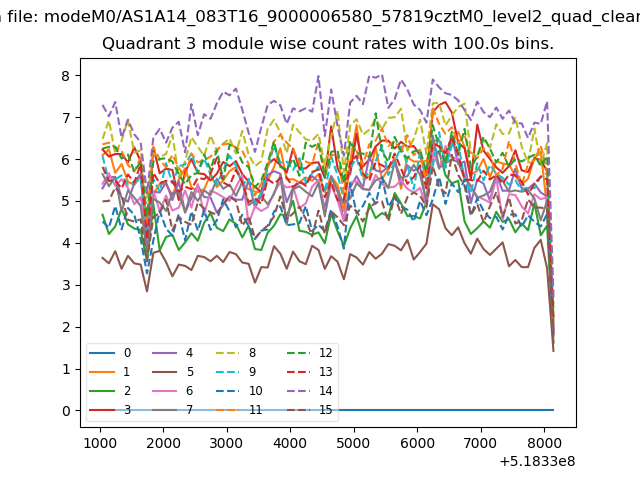 |
 |
| Parameter | Plot |
|---|---|
| CZT HV Monitor | 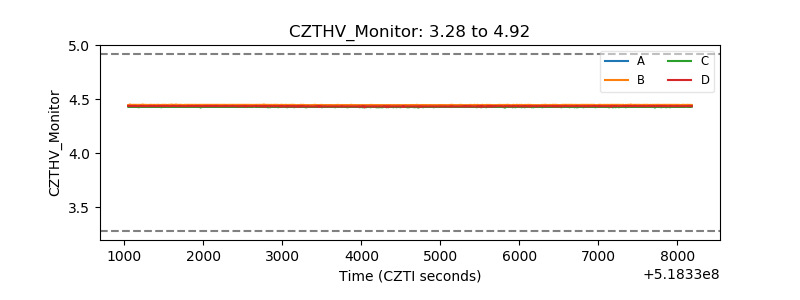 |
| D_VDD | 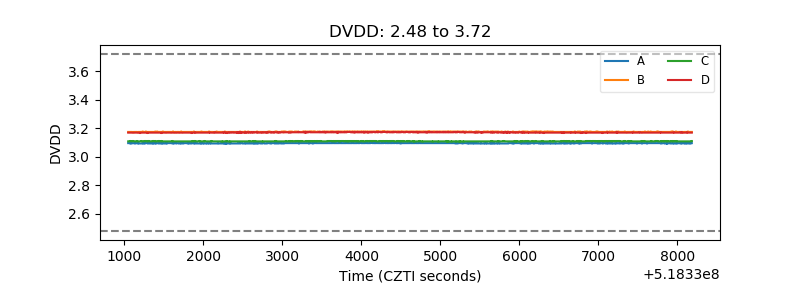 |
| Temperature 1 | 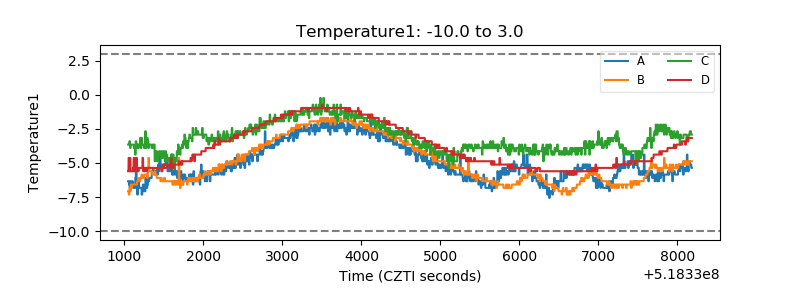 |
| Veto HV Monitor |  |
| Veto LLD | 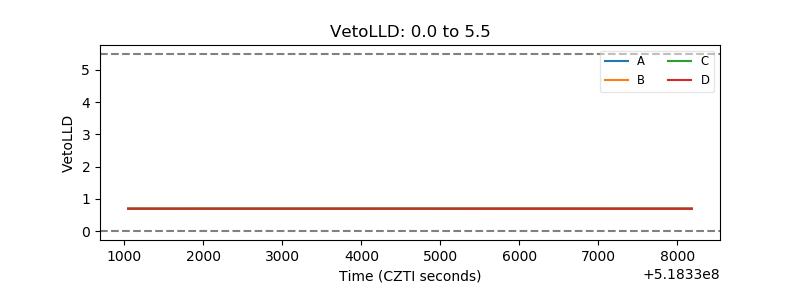 |
| Alpha Counter | 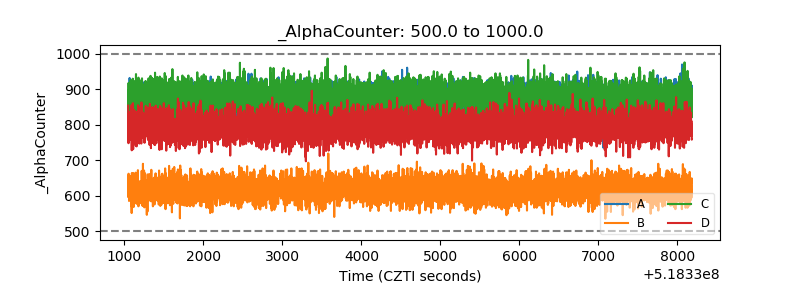 |
| _CPM_Rate | 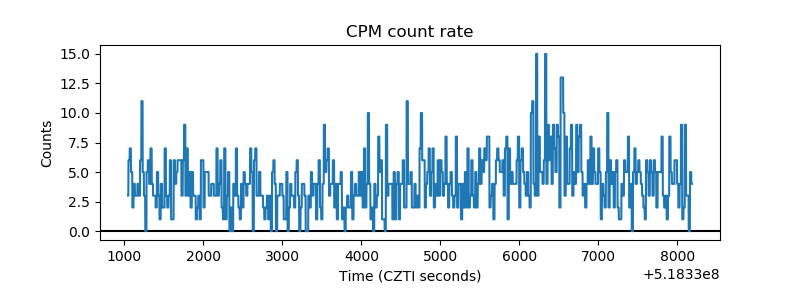 |
| CZT Counter | 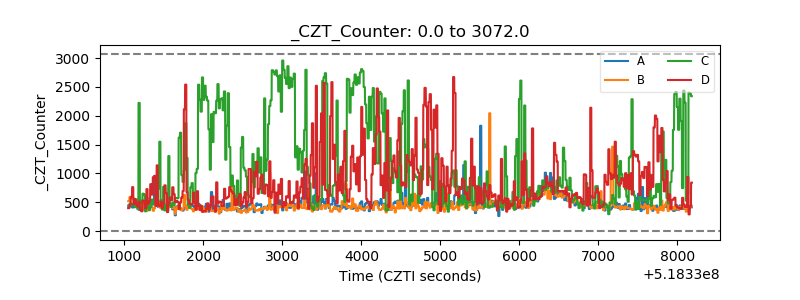 |
| +2.5 Volts monitor | 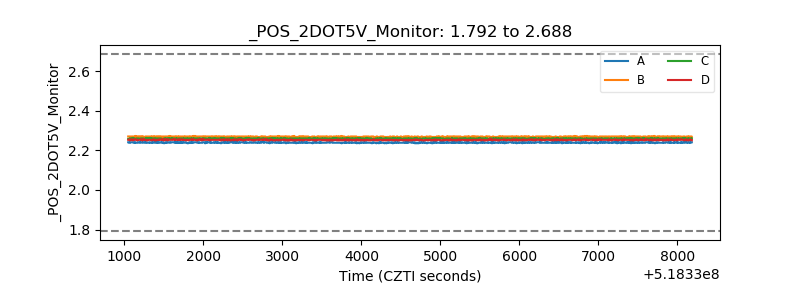 |
| +5 Volts monitor |  |
| _ROLL_ROT | 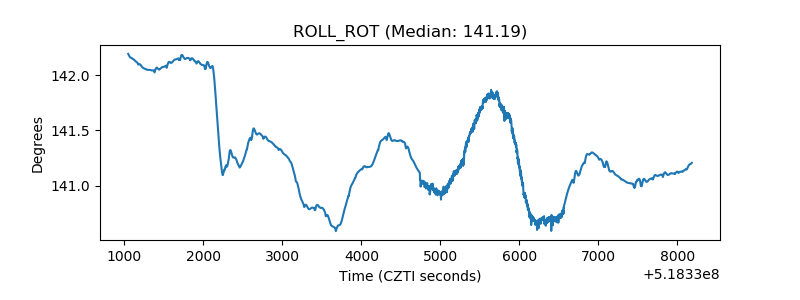 |
| _Roll_DEC | 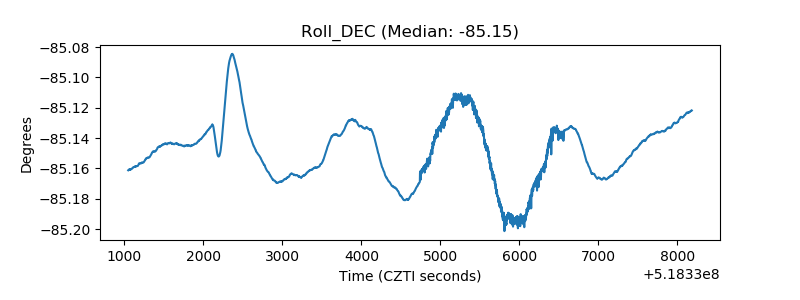 |
| _Roll_RA | 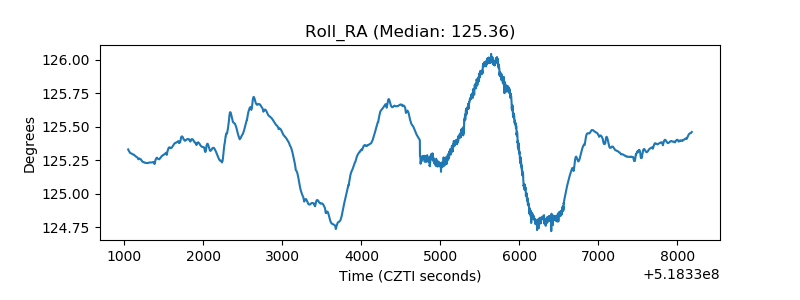 |
| Veto Counter | 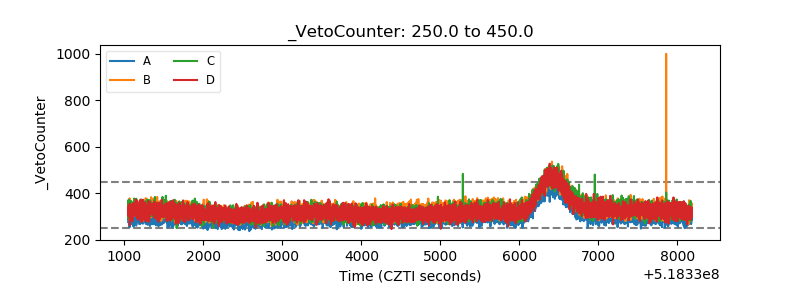 |