| Param | Original file | Final file |
|---|---|---|
| Filename | modeM0/AS1A14_083T16_9000006580_57820cztM0_level2.fits | modeM0/AS1A14_083T16_9000006580_57820cztM0_level2_quad_clean.evt |
| Size (bytes) | 500,477,760 | 108,002,880 |
| Size | 477.3 MB | 103.0 MB |
| Events in quadrant A | 3,310,456 | 714,602 |
| Events in quadrant B | 3,422,869 | 764,511 |
| Events in quadrant C | 6,542,377 | 624,181 |
| Events in quadrant D | 4,658,405 | 636,672 |
| Mode SS | |||
|---|---|---|---|
| Quadrant | BADHDUFLAG | Total packets | Discarded packets |
| A | 0 | 152 | 0 |
| B | 0 | 152 | 0 |
| C | 0 | 152 | 0 |
| D | 0 | 152 | 0 |
| Mode M0 | |||
|---|---|---|---|
| Quadrant | BADHDUFLAG | Total packets | Discarded packets |
| A | 0 | 15611 | 0 |
| B | 0 | 15946 | 0 |
| C | 0 | 24842 | 0 |
| D | 0 | 19120 | 0 |
| Quadrant | Total seconds | Saturated seconds | Saturation percentage |
|---|---|---|---|
| A | 7620 | 19 | 0.249344% |
| B | 7620 | 52 | 0.682415% |
| C | 7620 | 816 | 10.708661% |
| D | 7621 | 81 | 1.062853% |
Noise dominated data is calculated using 1-second bins in cleaned event files. If a bin has >2000 counts, and if more than 50% of those come from <1% of pixels, then it is considered to be noise-dominated and hence unusable.
| Quadrant | # 1 sec bins | Bins with >0 counts | Bins with >2000 counts | High rate bins dominated by noise | Noise dominated (total time) | Noise dominated (detector-on time) | Marked lightcurve |
|---|---|---|---|---|---|---|---|
| A | 7620 | 7620 | 11 | 11 | 0.14% | 0.14% | 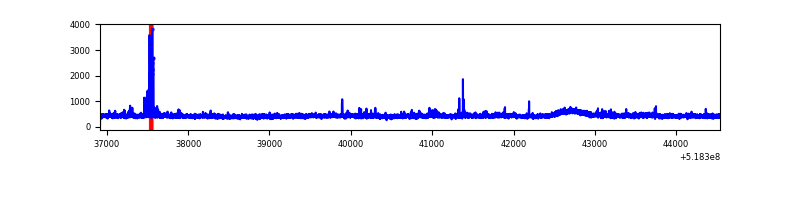 |
| B | 7620 | 7620 | 8 | 8 | 0.10% | 0.10% | 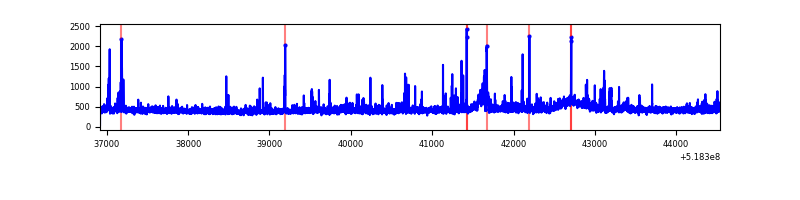 |
| C | 7620 | 7620 | 660 | 660 | 8.66% | 8.66% | 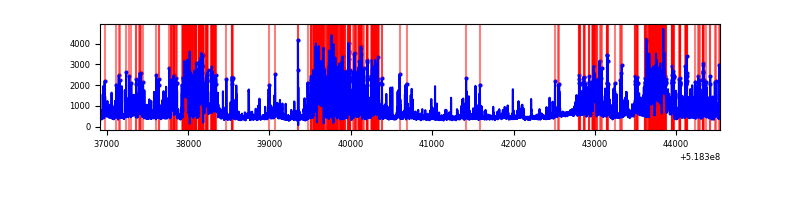 |
| D | 7621 | 7621 | 71 | 71 | 0.93% | 0.93% | 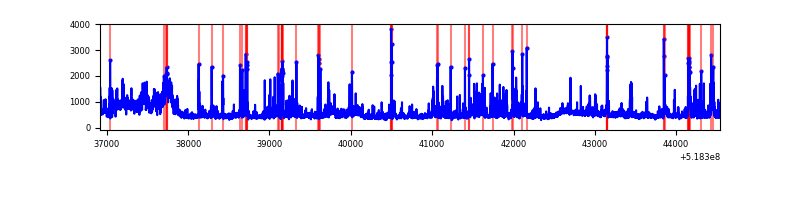 |
Top three noisy pixels from each quadrant. If the there are fewer than three noisy pixels in the level2.evt file, extra rows are filled as -1
| Pixel properties | Quadrant properties | ||||||
|---|---|---|---|---|---|---|---|
| Quadrant | DetID | PixID | Counts | Sigma | Mean | Median | Sigma |
| A | 3 | 14 | 119319 | 596.95 | 799 | 779 | 198.6 |
| A | 7 | 64 | 64340 | 320.09 | 799 | 779 | 198.6 |
| A | 3 | 128 | 27956 | 136.86 | 799 | 779 | 198.6 |
| B | 4 | 142 | 63994 | 371.64 | 794 | 762 | 170.1 |
| B | 7 | 252 | 59463 | 345.01 | 794 | 762 | 170.1 |
| B | 10 | 247 | 36577 | 210.5 | 794 | 762 | 170.1 |
| C | 15 | 224 | 1623810 | 7924.37 | 754 | 745 | 204.8 |
| C | 9 | 38 | 1547602 | 7552.3 | 754 | 745 | 204.8 |
| C | 14 | 254 | 298598 | 1454.22 | 754 | 745 | 204.8 |
| D | 12 | 110 | 713610 | 3282.31 | 775 | 742 | 217.2 |
| D | 3 | 12 | 320757 | 1473.47 | 775 | 742 | 217.2 |
| D | 2 | 249 | 142785 | 654.02 | 775 | 742 | 217.2 |
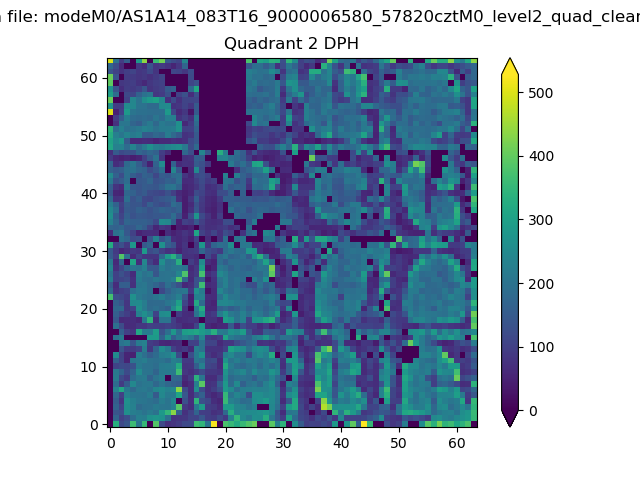
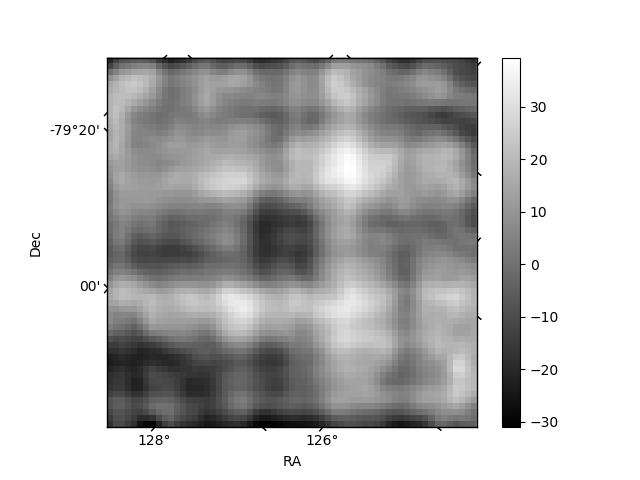
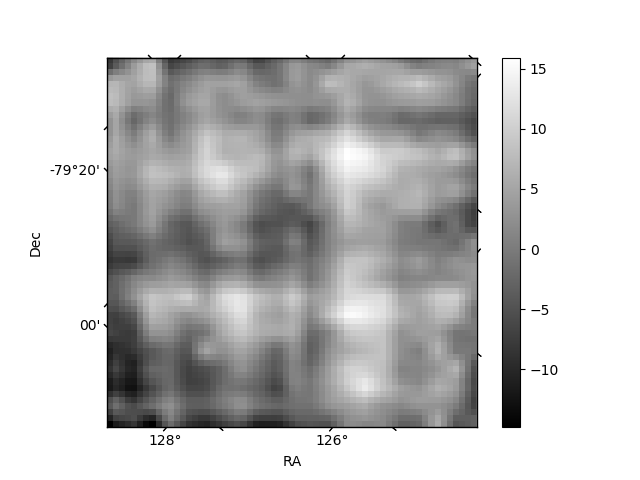
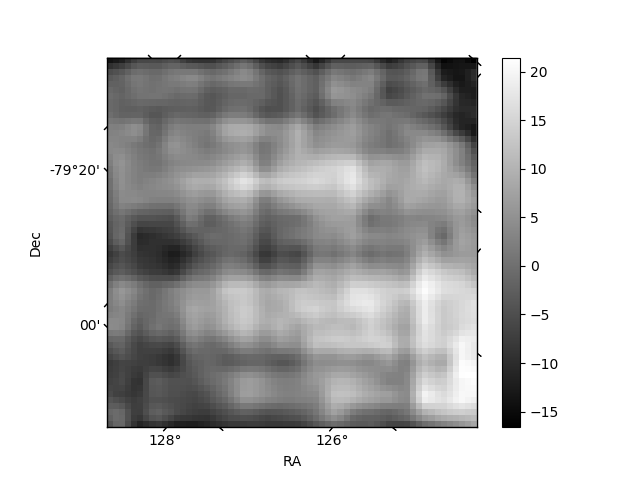
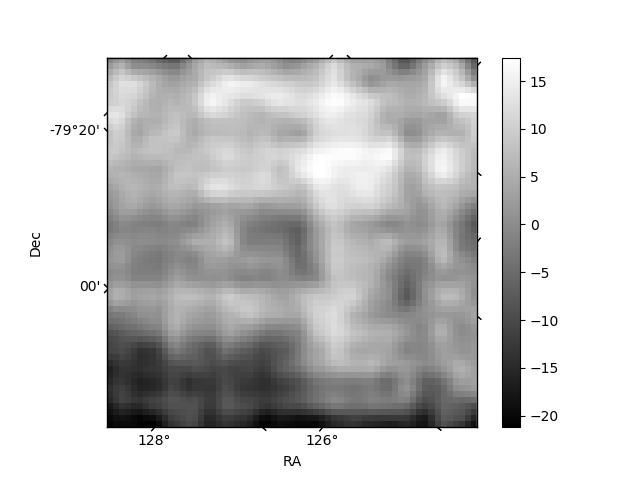
Histogram calculated using DETX and DETY for each event in the final _common_clean file
| Quadrant A | 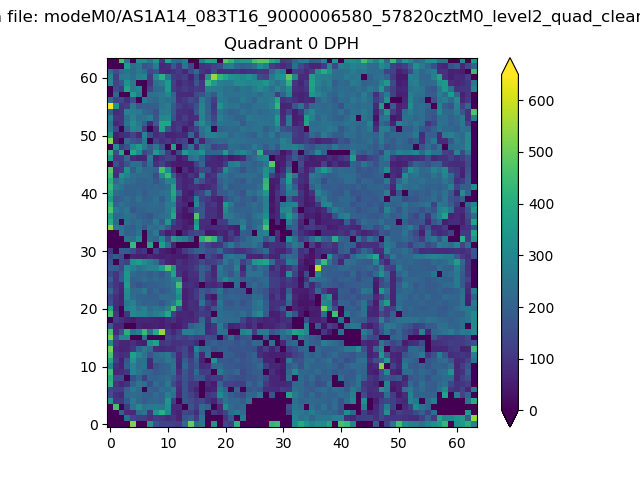 |
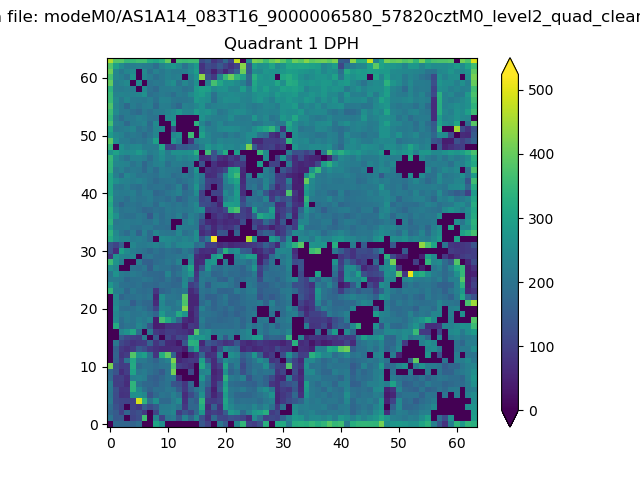 |
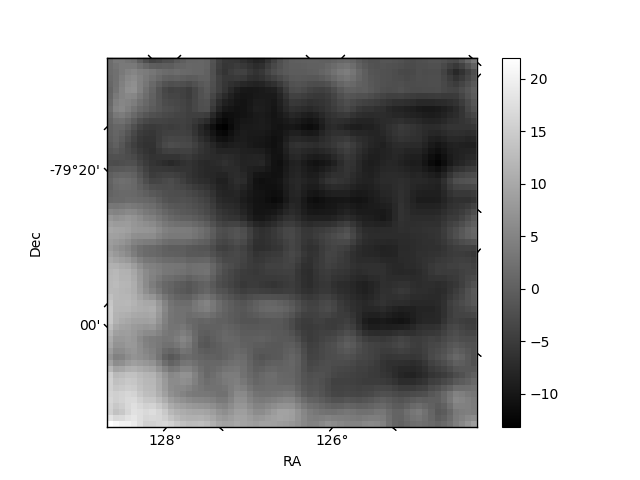
Quadrant B |
|---|---|---|---|
| Quadrant D | 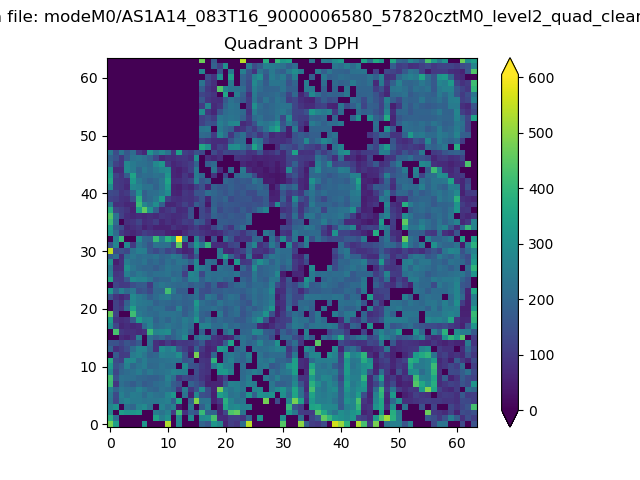 |
 |
Quadrant C |
| Plot type | Count rate plots | Images |
|---|---|---|
| Comparison with Poisson distribution Blue bars denote a histogram of data divided into 1 sec bins. Red curve is a Poisson curve with rate = median count rate of data. |
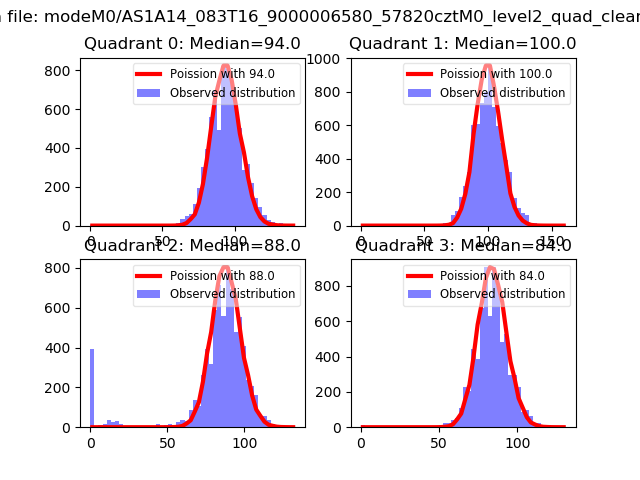 |
 |
| Quadrant-wise count rates Data is divided into 100 sec bins |
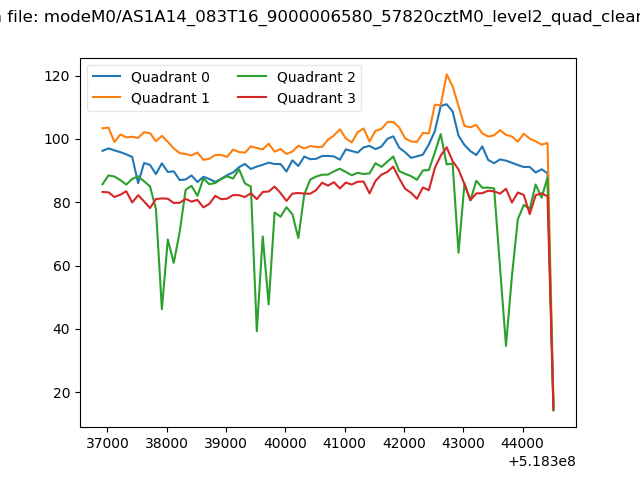 |
|
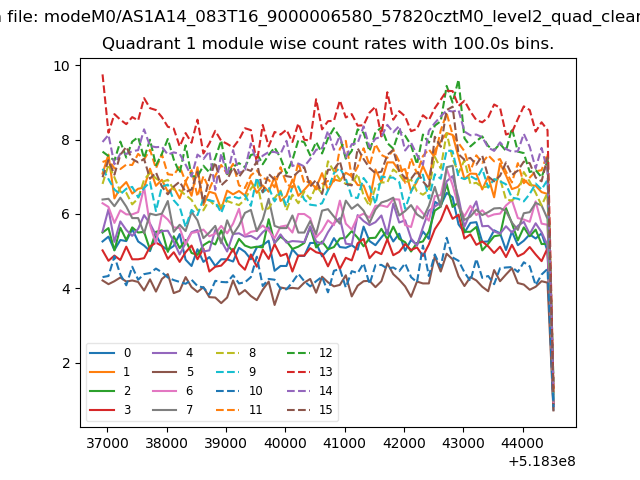
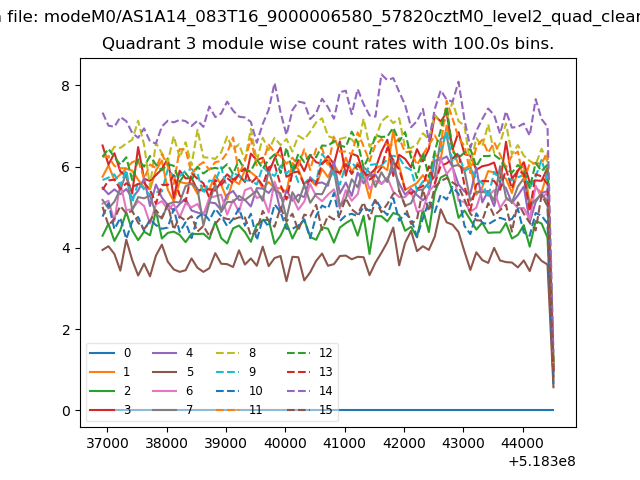
| Module-wise count rates for Quadrant A Data is divided into 100 sec bins |
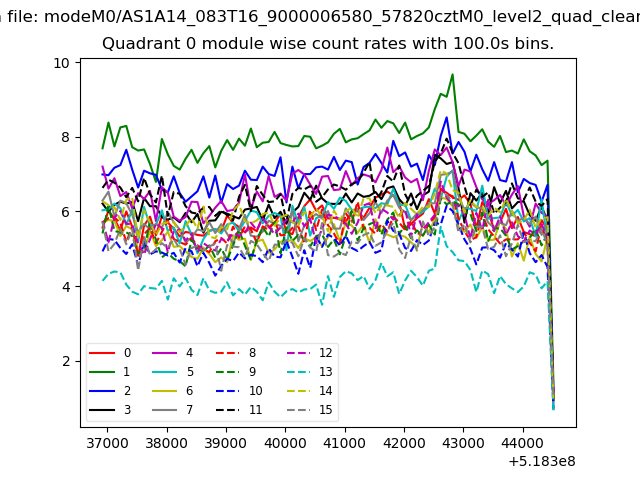 |
 |
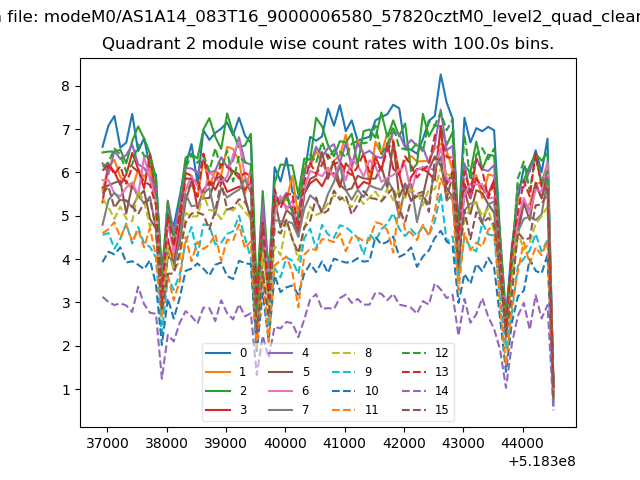
| Module-wise count rates for Quadrant B Data is divided into 100 sec bins |
 |
 |
| Module-wise count rates for Quadrant C Data is divided into 100 sec bins |
 |
 |
| Module-wise count rates for Quadrant D Data is divided into 100 sec bins |
 |
 |
| Parameter | Plot |
|---|---|
| CZT HV Monitor | 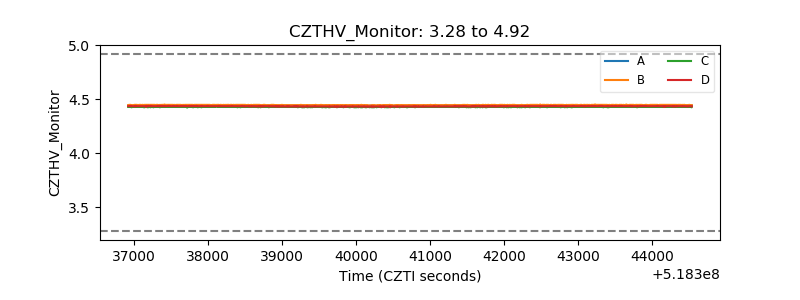 |
| D_VDD | 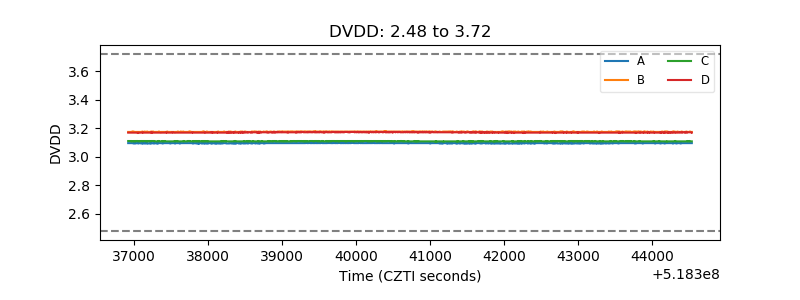 |
| Temperature 1 | 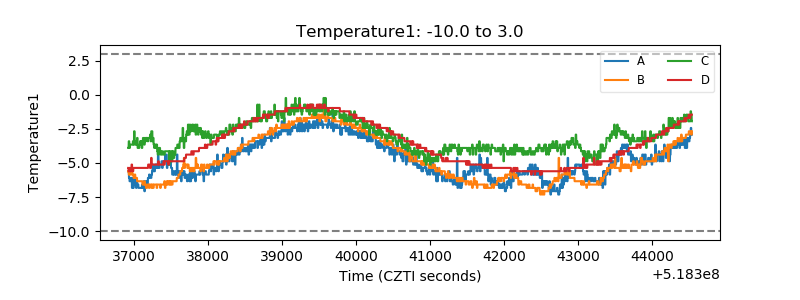 |
| Veto HV Monitor | 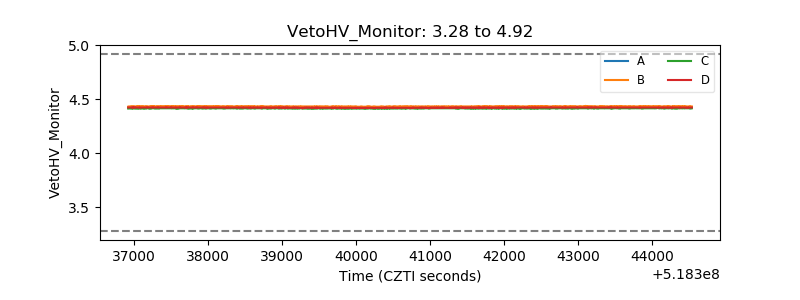 |
| Veto LLD | 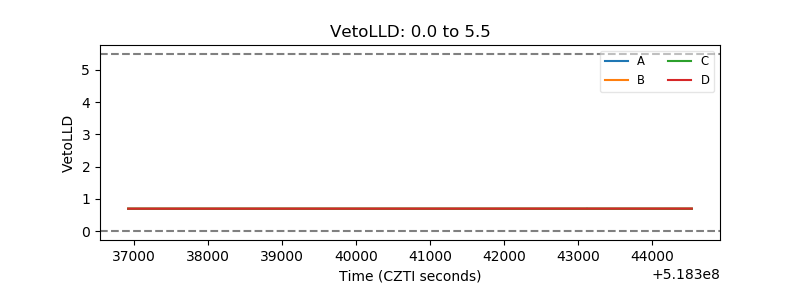 |
| Alpha Counter | 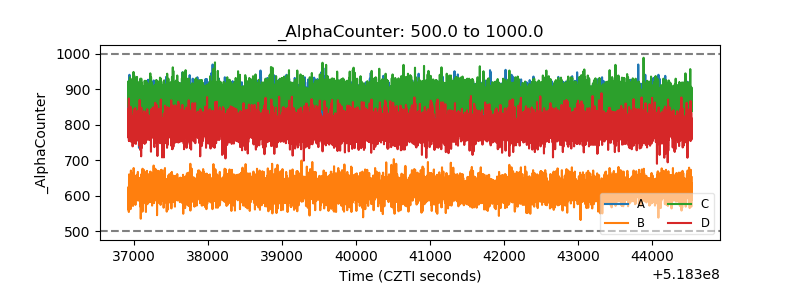 |
| _CPM_Rate | 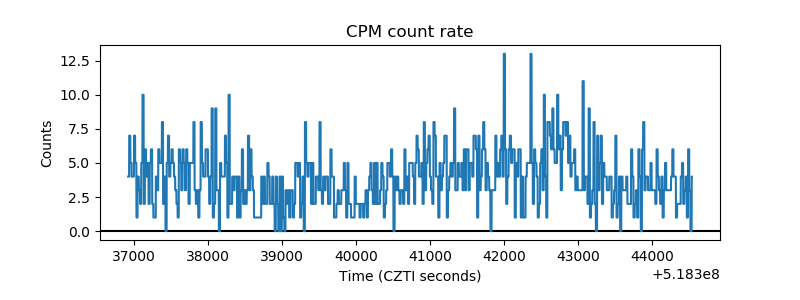 |
| CZT Counter | 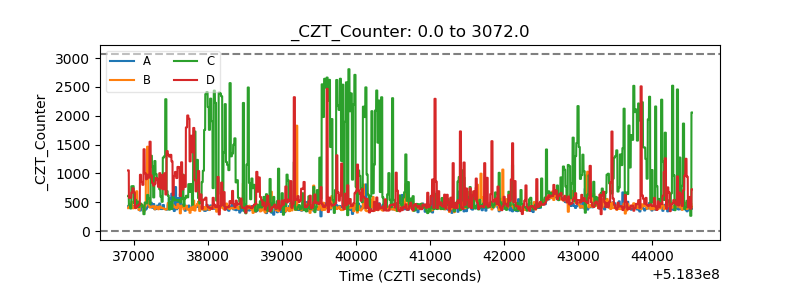 |
| +2.5 Volts monitor |  |
| +5 Volts monitor |  |
| _ROLL_ROT | 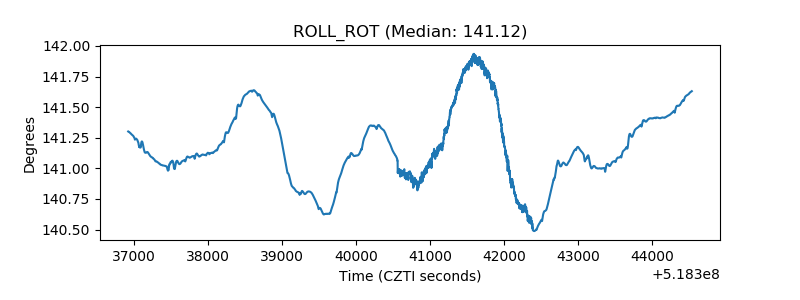 |
| _Roll_DEC | 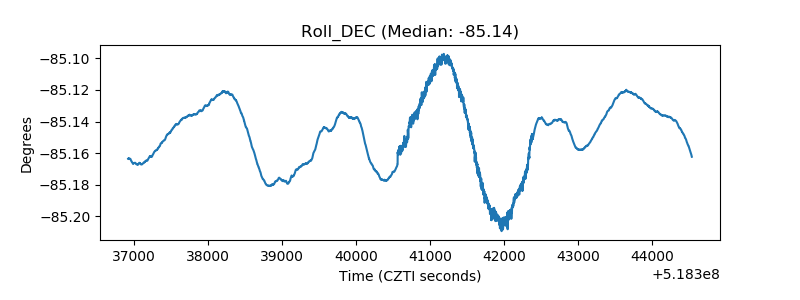 |
| _Roll_RA | 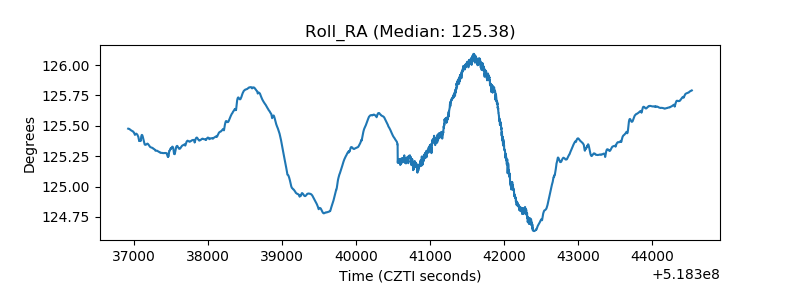 |
| Veto Counter | 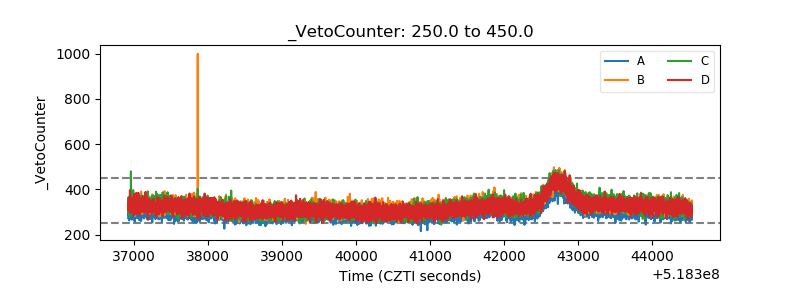 |