| Param | Original file | Final file |
|---|---|---|
| Filename | modeM0/AS1A14_083T16_9000006580_57823cztM0_level2.fits | modeM0/AS1A14_083T16_9000006580_57823cztM0_level2_quad_clean.evt |
| Size (bytes) | 1,100,566,080 | 174,948,480 |
| Size | 1.0 GB | 166.8 MB |
| Events in quadrant A | 6,332,020 | 1,213,288 |
| Events in quadrant B | 6,445,543 | 1,286,274 |
| Events in quadrant C | 17,854,279 | 815,590 |
| Events in quadrant D | 9,092,050 | 1,075,160 |
| Mode SS | |||
|---|---|---|---|
| Quadrant | BADHDUFLAG | Total packets | Discarded packets |
| A | 0 | 264 | 0 |
| B | 0 | 264 | 0 |
| C | 0 | 264 | 0 |
| D | 0 | 264 | 0 |
| Mode M0 | |||
|---|---|---|---|
| Quadrant | BADHDUFLAG | Total packets | Discarded packets |
| A | 0 | 28503 | 1 |
| B | 0 | 28710 | 1 |
| C | 0 | 62122 | 1 |
| D | 0 | 35997 | 2 |
| Mode M9 | |||
|---|---|---|---|
| Quadrant | BADHDUFLAG | Total packets | Discarded packets |
| A | 0 | 4 | 0 |
| B | 0 | 4 | 0 |
| C | 0 | 4 | 0 |
| D | 0 | 4 | 0 |
| Quadrant | Total seconds | Saturated seconds | Saturation percentage |
|---|---|---|---|
| A | 13114 | 341 | 2.600275% |
| B | 13115 | 389 | 2.966069% |
| C | 13115 | 4297 | 32.764011% |
| D | 13114 | 545 | 4.155864% |
Noise dominated data is calculated using 1-second bins in cleaned event files. If a bin has >2000 counts, and if more than 50% of those come from <1% of pixels, then it is considered to be noise-dominated and hence unusable.
| Quadrant | # 1 sec bins | Bins with >0 counts | Bins with >2000 counts | High rate bins dominated by noise | Noise dominated (total time) | Noise dominated (detector-on time) | Marked lightcurve |
|---|---|---|---|---|---|---|---|
| A | 13494 | 13115 | 98 | 98 | 0.73% | 0.75% | 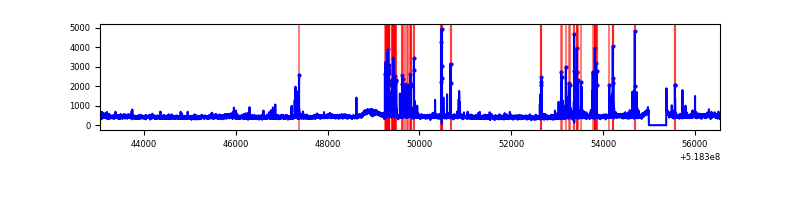 |
| B | 13495 | 13116 | 69 | 69 | 0.51% | 0.53% | 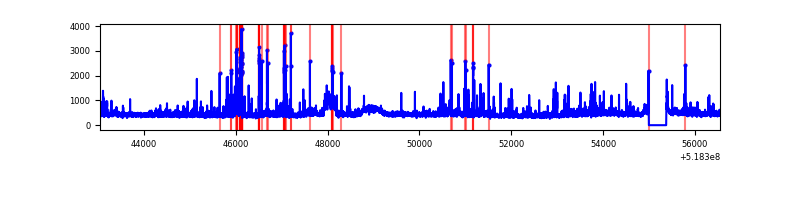 |
| C | 13495 | 13116 | 3317 | 3317 | 24.58% | 25.29% | 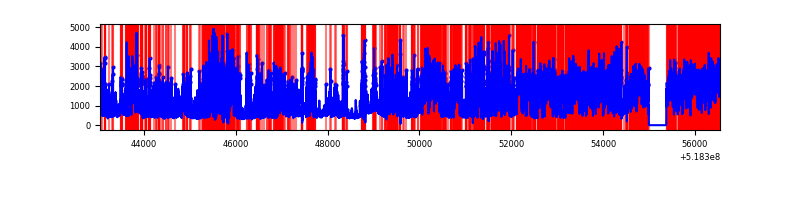 |
| D | 13494 | 13115 | 448 | 448 | 3.32% | 3.42% | 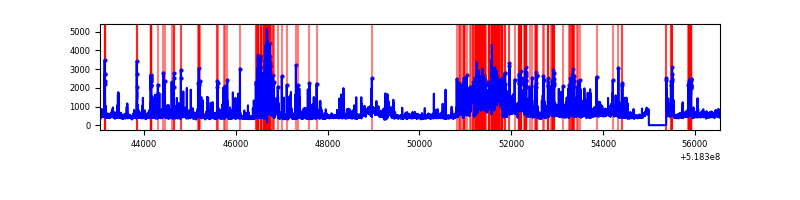 |
Top three noisy pixels from each quadrant. If the there are fewer than three noisy pixels in the level2.evt file, extra rows are filled as -1
| Pixel properties | Quadrant properties | ||||||
|---|---|---|---|---|---|---|---|
| Quadrant | DetID | PixID | Counts | Sigma | Mean | Median | Sigma |
| A | 10 | 251 | 615374 | 1780.75 | 1394 | 1357 | 344.8 |
| A | 3 | 14 | 181682 | 522.97 | 1394 | 1357 | 344.8 |
| A | 3 | 128 | 57990 | 164.25 | 1394 | 1357 | 344.8 |
| B | 5 | 172 | 171004 | 581.85 | 1379 | 1327 | 291.6 |
| B | 10 | 247 | 168987 | 574.94 | 1379 | 1327 | 291.6 |
| B | 6 | 51 | 105032 | 355.62 | 1379 | 1327 | 291.6 |
| C | 9 | 38 | 8693060 | 26768.68 | 1197 | 1181 | 324.7 |
| C | 15 | 224 | 3029283 | 9325.75 | 1197 | 1181 | 324.7 |
| C | 12 | 2 | 884976 | 2721.85 | 1197 | 1181 | 324.7 |
| D | 12 | 110 | 852660 | 2240.5 | 1353 | 1294 | 380.0 |
| D | 2 | 249 | 749086 | 1967.93 | 1353 | 1294 | 380.0 |
| D | 8 | 160 | 640494 | 1682.15 | 1353 | 1294 | 380.0 |
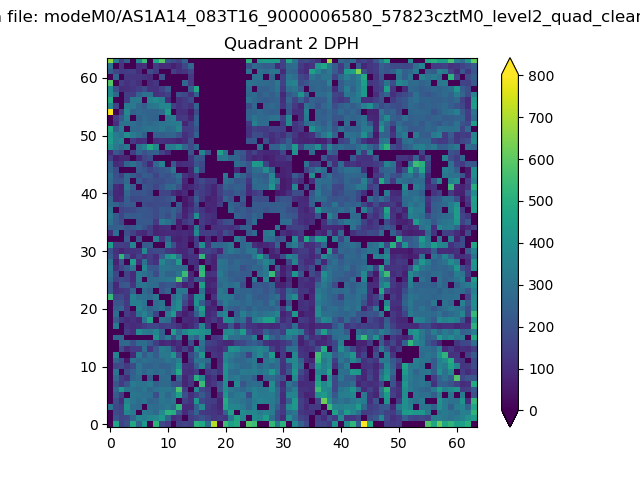
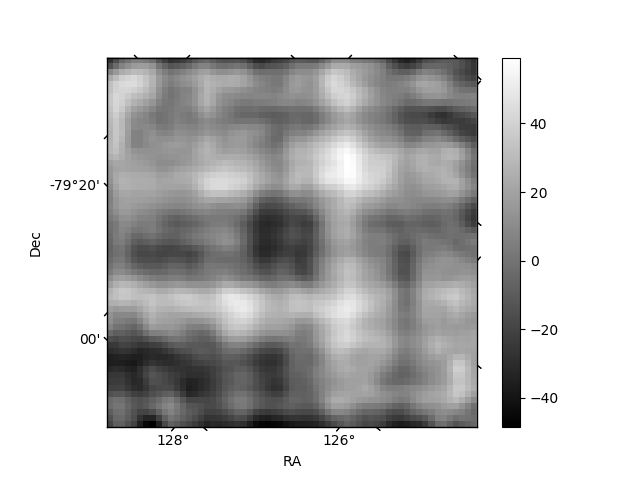
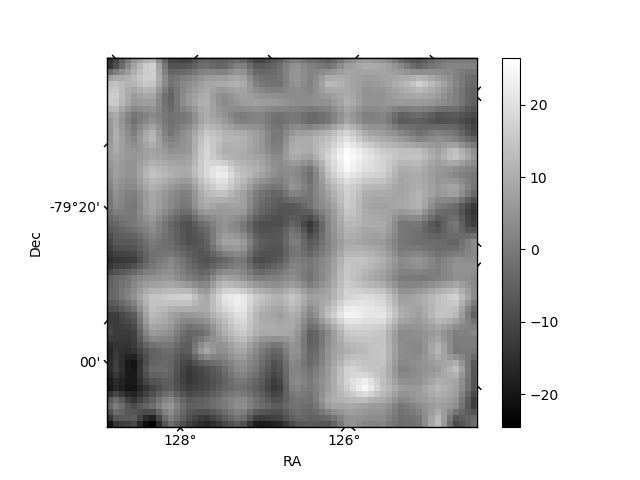
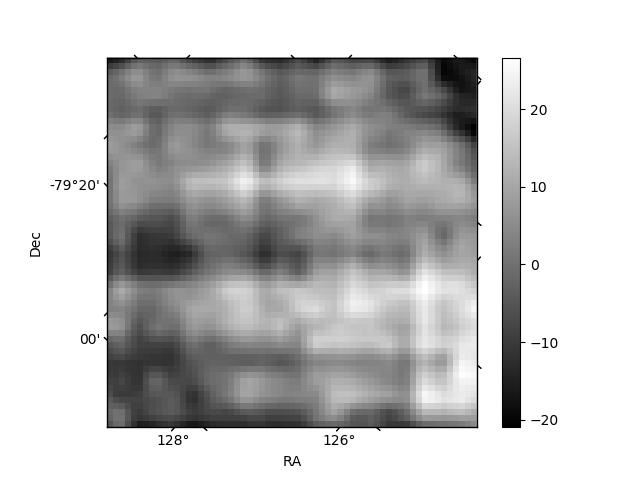
Histogram calculated using DETX and DETY for each event in the final _common_clean file
| Quadrant A | 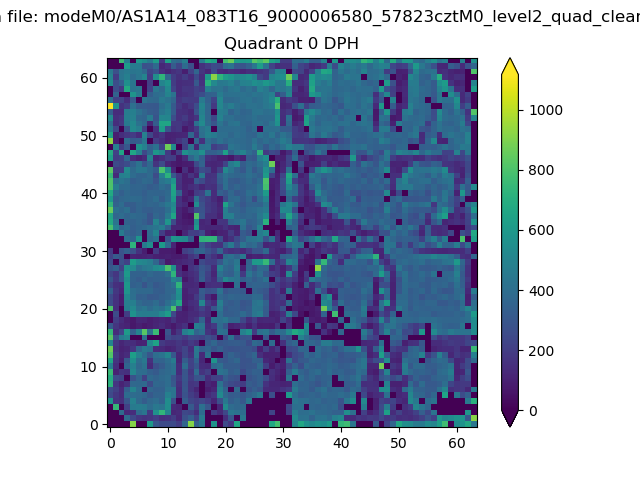 |
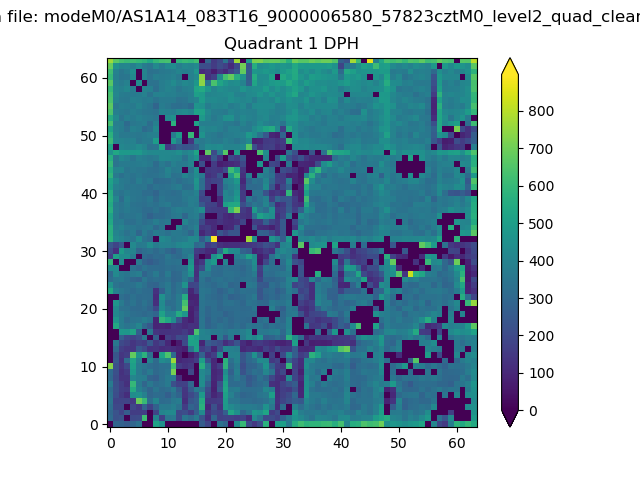 |
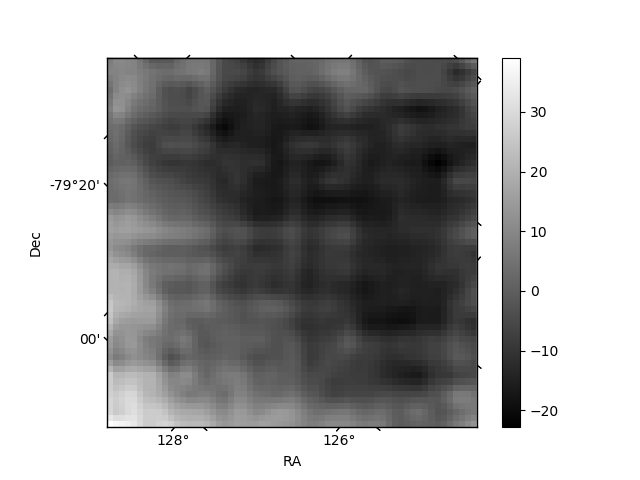
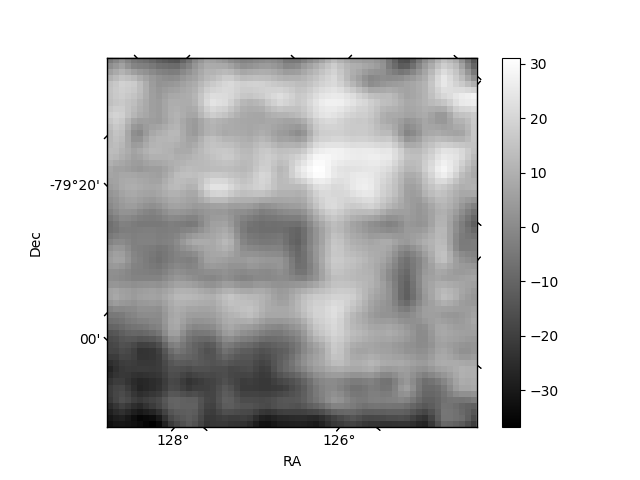
Quadrant B |
|---|---|---|---|
| Quadrant D | 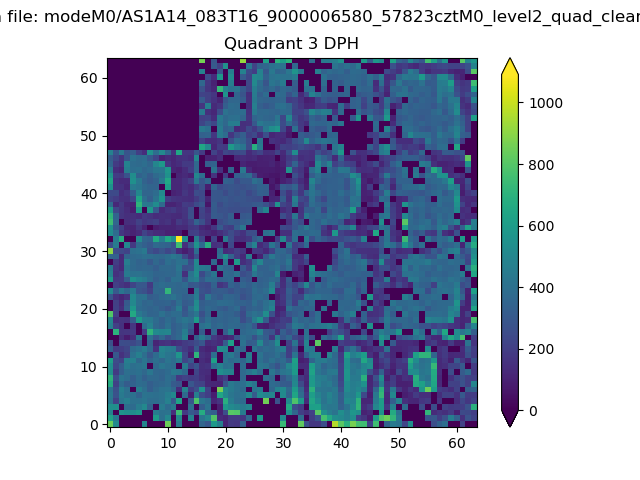 |
 |
Quadrant C |
| Plot type | Count rate plots | Images |
|---|---|---|
| Comparison with Poisson distribution Blue bars denote a histogram of data divided into 1 sec bins. Red curve is a Poisson curve with rate = median count rate of data. |
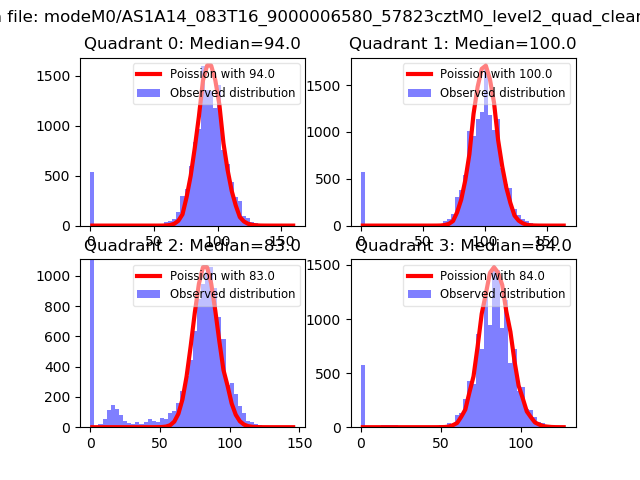 |
 |
| Quadrant-wise count rates Data is divided into 100 sec bins |
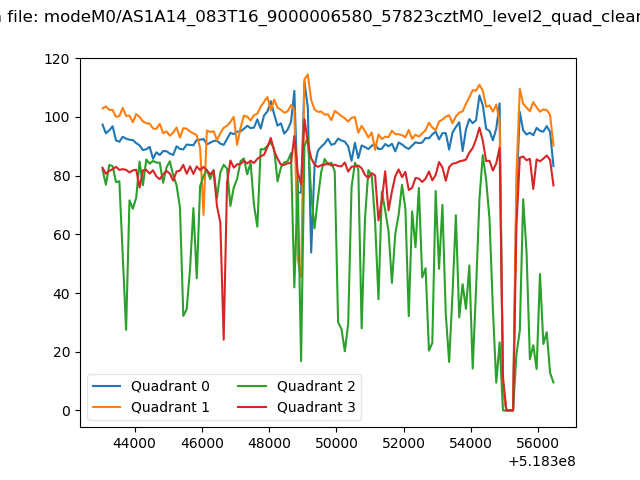 |
|
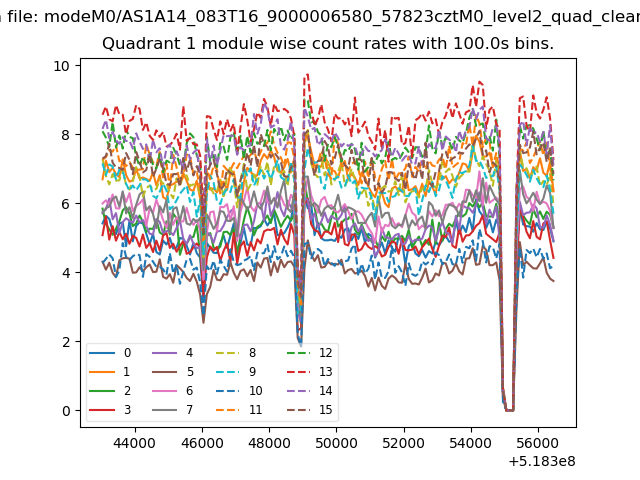
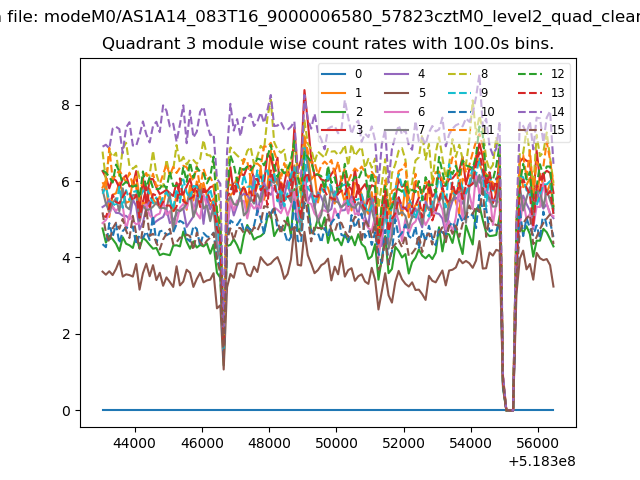
| Module-wise count rates for Quadrant A Data is divided into 100 sec bins |
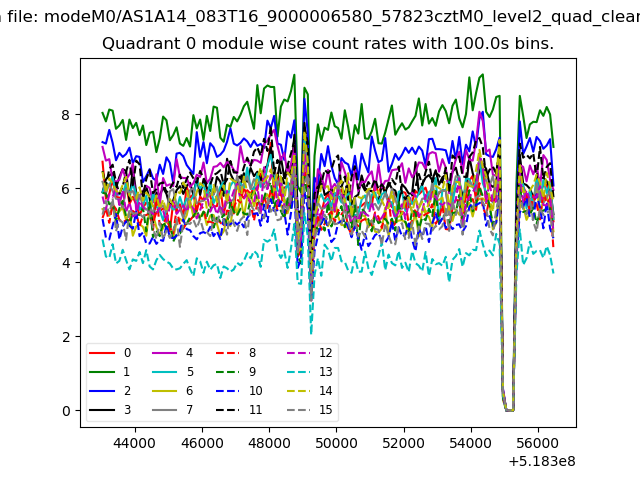 |
 |
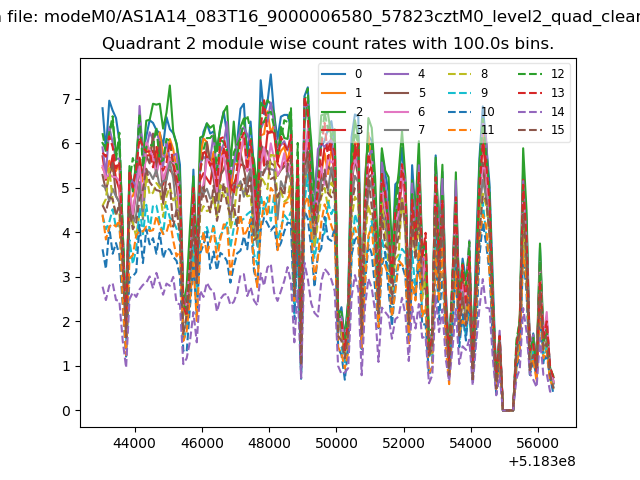
| Module-wise count rates for Quadrant B Data is divided into 100 sec bins |
 |
 |
| Module-wise count rates for Quadrant C Data is divided into 100 sec bins |
 |
 |
| Module-wise count rates for Quadrant D Data is divided into 100 sec bins |
 |
 |
| Parameter | Plot |
|---|---|
| CZT HV Monitor | 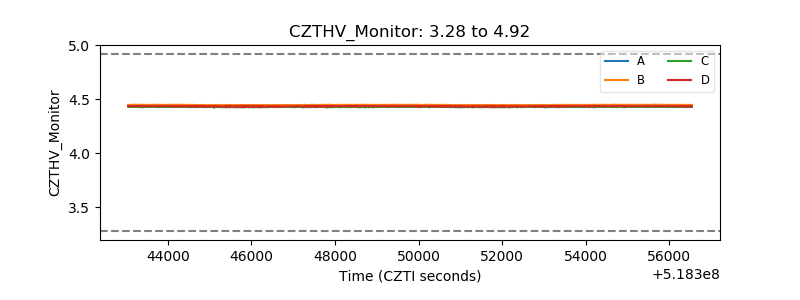 |
| D_VDD | 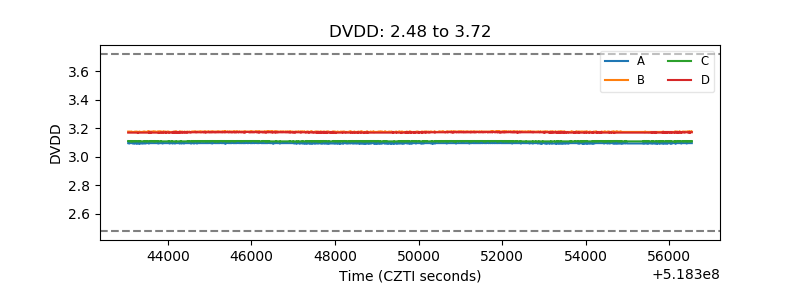 |
| Temperature 1 | 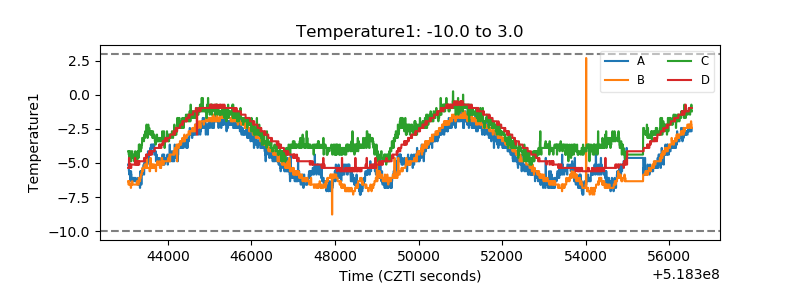 |
| Veto HV Monitor | 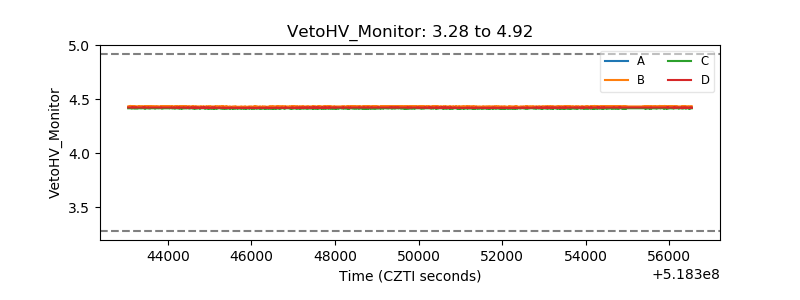 |
| Veto LLD | 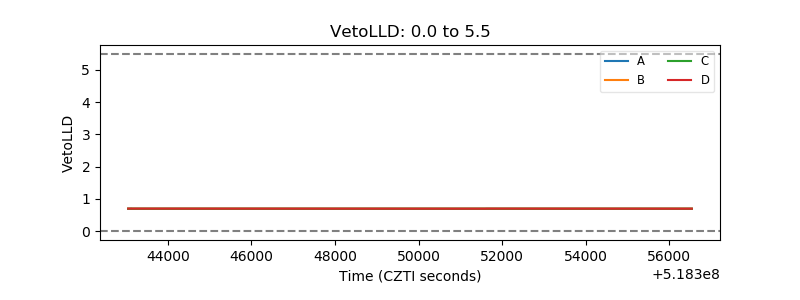 |
| Alpha Counter | 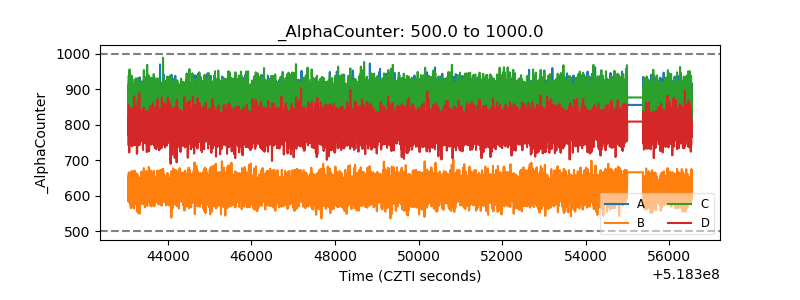 |
| _CPM_Rate | 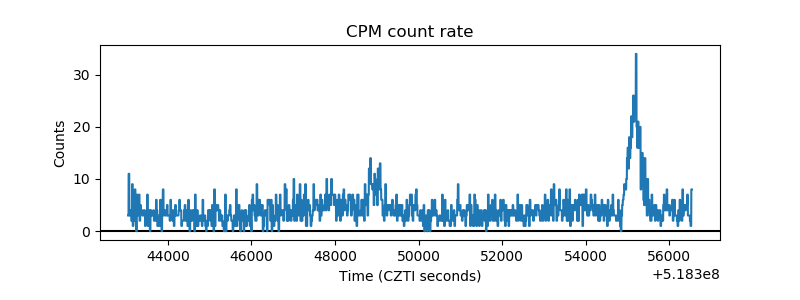 |
| CZT Counter | 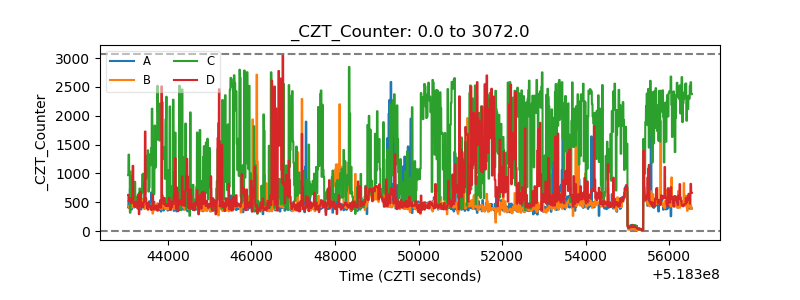 |
| +2.5 Volts monitor | 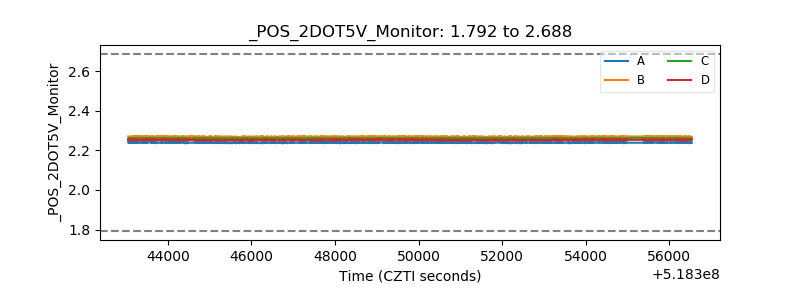 |
| +5 Volts monitor |  |
| _ROLL_ROT | 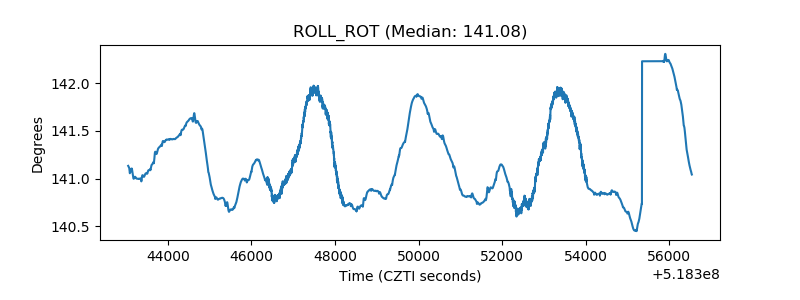 |
| _Roll_DEC | 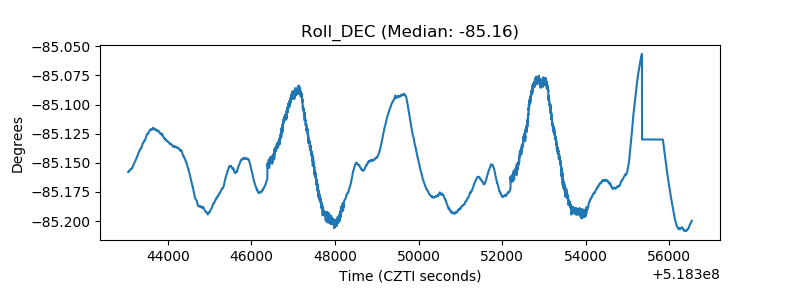 |
| _Roll_RA | 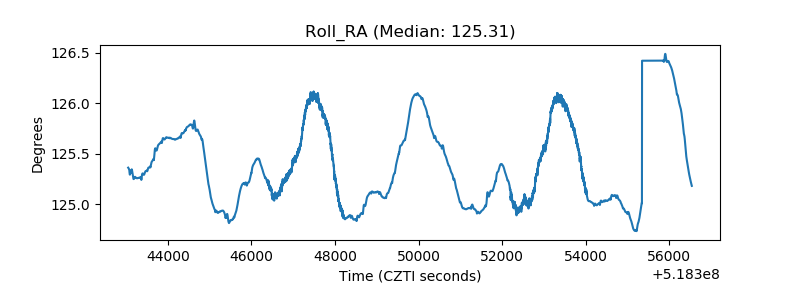 |
| Veto Counter | 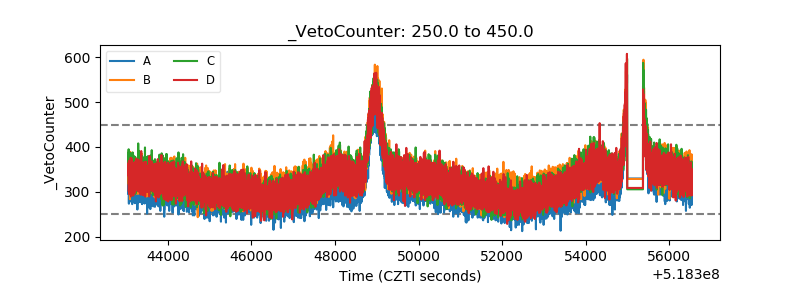 |