| Param | Original file | Final file |
|---|---|---|
| Filename | modeM0/AS1A14_083T16_9000006580_57824cztM0_level2.fits | modeM0/AS1A14_083T16_9000006580_57824cztM0_level2_quad_clean.evt |
| Size (bytes) | 1,144,408,320 | 154,062,720 |
| Size | 1.1 GB | 146.9 MB |
| Events in quadrant A | 6,104,191 | 1,099,531 |
| Events in quadrant B | 8,709,151 | 1,034,002 |
| Events in quadrant C | 16,211,633 | 765,723 |
| Events in quadrant D | 10,422,538 | 946,466 |
| Mode SS | |||
|---|---|---|---|
| Quadrant | BADHDUFLAG | Total packets | Discarded packets |
| A | 0 | 242 | 0 |
| B | 0 | 242 | 0 |
| C | 0 | 242 | 0 |
| D | 0 | 242 | 0 |
| Mode M0 | |||
|---|---|---|---|
| Quadrant | BADHDUFLAG | Total packets | Discarded packets |
| A | 0 | 26427 | 3 |
| B | 0 | 34545 | 3 |
| C | 0 | 56384 | 3 |
| D | 0 | 38964 | 3 |
| Mode M9 | |||
|---|---|---|---|
| Quadrant | BADHDUFLAG | Total packets | Discarded packets |
| A | 0 | 12 | 0 |
| B | 0 | 12 | 0 |
| C | 0 | 12 | 0 |
| D | 0 | 12 | 0 |
| Quadrant | Total seconds | Saturated seconds | Saturation percentage |
|---|---|---|---|
| A | 11830 | 296 | 2.502113% |
| B | 11829 | 1462 | 12.359456% |
| C | 11829 | 3651 | 30.864824% |
| D | 11829 | 953 | 8.056471% |
Noise dominated data is calculated using 1-second bins in cleaned event files. If a bin has >2000 counts, and if more than 50% of those come from <1% of pixels, then it is considered to be noise-dominated and hence unusable.
| Quadrant | # 1 sec bins | Bins with >0 counts | Bins with >2000 counts | High rate bins dominated by noise | Noise dominated (total time) | Noise dominated (detector-on time) | Marked lightcurve |
|---|---|---|---|---|---|---|---|
| A | 13110 | 11833 | 136 | 136 | 1.04% | 1.15% | 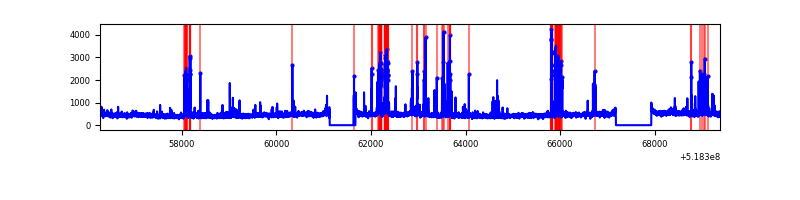 |
| B | 13109 | 11831 | 1092 | 1092 | 8.33% | 9.23% | 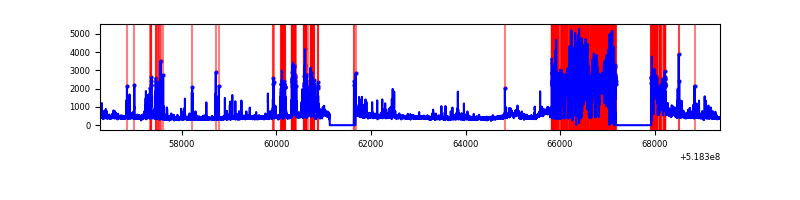 |
| C | 13109 | 11831 | 2976 | 2976 | 22.70% | 25.15% | 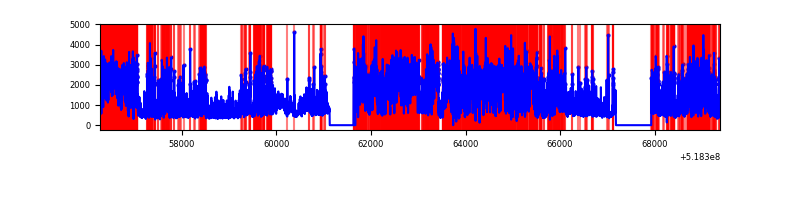 |
| D | 13109 | 11832 | 716 | 716 | 5.46% | 6.05% | 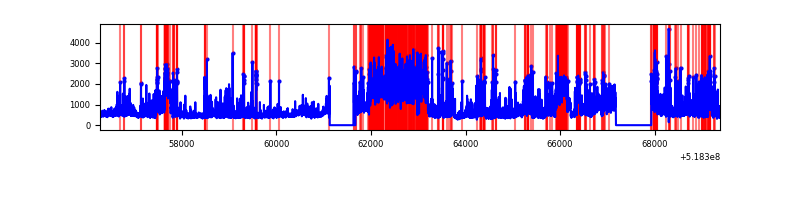 |
Top three noisy pixels from each quadrant. If the there are fewer than three noisy pixels in the level2.evt file, extra rows are filled as -1
| Pixel properties | Quadrant properties | ||||||
|---|---|---|---|---|---|---|---|
| Quadrant | DetID | PixID | Counts | Sigma | Mean | Median | Sigma |
| A | 10 | 251 | 655652 | 2137.55 | 1247 | 1216 | 306.2 |
| A | 3 | 14 | 287010 | 933.47 | 1247 | 1216 | 306.2 |
| A | 3 | 245 | 182798 | 593.09 | 1247 | 1216 | 306.2 |
| B | 4 | 142 | 3542970 | 14471.88 | 1148 | 1105 | 244.7 |
| B | 0 | 171 | 155828 | 632.19 | 1148 | 1105 | 244.7 |
| B | 5 | 185 | 102316 | 413.54 | 1148 | 1105 | 244.7 |
| C | 9 | 38 | 9343430 | 31792.38 | 1072 | 1059 | 293.9 |
| C | 15 | 224 | 2269275 | 7718.81 | 1072 | 1059 | 293.9 |
| C | 14 | 254 | 179811 | 608.3 | 1072 | 1059 | 293.9 |
| D | 12 | 110 | 3911921 | 11653.46 | 1183 | 1129 | 335.6 |
| D | 3 | 224 | 467006 | 1388.23 | 1183 | 1129 | 335.6 |
| D | 8 | 160 | 435744 | 1295.07 | 1183 | 1129 | 335.6 |
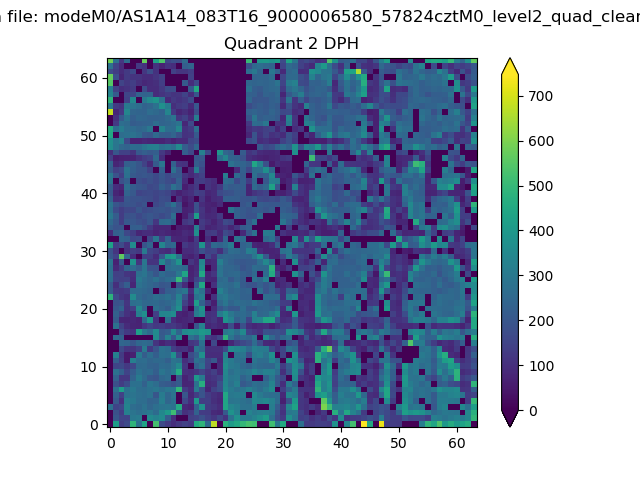
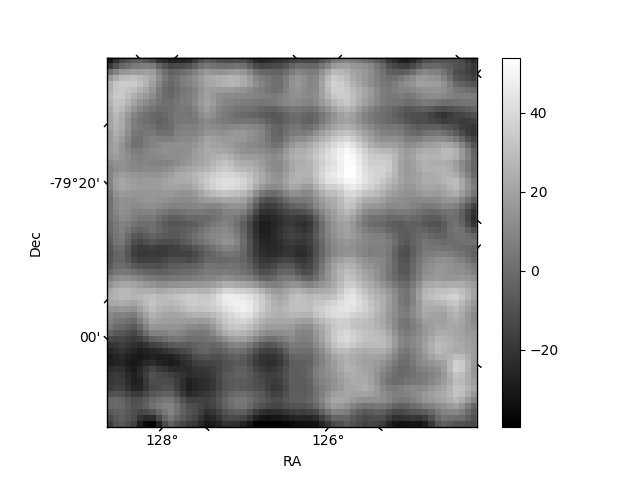
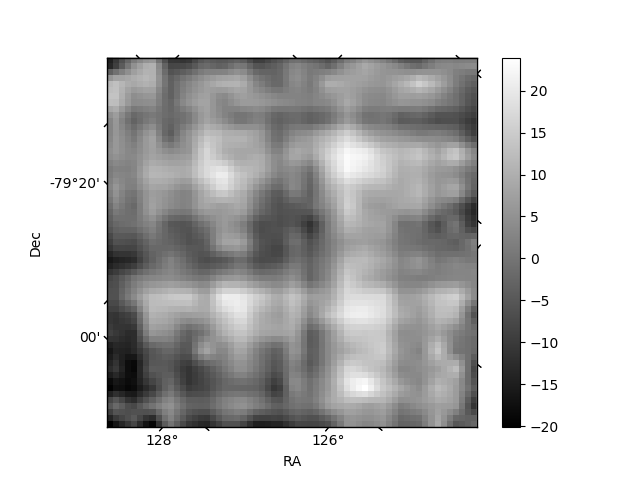
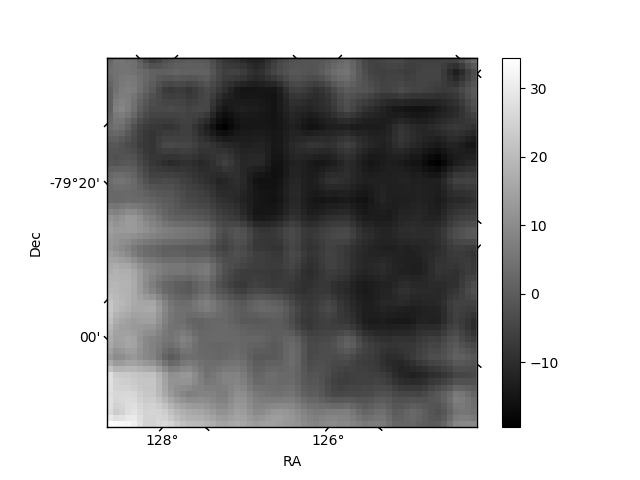
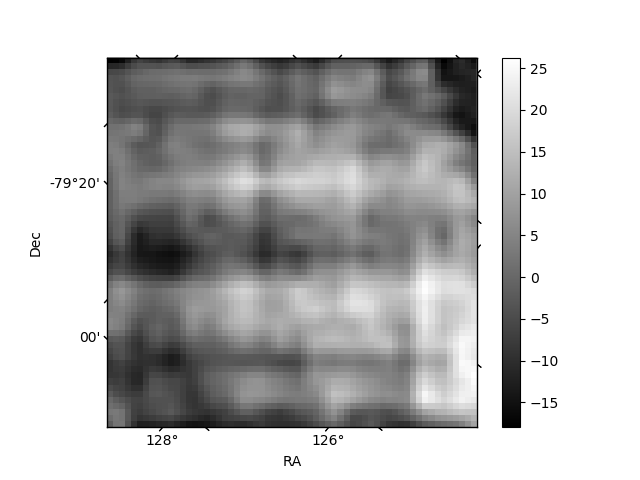
Histogram calculated using DETX and DETY for each event in the final _common_clean file
| Quadrant A | 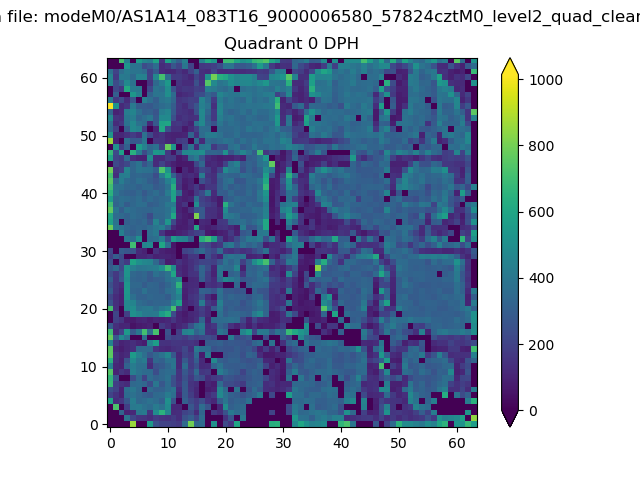 |
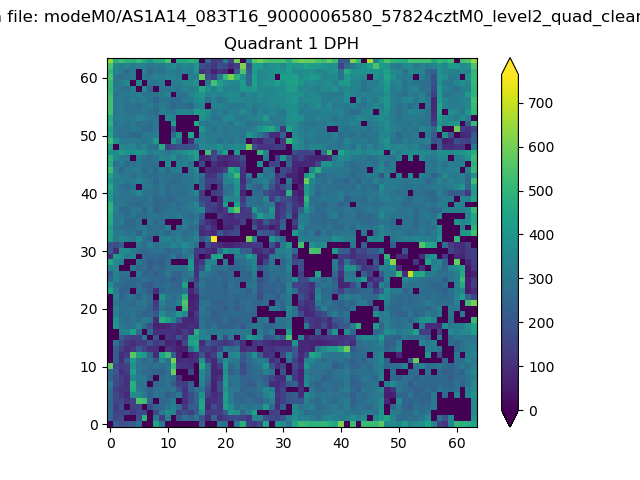 |
Quadrant B |
|---|---|---|---|
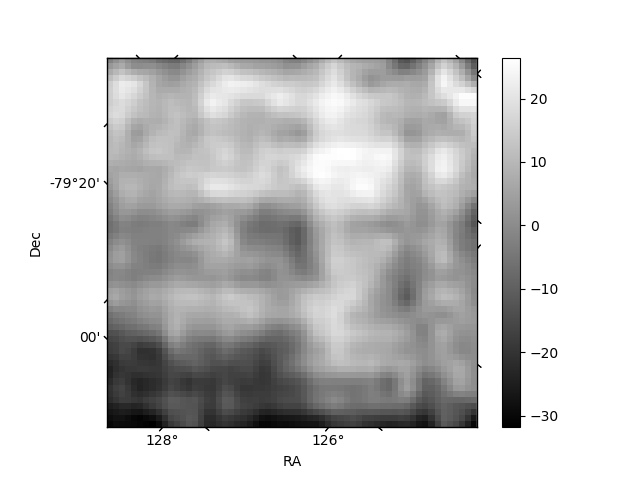
| Quadrant D | 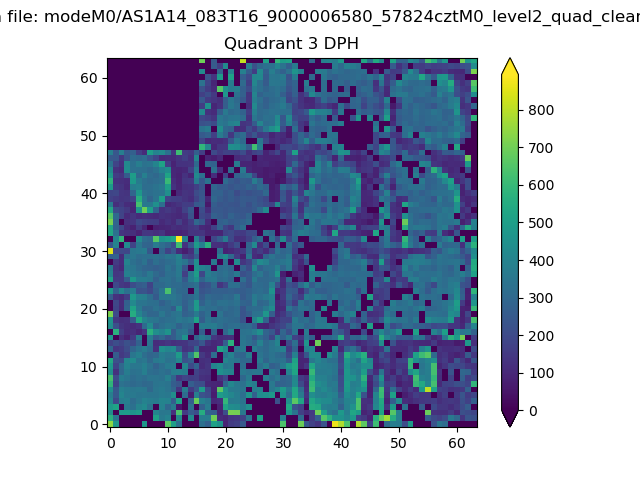 |
 |
Quadrant C |
| Plot type | Count rate plots | Images |
|---|---|---|
| Comparison with Poisson distribution Blue bars denote a histogram of data divided into 1 sec bins. Red curve is a Poisson curve with rate = median count rate of data. |
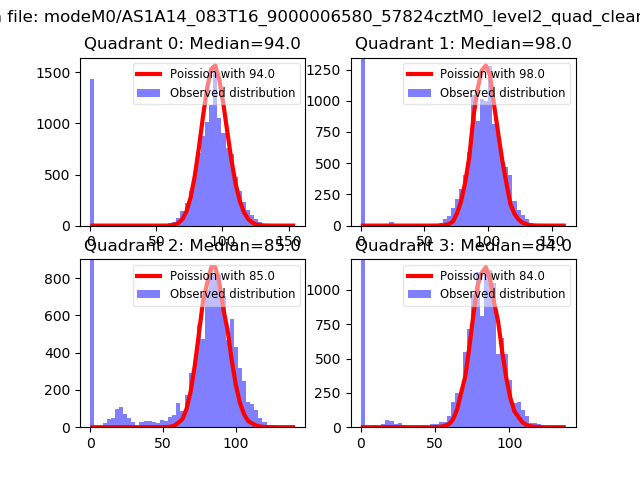 |
 |
| Quadrant-wise count rates Data is divided into 100 sec bins |
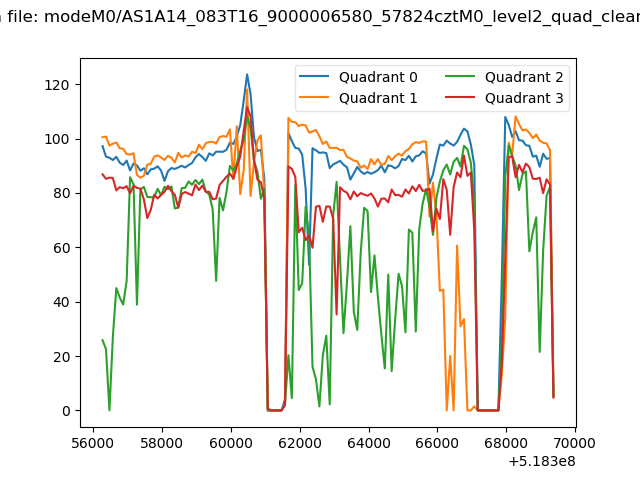 |
|
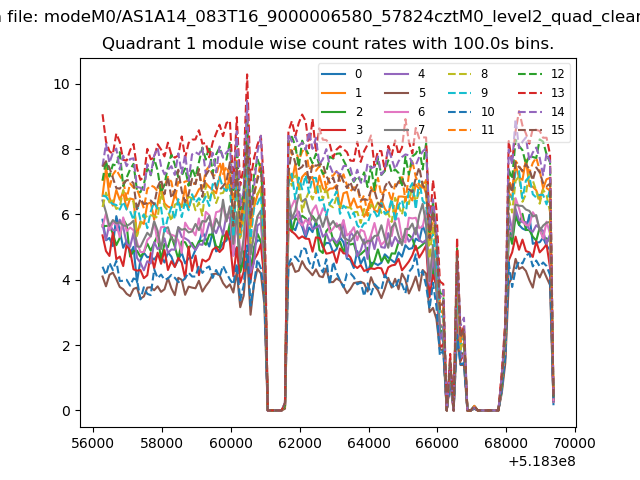
| Module-wise count rates for Quadrant A Data is divided into 100 sec bins |
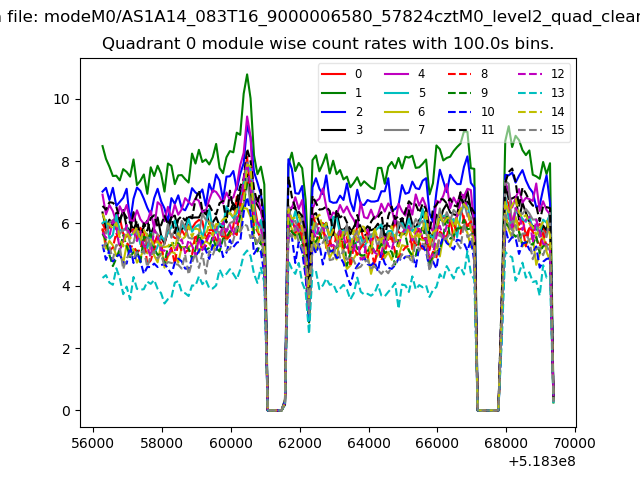 |
 |
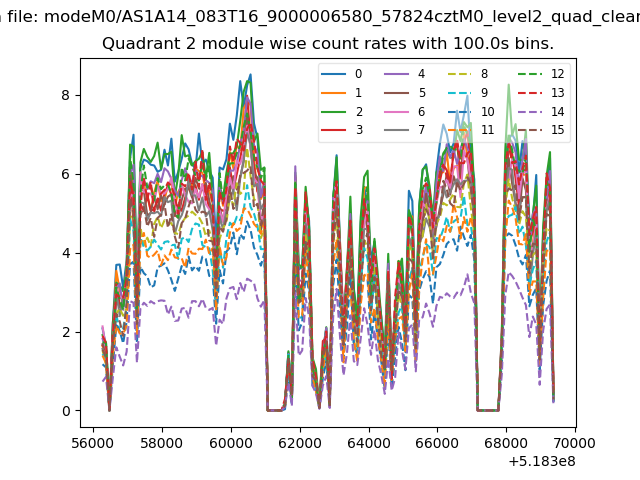
| Module-wise count rates for Quadrant B Data is divided into 100 sec bins |
 |
 |
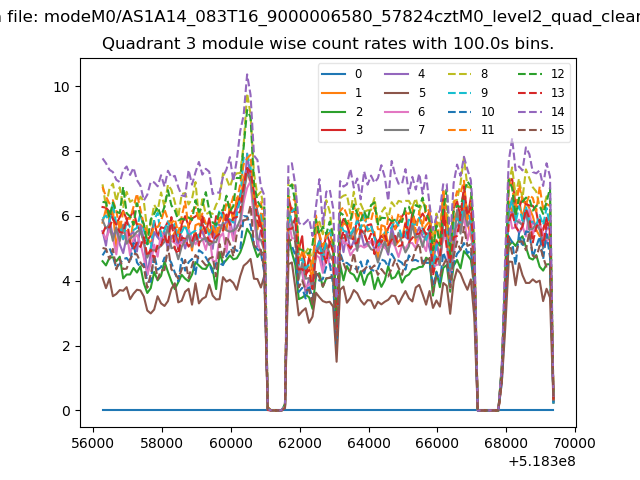
| Module-wise count rates for Quadrant C Data is divided into 100 sec bins |
 |
 |
| Module-wise count rates for Quadrant D Data is divided into 100 sec bins |
 |
 |
| Parameter | Plot |
|---|---|
| CZT HV Monitor | 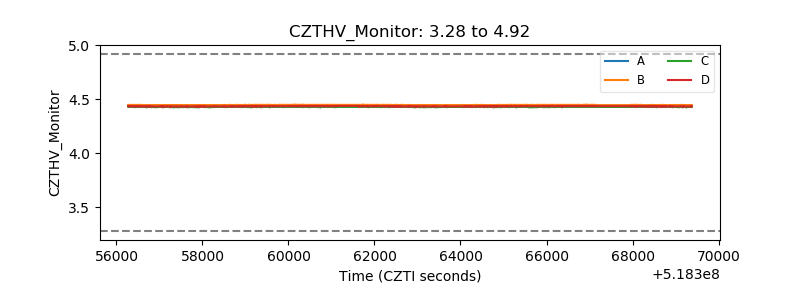 |
| D_VDD | 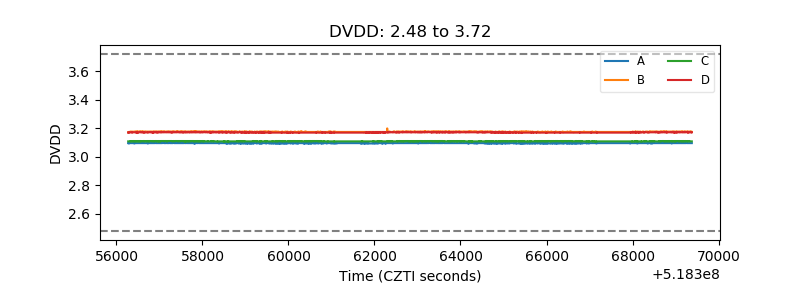 |
| Temperature 1 | 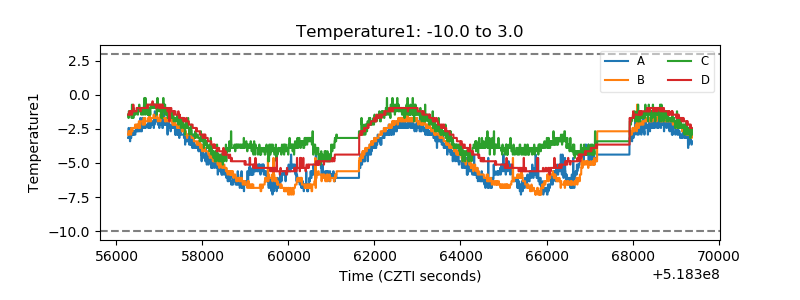 |
| Veto HV Monitor | 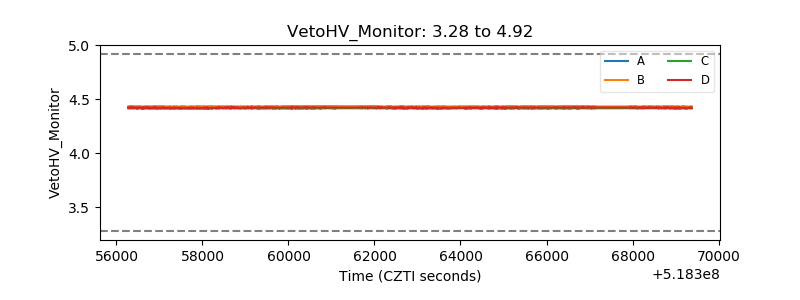 |
| Veto LLD | 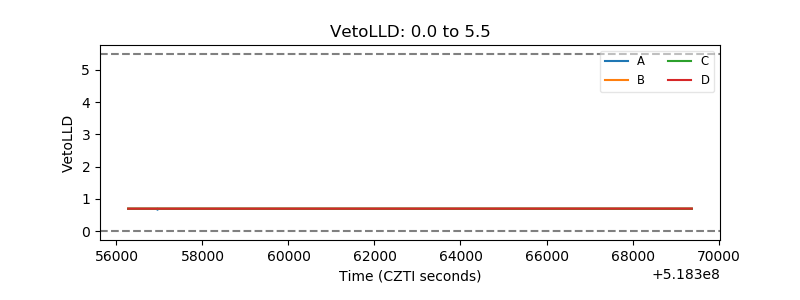 |
| Alpha Counter | 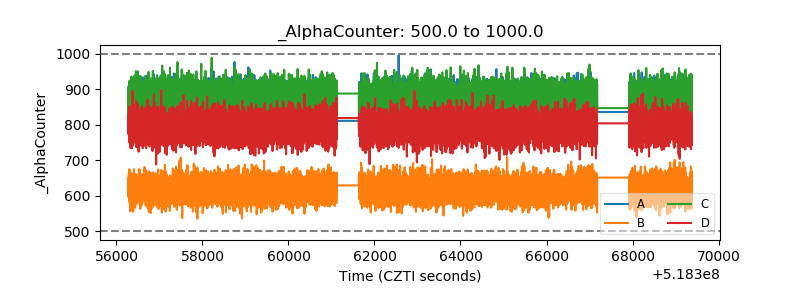 |
| _CPM_Rate | 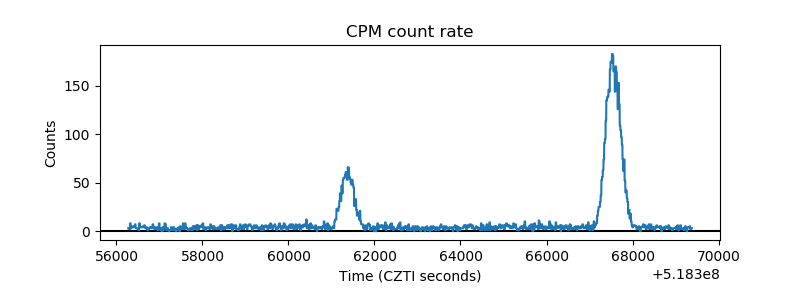 |
| CZT Counter | 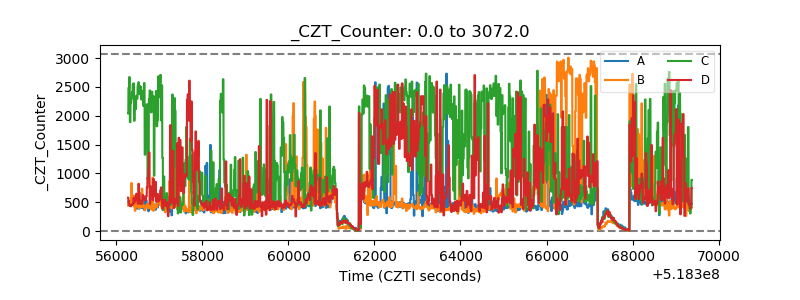 |
| +2.5 Volts monitor |  |
| +5 Volts monitor | 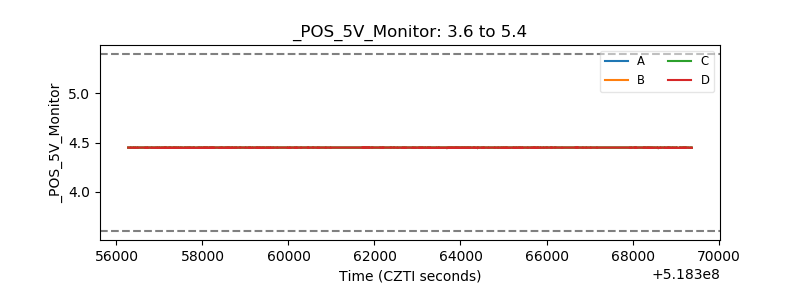 |
| _ROLL_ROT | 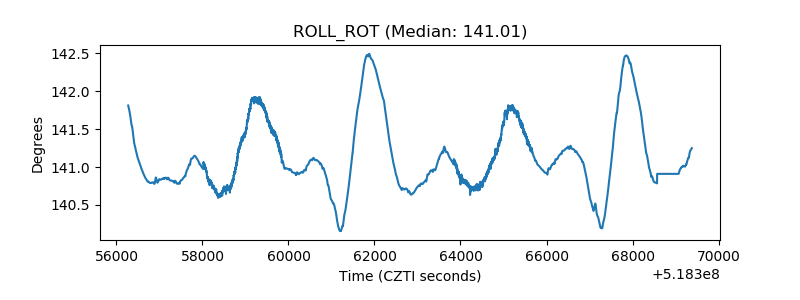 |
| _Roll_DEC | 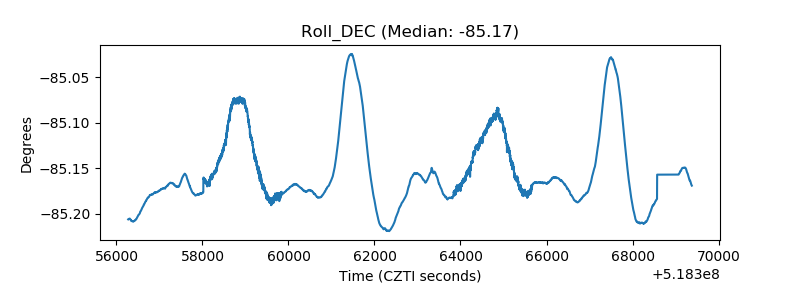 |
| _Roll_RA | 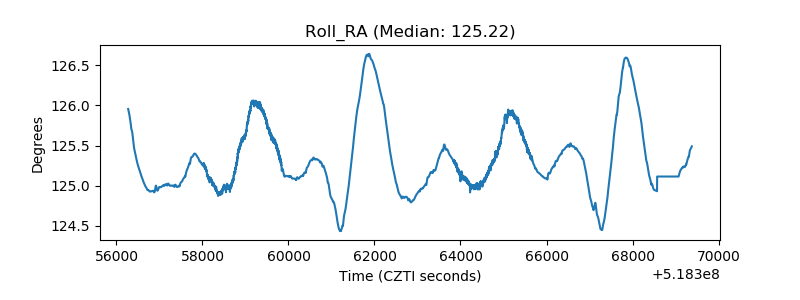 |
| Veto Counter | 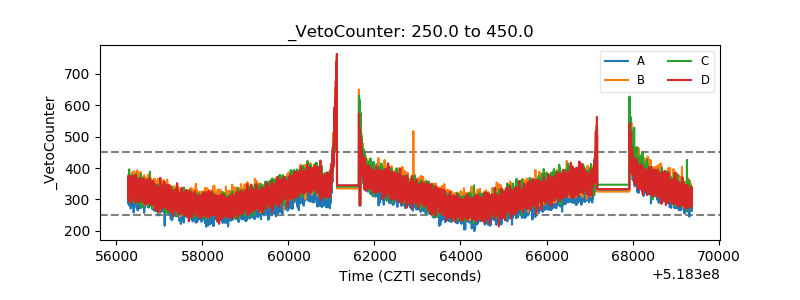 |