| Param | Original file | Final file |
|---|---|---|
| Filename | modeM0/AS1A14_083T16_9000006580_57825cztM0_level2.fits | modeM0/AS1A14_083T16_9000006580_57825cztM0_level2_quad_clean.evt |
| Size (bytes) | 604,575,360 | 83,234,880 |
| Size | 576.6 MB | 79.4 MB |
| Events in quadrant A | 3,511,541 | 605,812 |
| Events in quadrant B | 4,078,910 | 618,047 |
| Events in quadrant C | 10,491,657 | 304,542 |
| Events in quadrant D | 3,798,546 | 543,679 |
| Mode SS | |||
|---|---|---|---|
| Quadrant | BADHDUFLAG | Total packets | Discarded packets |
| A | 0 | 132 | 0 |
| B | 0 | 132 | 0 |
| C | 0 | 132 | 0 |
| D | 0 | 132 | 0 |
| Mode M0 | |||
|---|---|---|---|
| Quadrant | BADHDUFLAG | Total packets | Discarded packets |
| A | 0 | 14730 | 1 |
| B | 0 | 16654 | 1 |
| C | 0 | 35658 | 3 |
| D | 0 | 15923 | 1 |
| Mode M9 | |||
|---|---|---|---|
| Quadrant | BADHDUFLAG | Total packets | Discarded packets |
| A | 0 | 9 | 0 |
| B | 0 | 9 | 0 |
| C | 0 | 9 | 0 |
| D | 0 | 9 | 0 |
| Quadrant | Total seconds | Saturated seconds | Saturation percentage |
|---|---|---|---|
| A | 6415 | 130 | 2.026500% |
| B | 6415 | 379 | 5.908028% |
| C | 6414 | 3249 | 50.654818% |
| D | 6415 | 88 | 1.371785% |
Noise dominated data is calculated using 1-second bins in cleaned event files. If a bin has >2000 counts, and if more than 50% of those come from <1% of pixels, then it is considered to be noise-dominated and hence unusable.
| Quadrant | # 1 sec bins | Bins with >0 counts | Bins with >2000 counts | High rate bins dominated by noise | Noise dominated (total time) | Noise dominated (detector-on time) | Marked lightcurve |
|---|---|---|---|---|---|---|---|
| A | 7325 | 6416 | 74 | 74 | 1.01% | 1.15% | 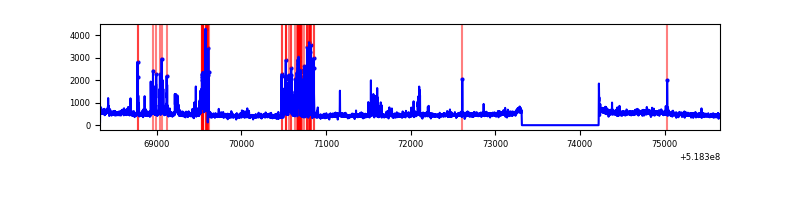 |
| B | 7325 | 6416 | 256 | 256 | 3.49% | 3.99% | 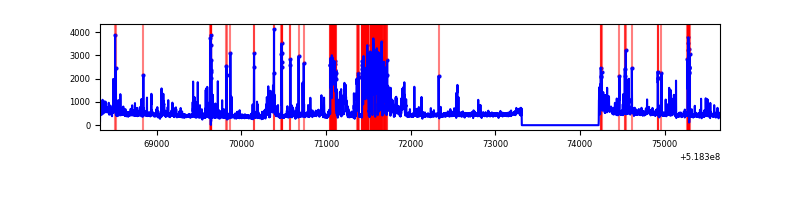 |
| C | 7324 | 6415 | 2587 | 2587 | 35.32% | 40.33% | 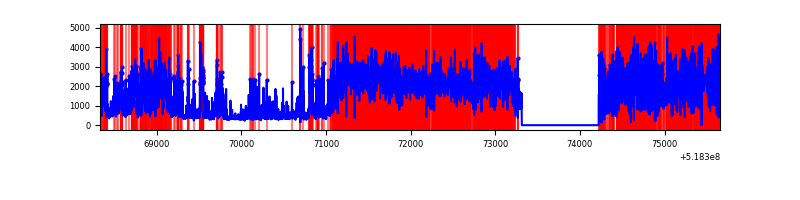 |
| D | 7325 | 6416 | 70 | 70 | 0.96% | 1.09% | 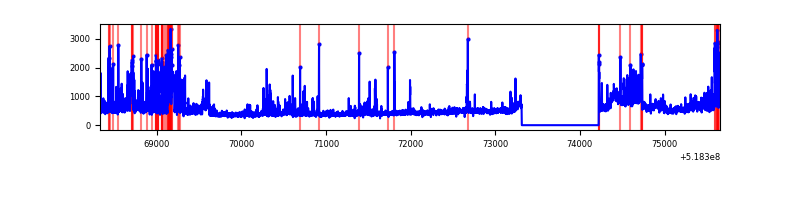 |
Top three noisy pixels from each quadrant. If the there are fewer than three noisy pixels in the level2.evt file, extra rows are filled as -1
| Pixel properties | Quadrant properties | ||||||
|---|---|---|---|---|---|---|---|
| Quadrant | DetID | PixID | Counts | Sigma | Mean | Median | Sigma |
| A | 10 | 251 | 321354 | 1915.7 | 674 | 658 | 167.4 |
| A | 3 | 14 | 271703 | 1619.1 | 674 | 658 | 167.4 |
| A | 3 | 245 | 185366 | 1103.36 | 674 | 658 | 167.4 |
| B | 4 | 142 | 752988 | 5335.18 | 656 | 632 | 141.0 |
| B | 5 | 185 | 183404 | 1296.09 | 656 | 632 | 141.0 |
| B | 2 | 249 | 104792 | 738.63 | 656 | 632 | 141.0 |
| C | 9 | 38 | 7423649 | 54867.07 | 491 | 485 | 135.3 |
| C | 15 | 224 | 920656 | 6801.29 | 491 | 485 | 135.3 |
| C | 15 | 208 | 65351 | 479.45 | 491 | 485 | 135.3 |
| D | 12 | 110 | 486285 | 2665.91 | 645 | 617 | 182.2 |
| D | 13 | 138 | 195297 | 1068.63 | 645 | 617 | 182.2 |
| D | 8 | 160 | 148605 | 812.33 | 645 | 617 | 182.2 |
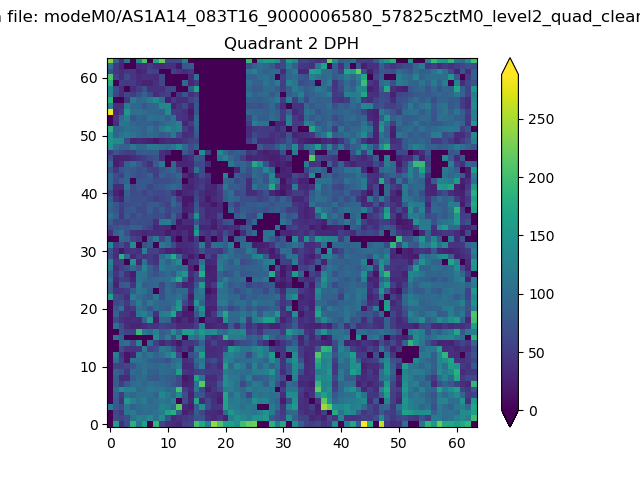
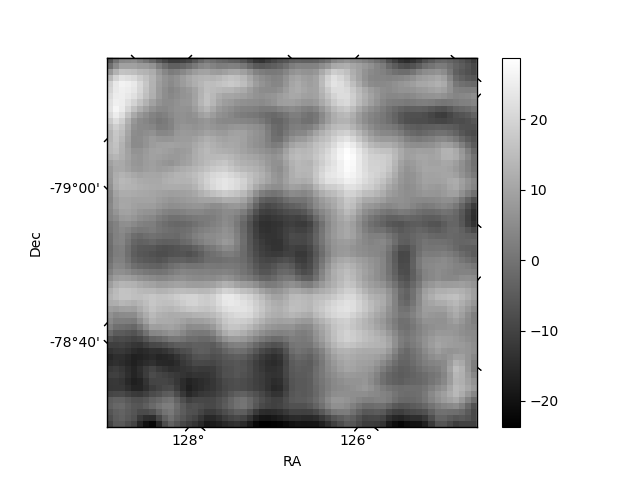
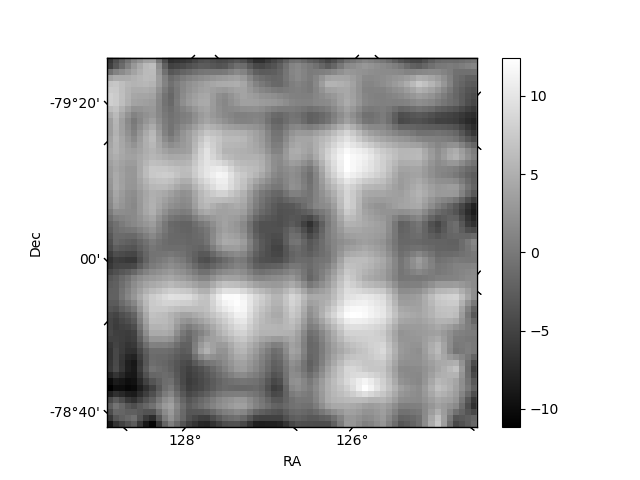
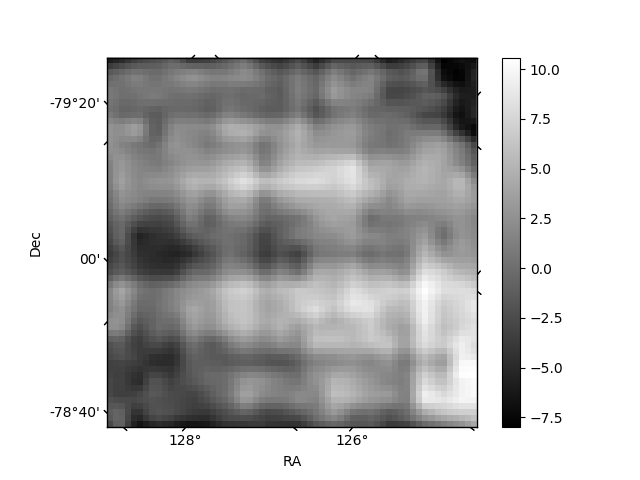
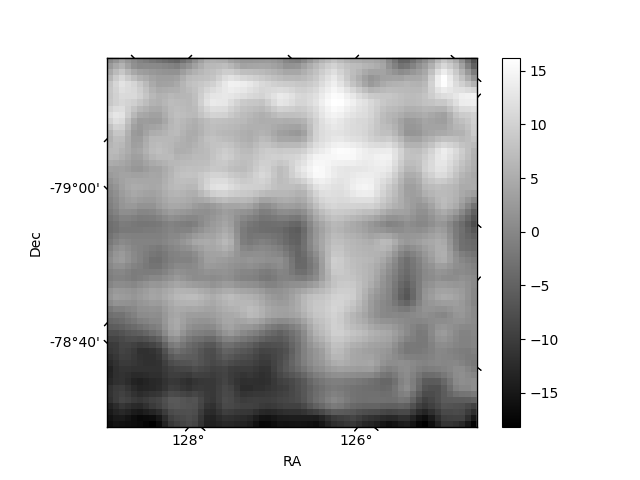
Histogram calculated using DETX and DETY for each event in the final _common_clean file
| Quadrant A | 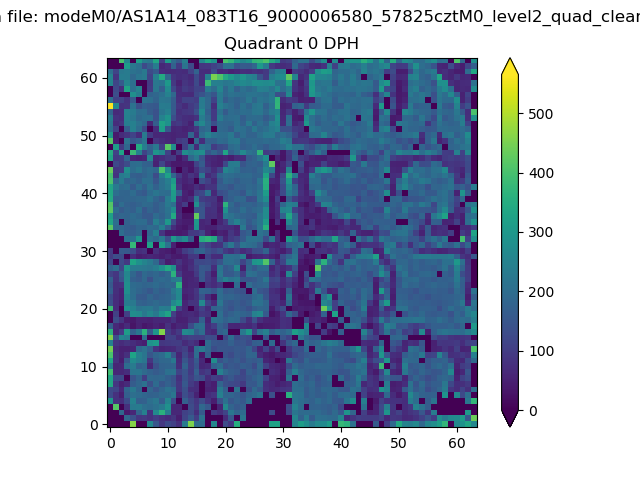 |
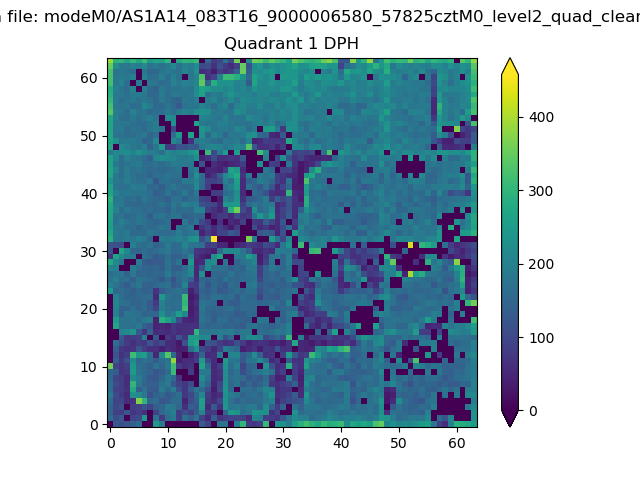 |
Quadrant B |
|---|---|---|---|
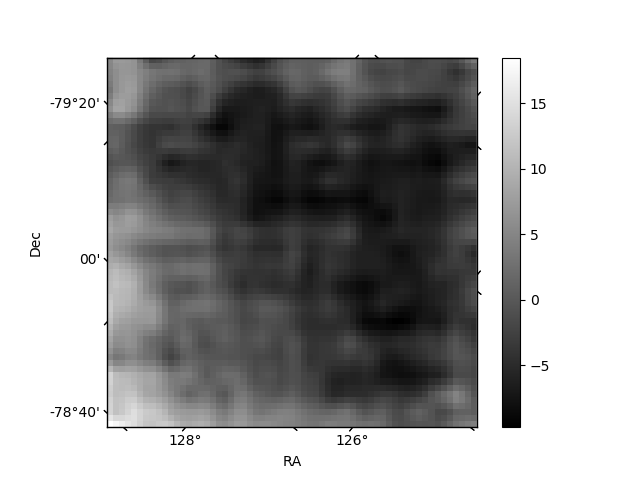
| Quadrant D | 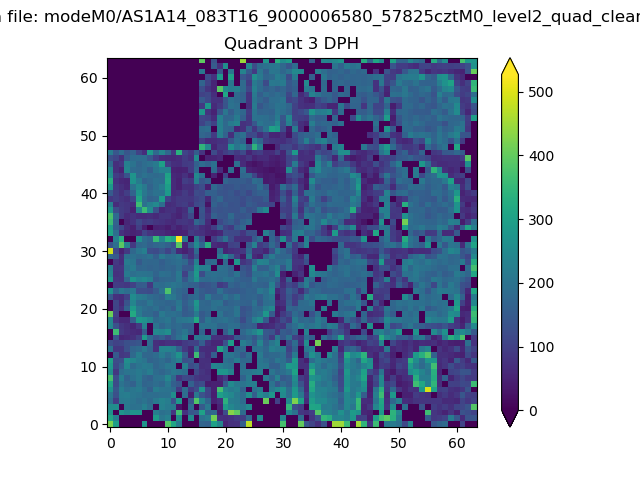 |
 |
Quadrant C |
| Plot type | Count rate plots | Images |
|---|---|---|
| Comparison with Poisson distribution Blue bars denote a histogram of data divided into 1 sec bins. Red curve is a Poisson curve with rate = median count rate of data. |
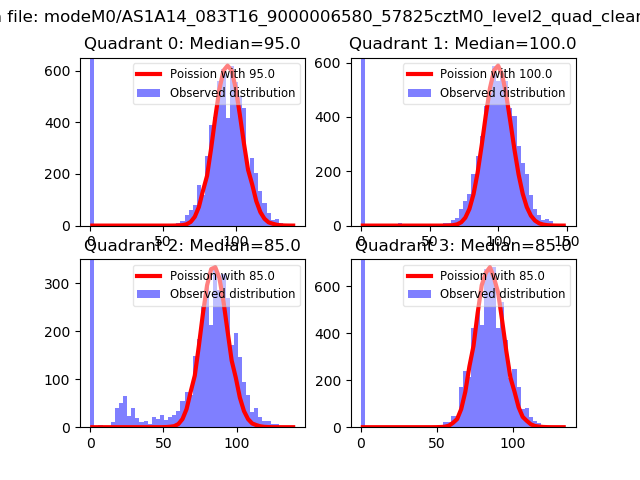 |
 |
| Quadrant-wise count rates Data is divided into 100 sec bins |
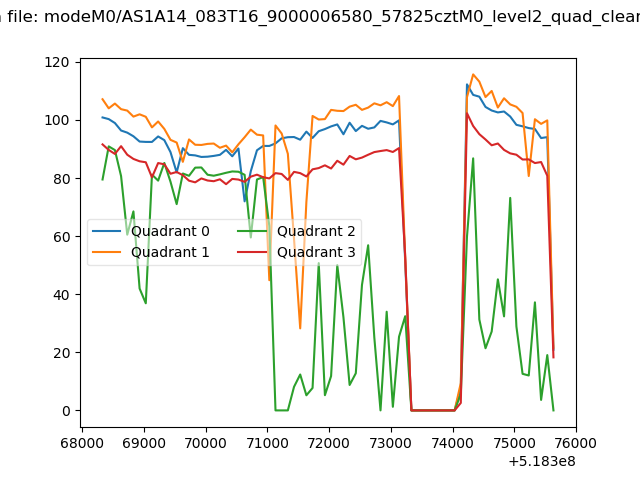 |
|
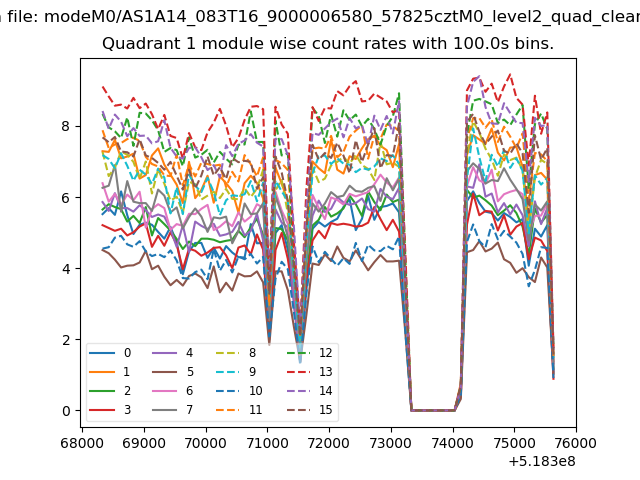
| Module-wise count rates for Quadrant A Data is divided into 100 sec bins |
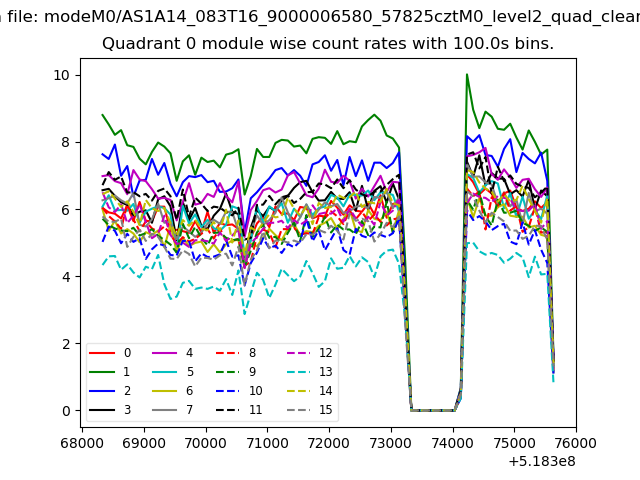 |
 |
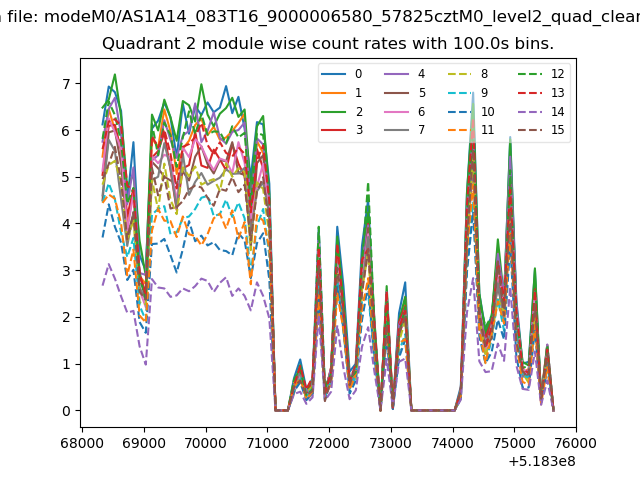
| Module-wise count rates for Quadrant B Data is divided into 100 sec bins |
 |
 |
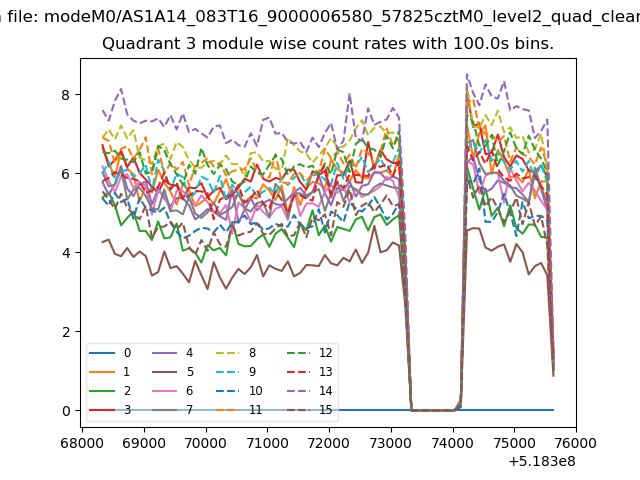
| Module-wise count rates for Quadrant C Data is divided into 100 sec bins |
 |
 |
| Module-wise count rates for Quadrant D Data is divided into 100 sec bins |
 |
 |
| Parameter | Plot |
|---|---|
| CZT HV Monitor | 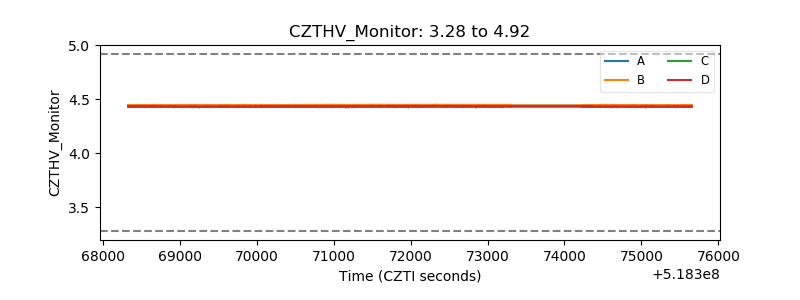 |
| D_VDD | 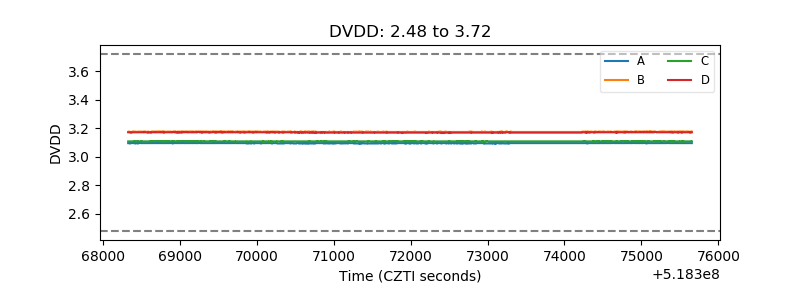 |
| Temperature 1 | 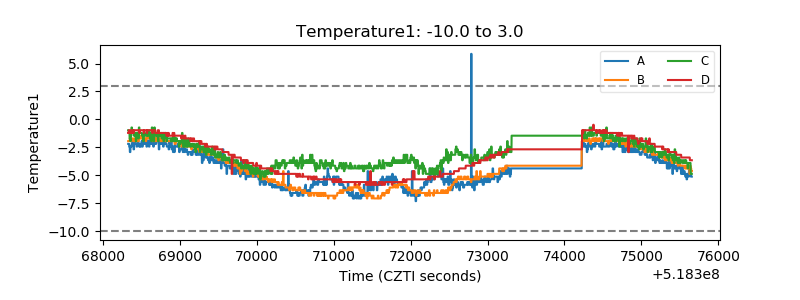 |
| Veto HV Monitor | 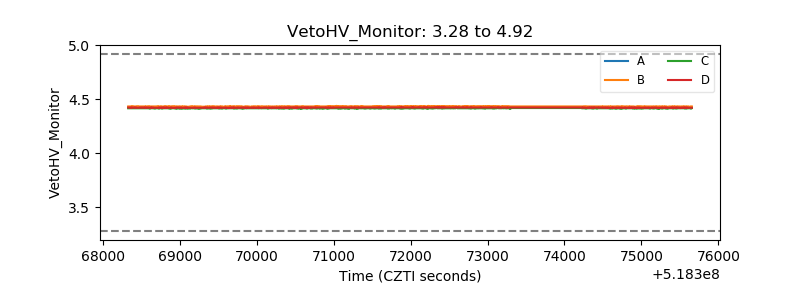 |
| Veto LLD | 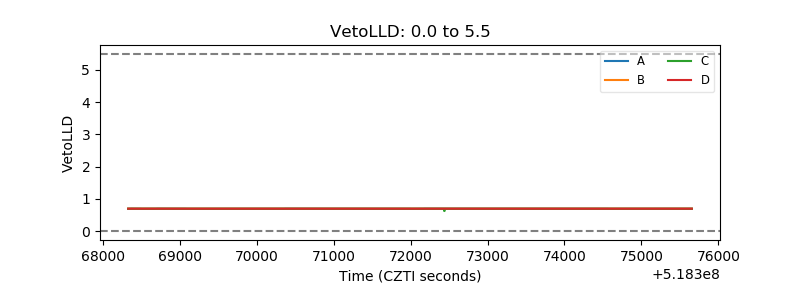 |
| Alpha Counter | 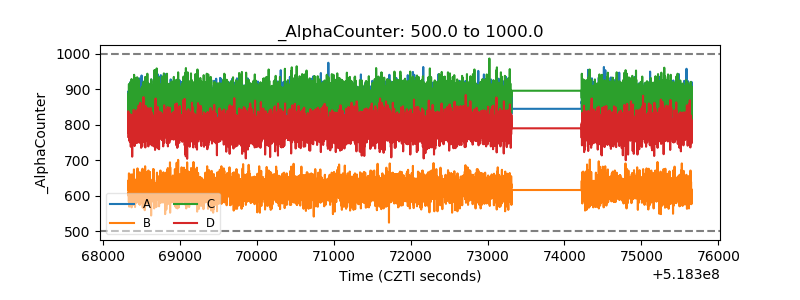 |
| _CPM_Rate | 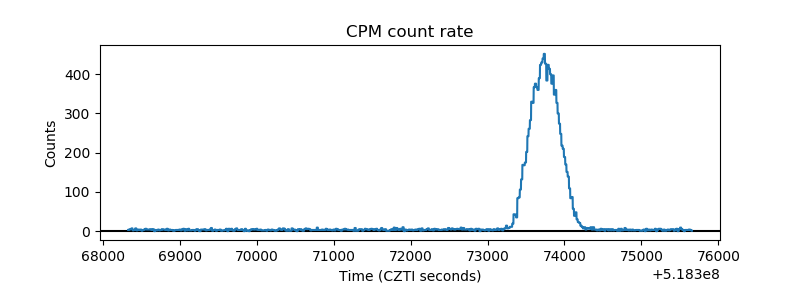 |
| CZT Counter | 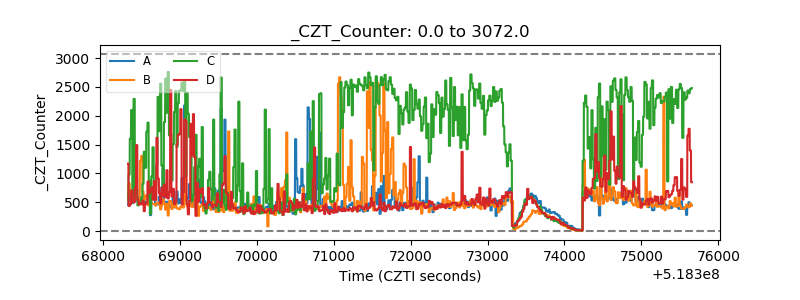 |
| +2.5 Volts monitor |  |
| +5 Volts monitor | 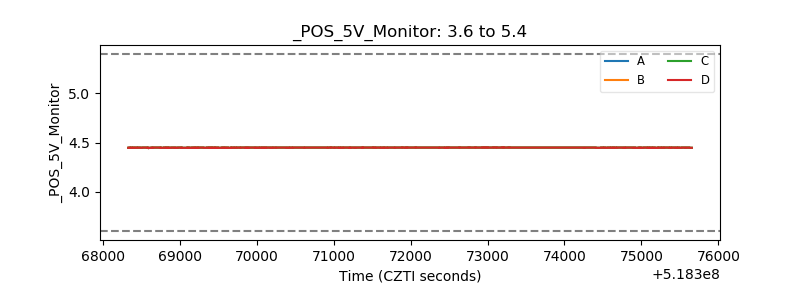 |
| _ROLL_ROT | 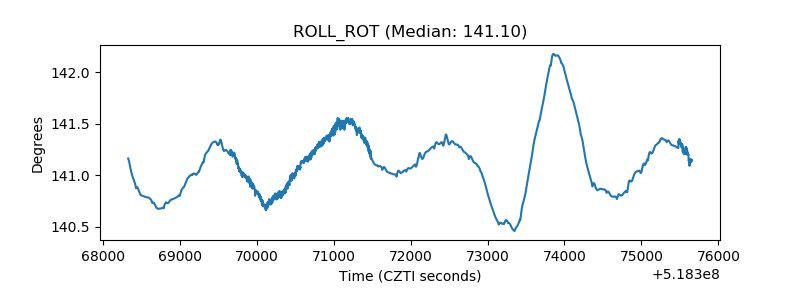 |
| _Roll_DEC | 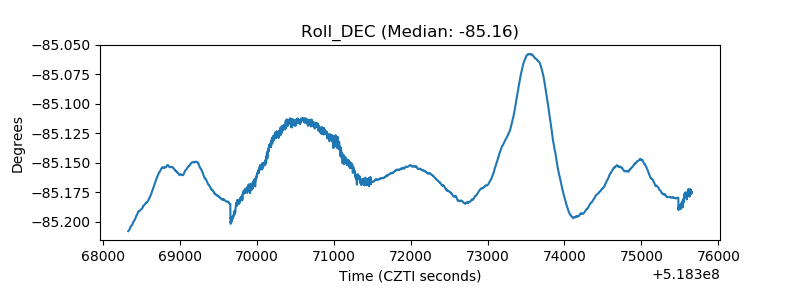 |
| _Roll_RA | 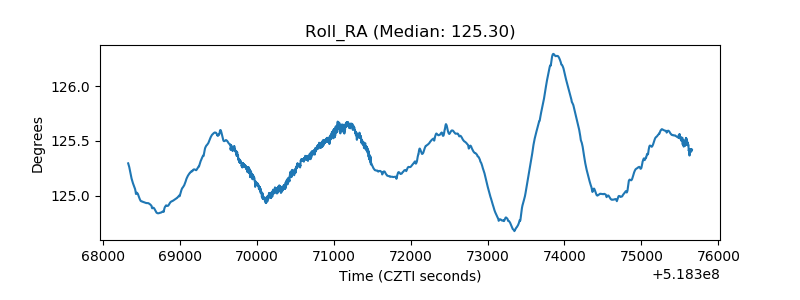 |
| Veto Counter | 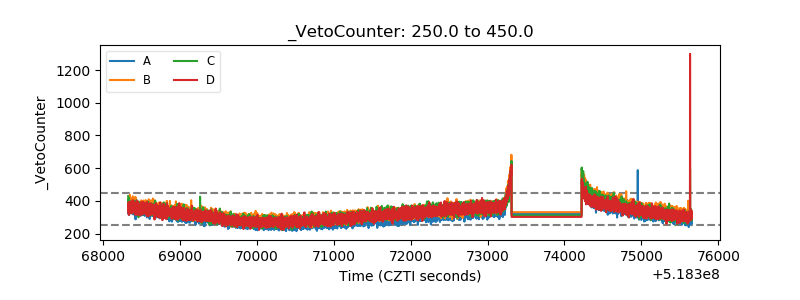 |