| Param | Original file | Final file |
|---|---|---|
| Filename | modeM0/AS1A14_083T16_9000006580_57827cztM0_level2.fits | modeM0/AS1A14_083T16_9000006580_57827cztM0_level2_quad_clean.evt |
| Size (bytes) | 627,408,000 | 109,872,000 |
| Size | 598.3 MB | 104.8 MB |
| Events in quadrant A | 3,845,980 | 802,322 |
| Events in quadrant B | 4,075,454 | 816,206 |
| Events in quadrant C | 9,300,928 | 558,165 |
| Events in quadrant D | 5,516,084 | 713,024 |
| Mode SS | |||
|---|---|---|---|
| Quadrant | BADHDUFLAG | Total packets | Discarded packets |
| A | 0 | 128 | 0 |
| B | 0 | 128 | 0 |
| C | 0 | 128 | 0 |
| D | 0 | 128 | 0 |
| Mode M0 | |||
|---|---|---|---|
| Quadrant | BADHDUFLAG | Total packets | Discarded packets |
| A | 0 | 16050 | 160 |
| B | 0 | 16856 | 179 |
| C | 0 | 32480 | 421 |
| D | 0 | 21166 | 265 |
| Mode M9 | |||
|---|---|---|---|
| Quadrant | BADHDUFLAG | Total packets | Discarded packets |
| A | 0 | 11 | 0 |
| B | 0 | 11 | 0 |
| C | 0 | 11 | 0 |
| D | 0 | 11 | 0 |
| Quadrant | Total seconds | Saturated seconds | Saturation percentage |
|---|---|---|---|
| A | 6269 | 358 | 5.710640% |
| B | 6272 | 431 | 6.871811% |
| C | 6258 | 2461 | 39.325663% |
| D | 6262 | 506 | 8.080485% |
Noise dominated data is calculated using 1-second bins in cleaned event files. If a bin has >2000 counts, and if more than 50% of those come from <1% of pixels, then it is considered to be noise-dominated and hence unusable.
| Quadrant | # 1 sec bins | Bins with >0 counts | Bins with >2000 counts | High rate bins dominated by noise | Noise dominated (total time) | Noise dominated (detector-on time) | Marked lightcurve |
|---|---|---|---|---|---|---|---|
| A | 7359 | 6284 | 326 | 326 | 4.43% | 5.19% | 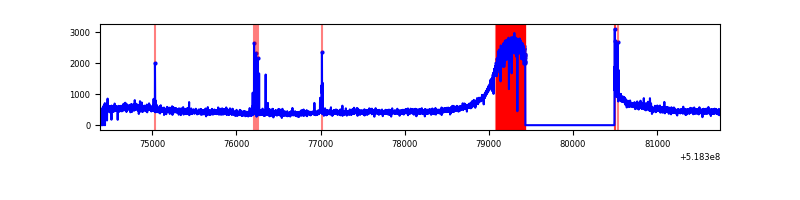 |
| B | 7369 | 6289 | 309 | 309 | 4.19% | 4.91% | 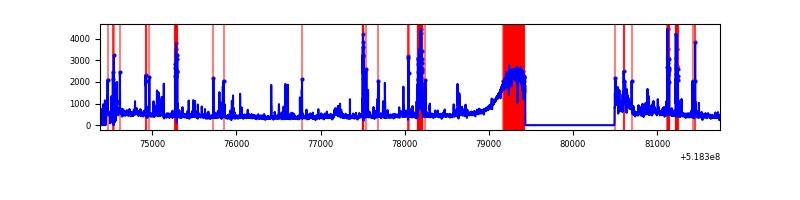 |
| C | 7349 | 6277 | 2011 | 2011 | 27.36% | 32.04% | 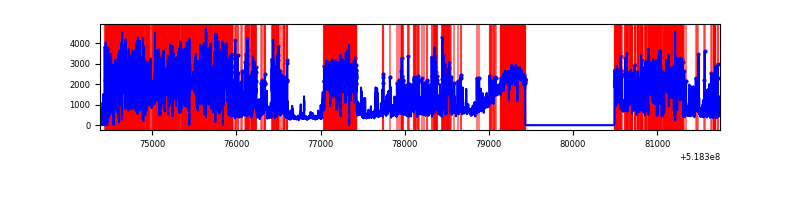 |
| D | 7369 | 6279 | 482 | 482 | 6.54% | 7.68% | 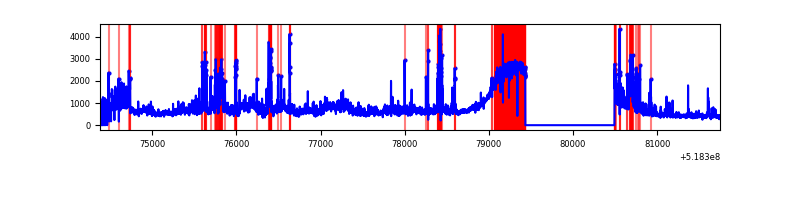 |
Top three noisy pixels from each quadrant. If the there are fewer than three noisy pixels in the level2.evt file, extra rows are filled as -1
| Pixel properties | Quadrant properties | ||||||
|---|---|---|---|---|---|---|---|
| Quadrant | DetID | PixID | Counts | Sigma | Mean | Median | Sigma |
| A | 3 | 14 | 213069 | 715.16 | 900 | 874 | 296.7 |
| A | 3 | 128 | 51742 | 171.44 | 900 | 874 | 296.7 |
| A | 3 | 48 | 30537 | 99.97 | 900 | 874 | 296.7 |
| B | 2 | 249 | 357930 | 1737.99 | 823 | 806 | 205.5 |
| B | 4 | 158 | 92276 | 445.15 | 823 | 806 | 205.5 |
| B | 0 | 63 | 90981 | 438.85 | 823 | 806 | 205.5 |
| C | 9 | 38 | 5514000 | 20660.44 | 726 | 704 | 266.9 |
| C | 15 | 224 | 675506 | 2528.74 | 726 | 704 | 266.9 |
| C | 6 | 223 | 114806 | 427.58 | 726 | 704 | 266.9 |
| D | 12 | 110 | 1347646 | 4161.24 | 881 | 822 | 323.7 |
| D | 2 | 249 | 197031 | 606.22 | 881 | 822 | 323.7 |
| D | 8 | 160 | 154296 | 474.18 | 881 | 822 | 323.7 |
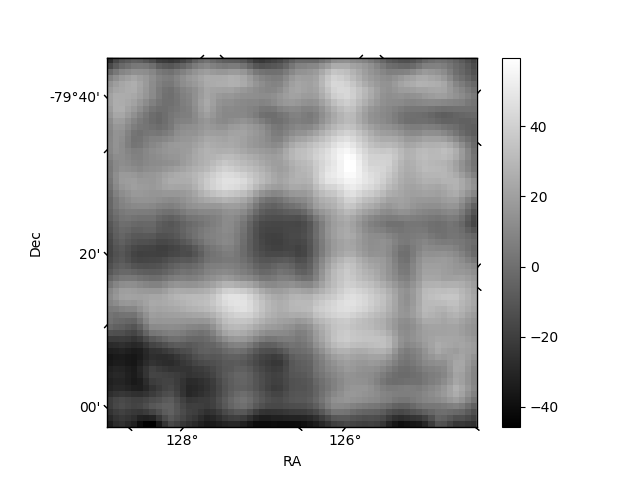
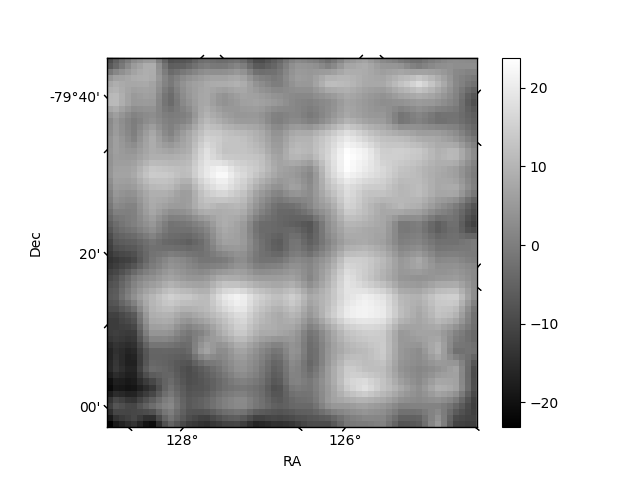
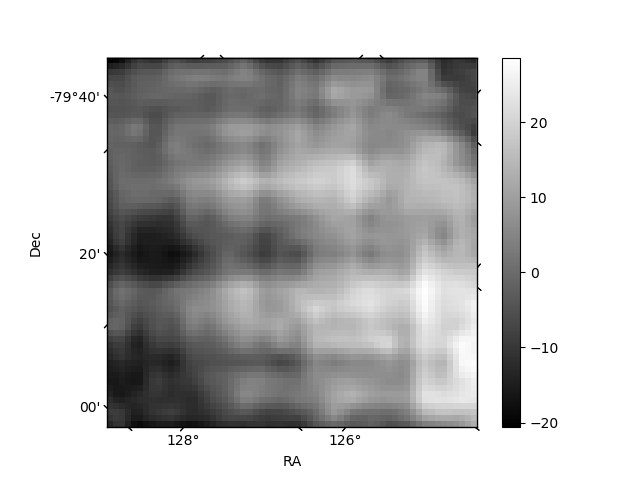
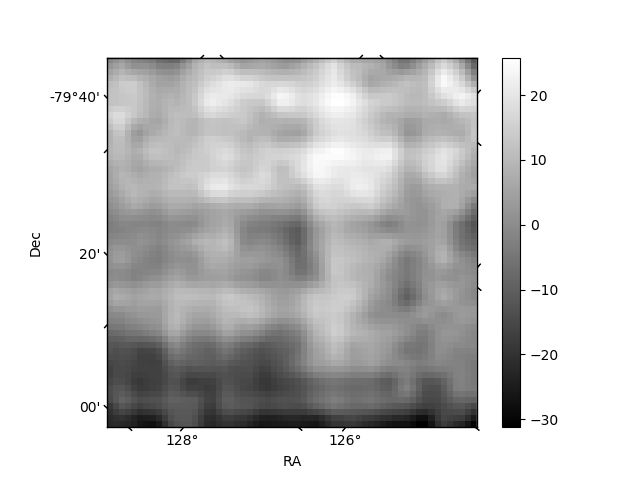
Histogram calculated using DETX and DETY for each event in the final _common_clean file
| Quadrant A | 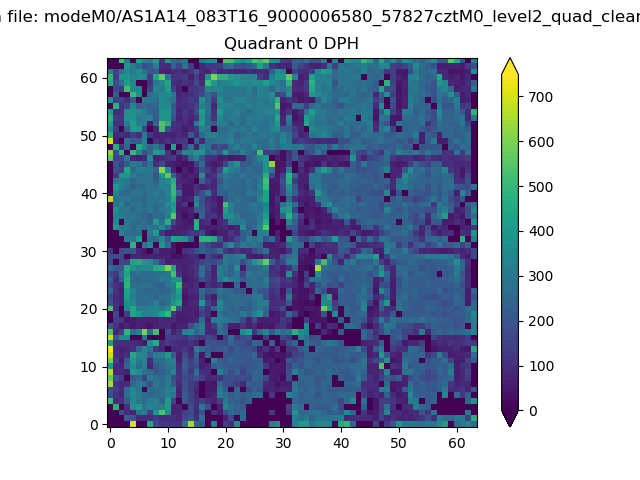 |
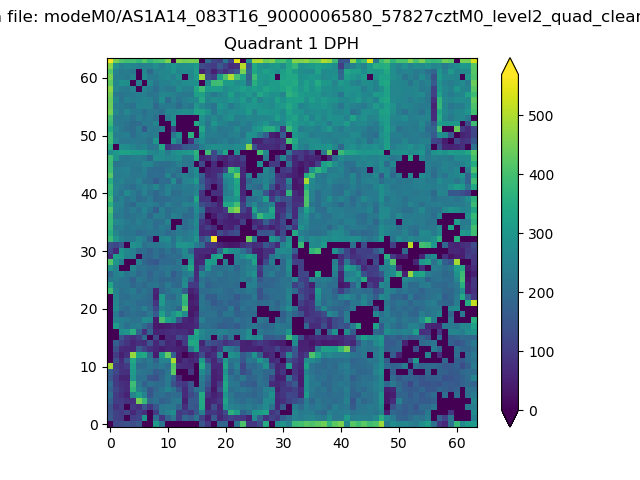 |
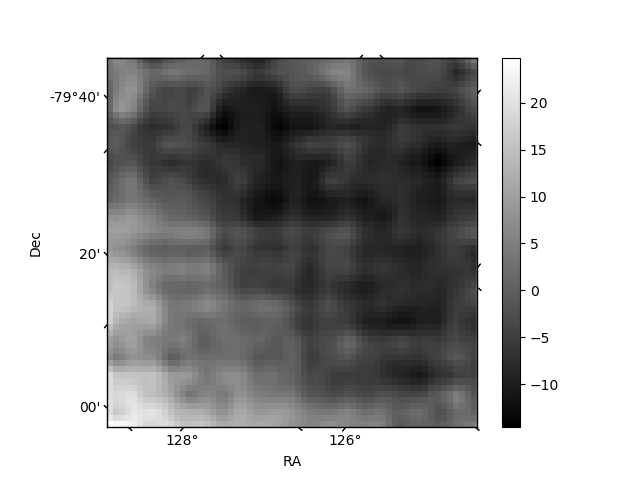
Quadrant B |
|---|---|---|---|
| Quadrant D | 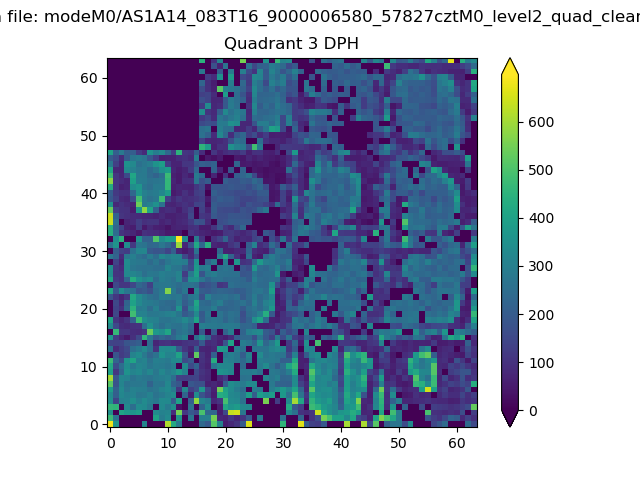 |
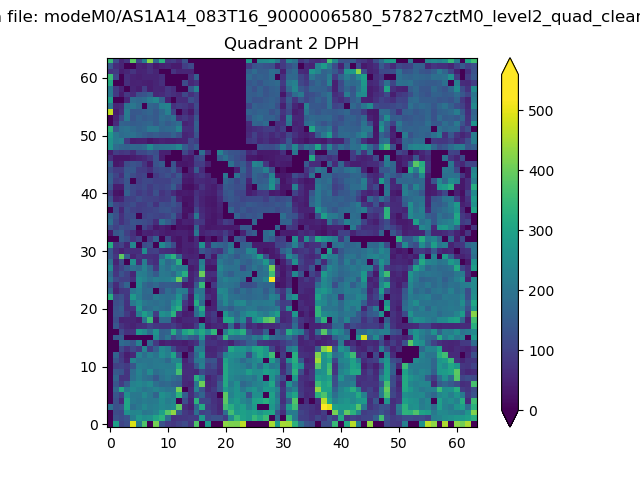 |
Quadrant C |
| Plot type | Count rate plots | Images |
|---|---|---|
| Comparison with Poisson distribution Blue bars denote a histogram of data divided into 1 sec bins. Red curve is a Poisson curve with rate = median count rate of data. |
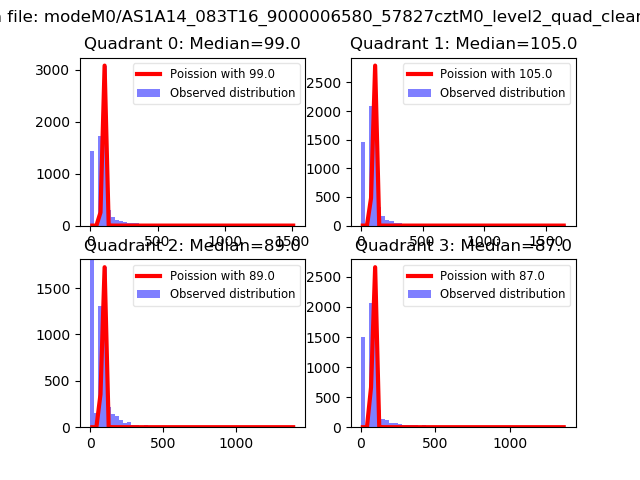 |
 |
| Quadrant-wise count rates Data is divided into 100 sec bins |
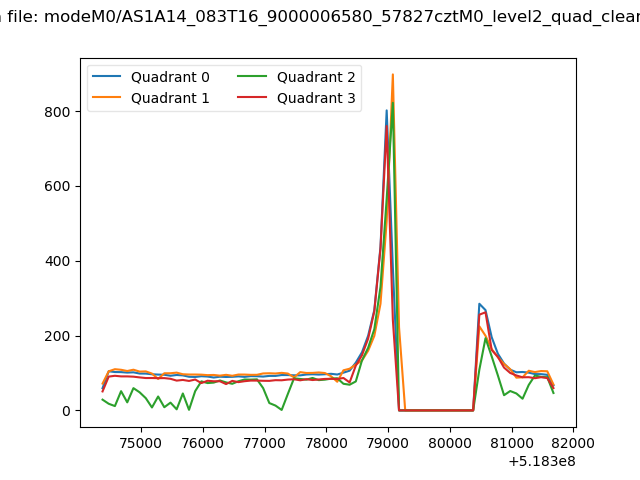 |
|
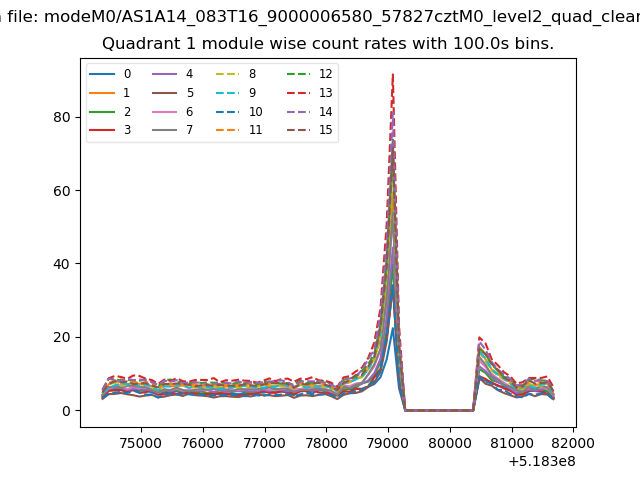
| Module-wise count rates for Quadrant A Data is divided into 100 sec bins |
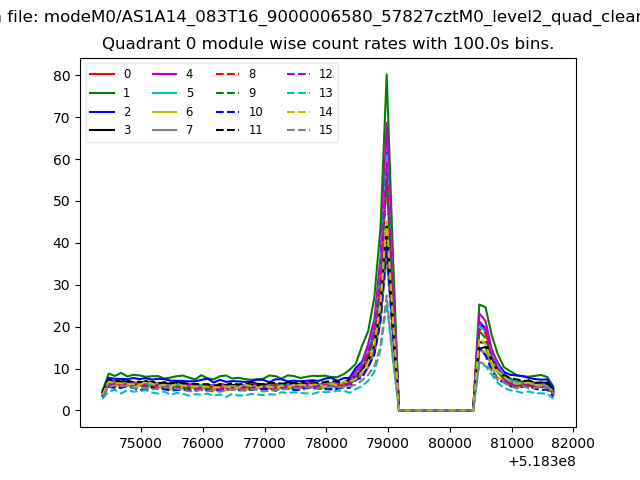 |
 |
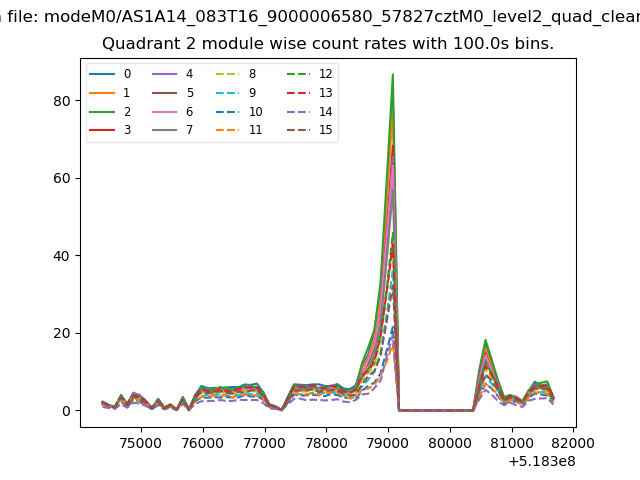
| Module-wise count rates for Quadrant B Data is divided into 100 sec bins |
 |
 |
| Module-wise count rates for Quadrant C Data is divided into 100 sec bins |
 |
 |
| Module-wise count rates for Quadrant D Data is divided into 100 sec bins |
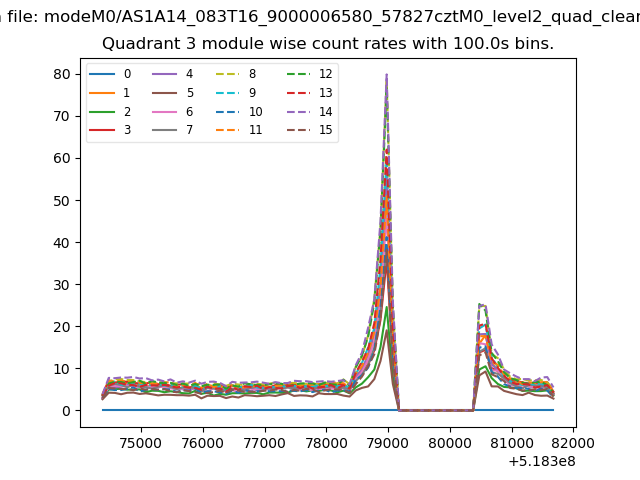 |
 |
| Parameter | Plot |
|---|---|
| CZT HV Monitor | 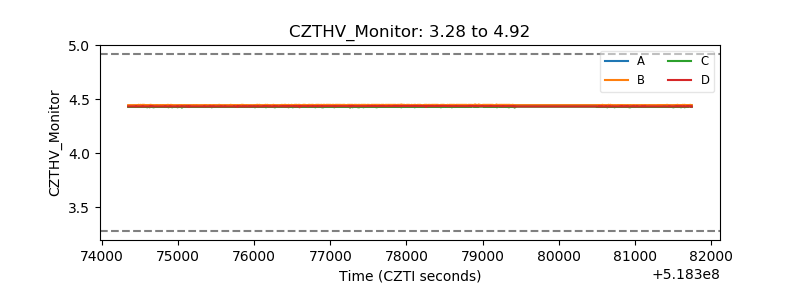 |
| D_VDD | 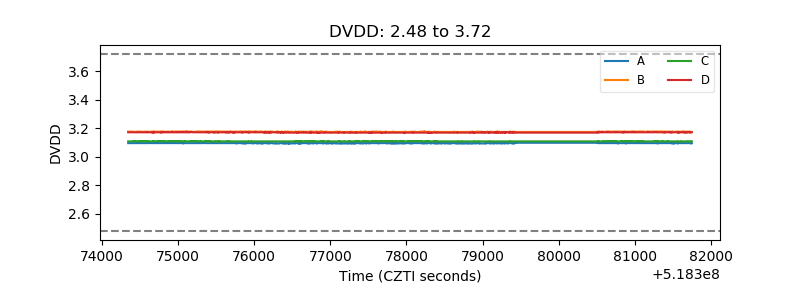 |
| Temperature 1 | 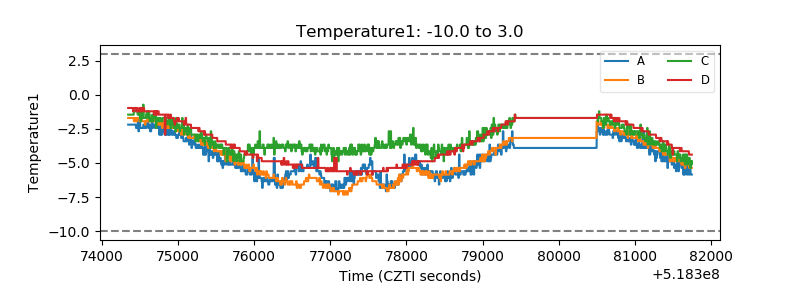 |
| Veto HV Monitor | 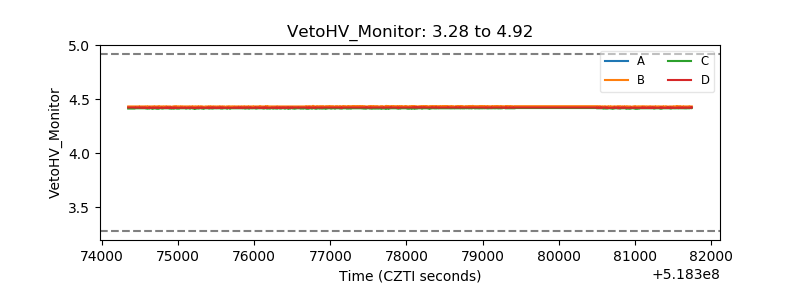 |
| Veto LLD | 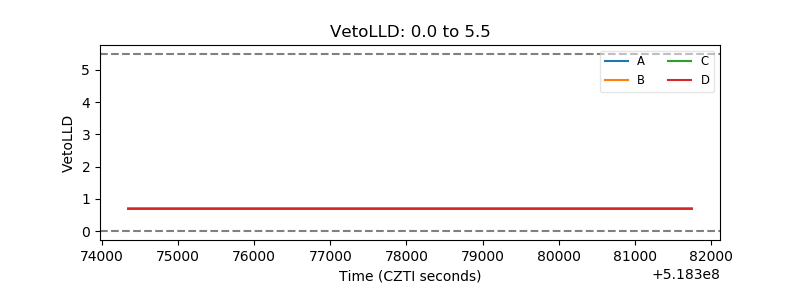 |
| Alpha Counter | 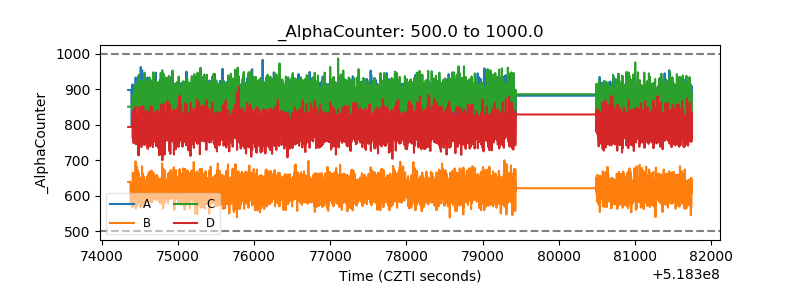 |
| _CPM_Rate | 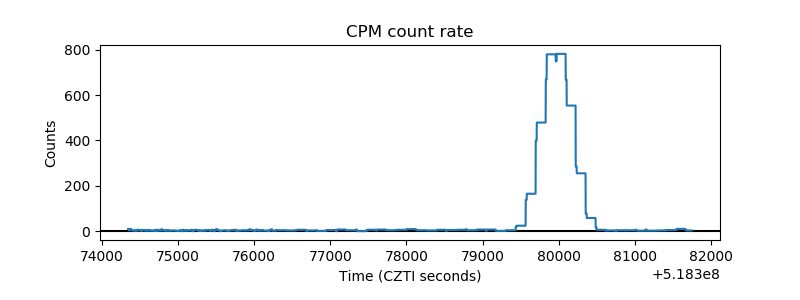 |
| CZT Counter | 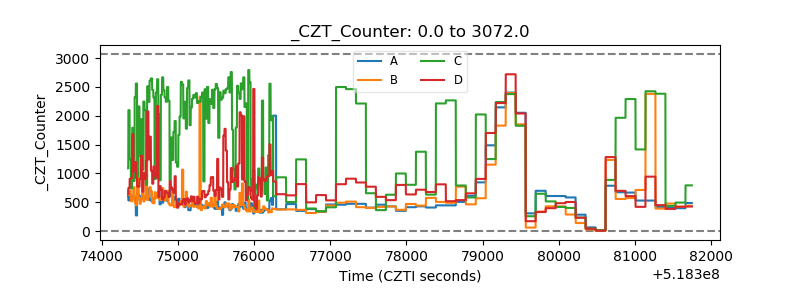 |
| +2.5 Volts monitor | 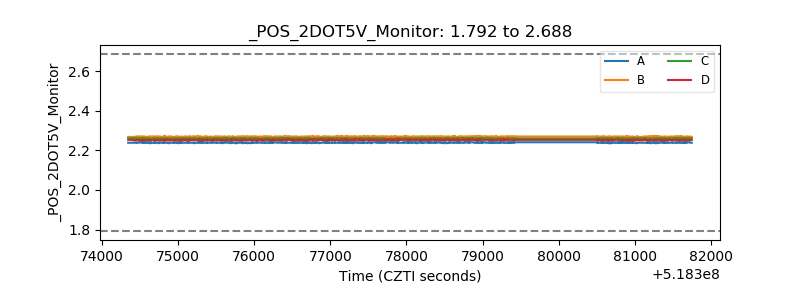 |
| +5 Volts monitor |  |
| _ROLL_ROT | 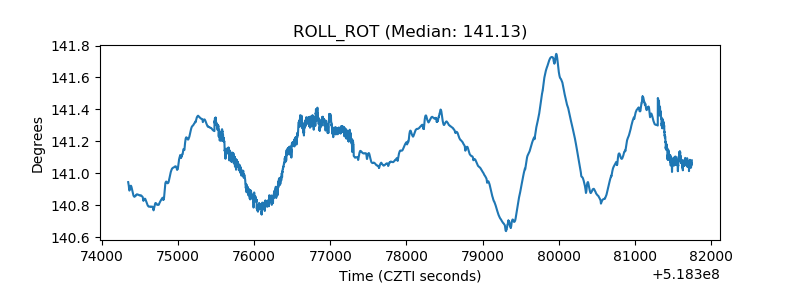 |
| _Roll_DEC | 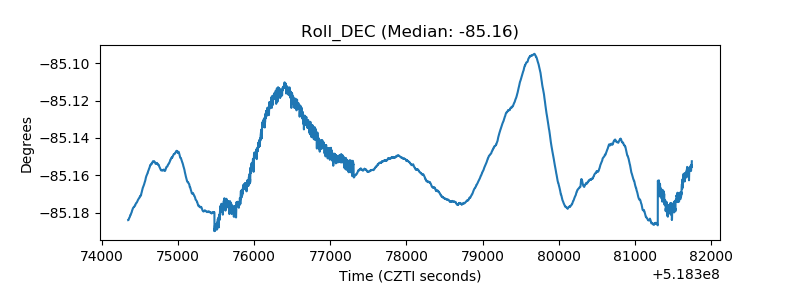 |
| _Roll_RA | 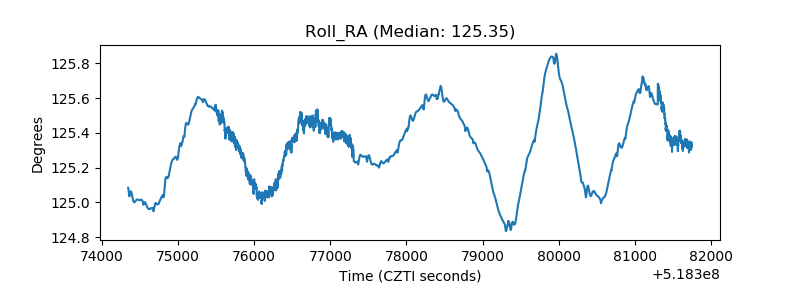 |
| Veto Counter | 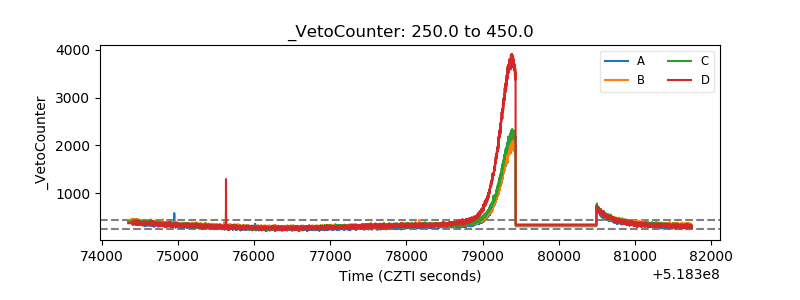 |