| Param | Original file | Final file |
|---|---|---|
| Filename | modeM0/AS1A14_083T16_9000006580_57828cztM0_level2.fits | modeM0/AS1A14_083T16_9000006580_57828cztM0_level2_quad_clean.evt |
| Size (bytes) | 517,878,720 | 92,442,240 |
| Size | 493.9 MB | 88.2 MB |
| Events in quadrant A | 2,902,568 | 655,819 |
| Events in quadrant B | 4,443,324 | 642,824 |
| Events in quadrant C | 6,895,195 | 516,112 |
| Events in quadrant D | 4,443,142 | 547,626 |
| Mode SS | |||
|---|---|---|---|
| Quadrant | BADHDUFLAG | Total packets | Discarded packets |
| A | 0 | 130 | 2 |
| B | 0 | 130 | 0 |
| C | 0 | 130 | 4 |
| D | 0 | 130 | 2 |
| Mode M0 | |||
|---|---|---|---|
| Quadrant | BADHDUFLAG | Total packets | Discarded packets |
| A | 0 | 13446 | 326 |
| B | 0 | 17957 | 365 |
| C | 0 | 25465 | 586 |
| D | 0 | 18263 | 522 |
| Mode M9 | |||
|---|---|---|---|
| Quadrant | BADHDUFLAG | Total packets | Discarded packets |
| A | 0 | 12 | 1 |
| B | 0 | 12 | 0 |
| C | 0 | 12 | 0 |
| D | 0 | 12 | 0 |
| Quadrant | Total seconds | Saturated seconds | Saturation percentage |
|---|---|---|---|
| A | 6266 | 23 | 0.367060% |
| B | 6259 | 478 | 7.637003% |
| C | 6247 | 1103 | 17.656475% |
| D | 6245 | 429 | 6.869496% |
Noise dominated data is calculated using 1-second bins in cleaned event files. If a bin has >2000 counts, and if more than 50% of those come from <1% of pixels, then it is considered to be noise-dominated and hence unusable.
| Quadrant | # 1 sec bins | Bins with >0 counts | Bins with >2000 counts | High rate bins dominated by noise | Noise dominated (total time) | Noise dominated (detector-on time) | Marked lightcurve |
|---|---|---|---|---|---|---|---|
| A | 7482 | 6288 | 5 | 5 | 0.07% | 0.08% | 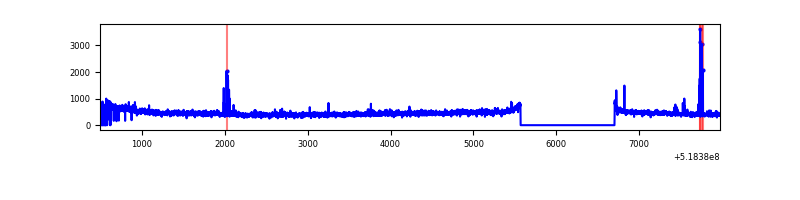 |
| B | 7482 | 6284 | 332 | 332 | 4.44% | 5.28% | 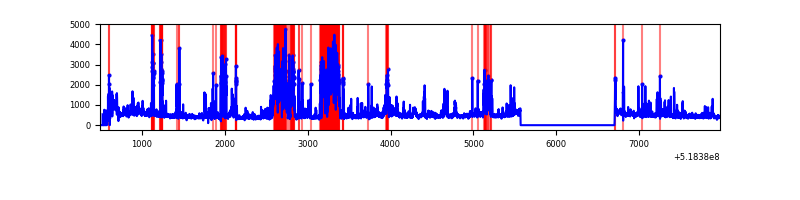 |
| C | 7464 | 6277 | 881 | 881 | 11.80% | 14.04% | 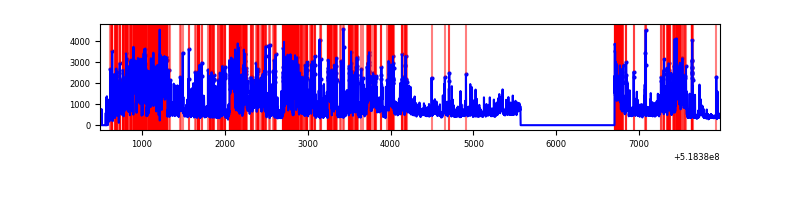 |
| D | 7482 | 6270 | 431 | 431 | 5.76% | 6.87% | 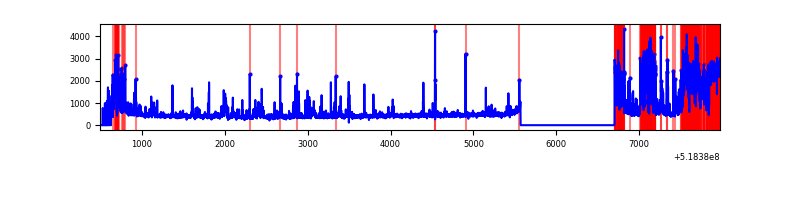 |
Top three noisy pixels from each quadrant. If the there are fewer than three noisy pixels in the level2.evt file, extra rows are filled as -1
| Pixel properties | Quadrant properties | ||||||
|---|---|---|---|---|---|---|---|
| Quadrant | DetID | PixID | Counts | Sigma | Mean | Median | Sigma |
| A | 3 | 14 | 177334 | 1037.62 | 677 | 661 | 170.3 |
| A | 3 | 245 | 46027 | 266.44 | 677 | 661 | 170.3 |
| A | 3 | 128 | 30609 | 175.89 | 677 | 661 | 170.3 |
| B | 4 | 142 | 1223265 | 8820.91 | 649 | 625 | 138.6 |
| B | 2 | 249 | 229241 | 1649.38 | 649 | 625 | 138.6 |
| B | 4 | 158 | 94960 | 680.59 | 649 | 625 | 138.6 |
| C | 9 | 38 | 3645885 | 21926.79 | 602 | 594 | 166.2 |
| C | 15 | 224 | 751139 | 4514.6 | 602 | 594 | 166.2 |
| C | 12 | 252 | 45543 | 270.37 | 602 | 594 | 166.2 |
| D | 12 | 110 | 886037 | 4863.98 | 631 | 601 | 182.0 |
| D | 2 | 249 | 441084 | 2419.71 | 631 | 601 | 182.0 |
| D | 8 | 160 | 200515 | 1098.19 | 631 | 601 | 182.0 |
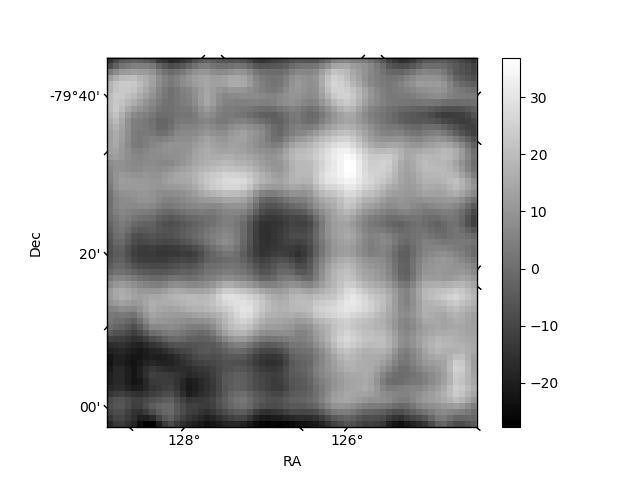
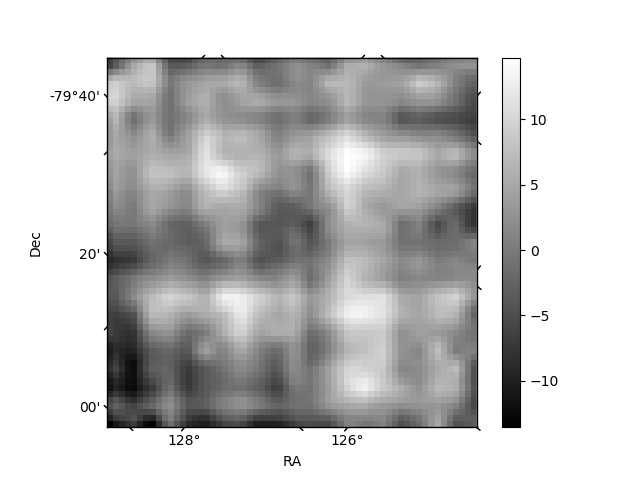
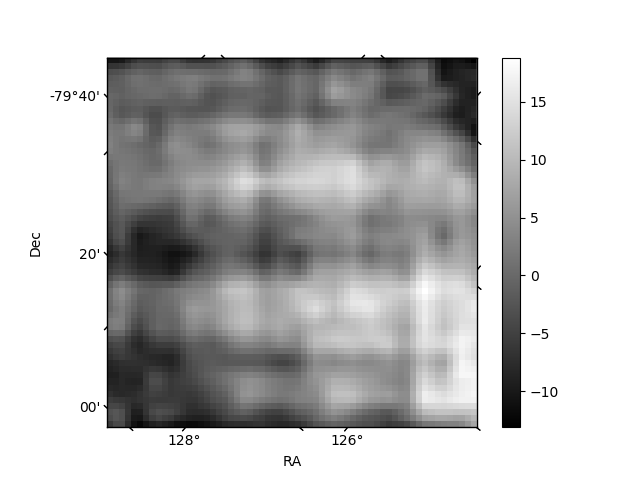
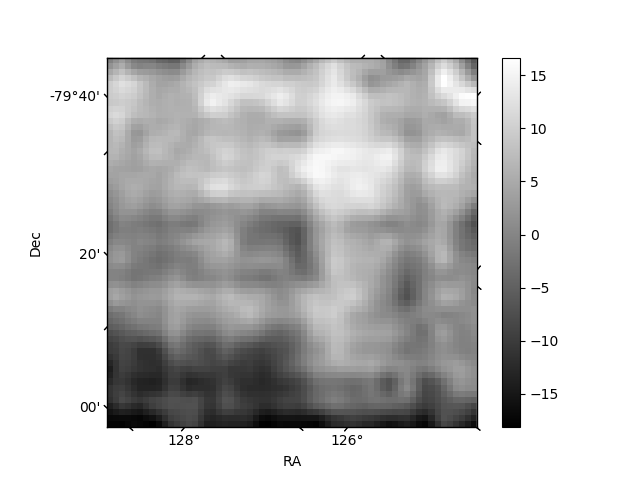
Histogram calculated using DETX and DETY for each event in the final _common_clean file
| Quadrant A | 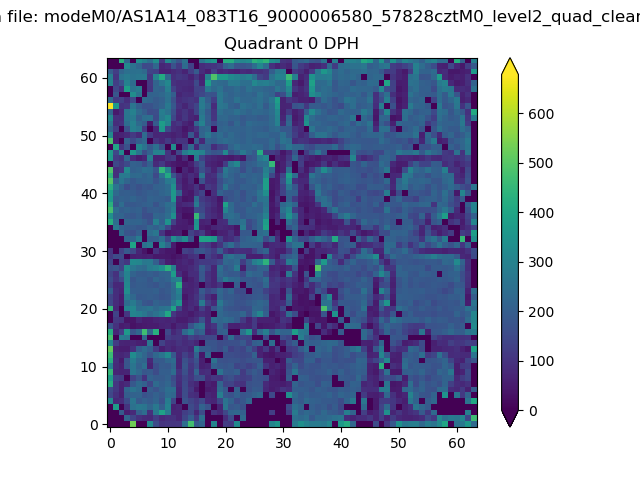 |
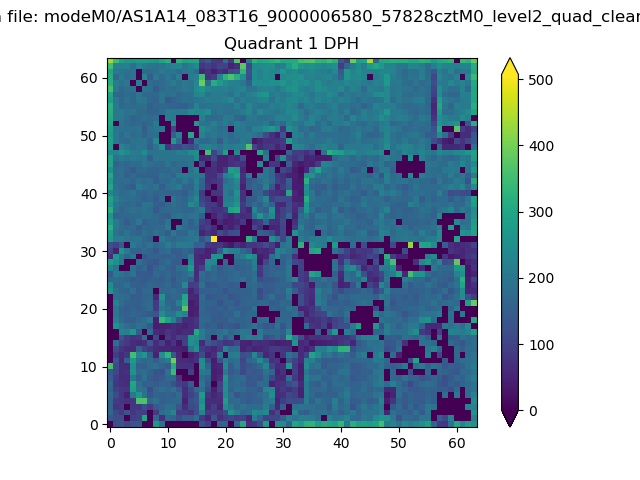 |
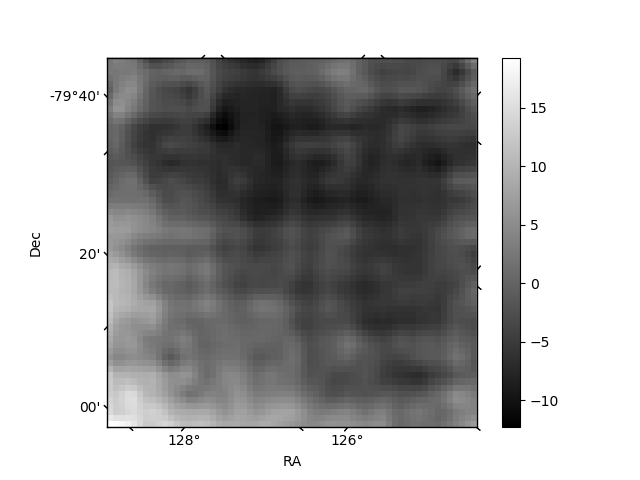
Quadrant B |
|---|---|---|---|
| Quadrant D | 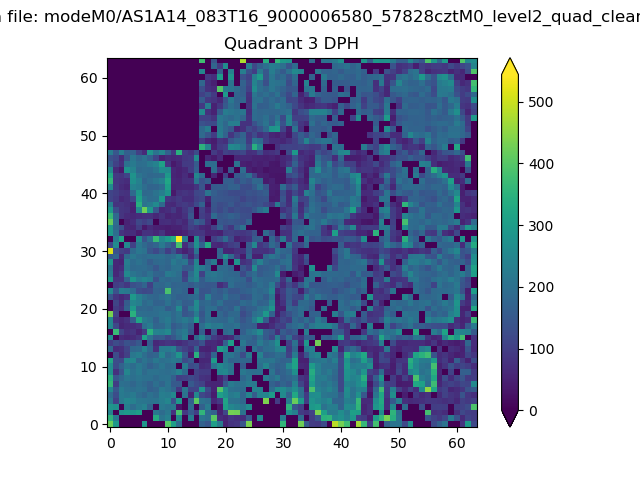 |
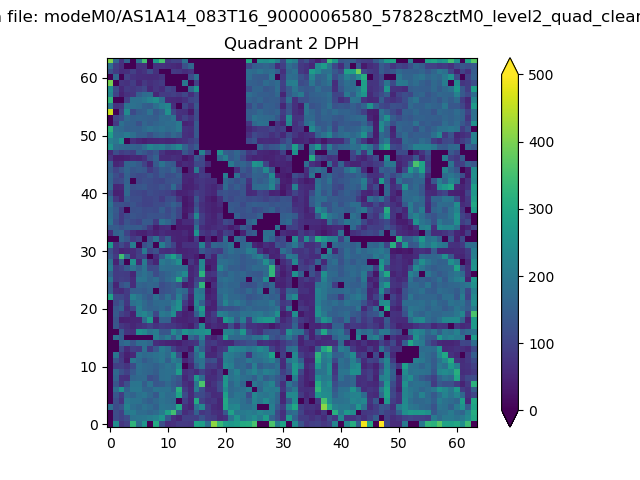 |
Quadrant C |
| Plot type | Count rate plots | Images |
|---|---|---|
| Comparison with Poisson distribution Blue bars denote a histogram of data divided into 1 sec bins. Red curve is a Poisson curve with rate = median count rate of data. |
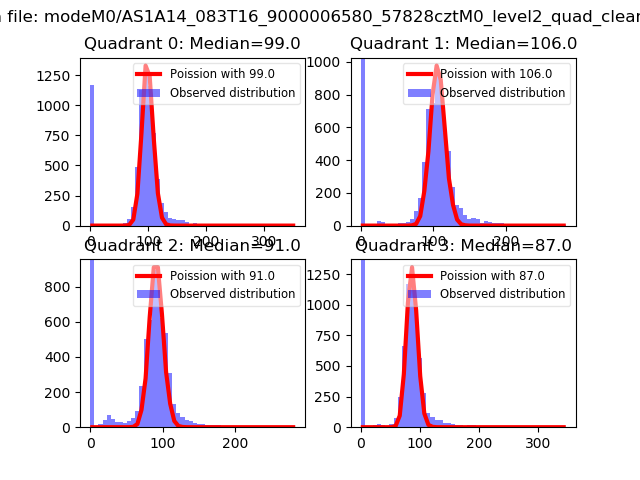 |
 |
| Quadrant-wise count rates Data is divided into 100 sec bins |
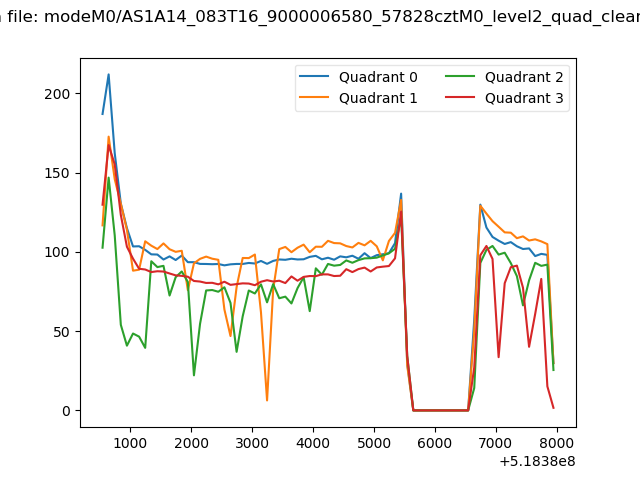 |
|
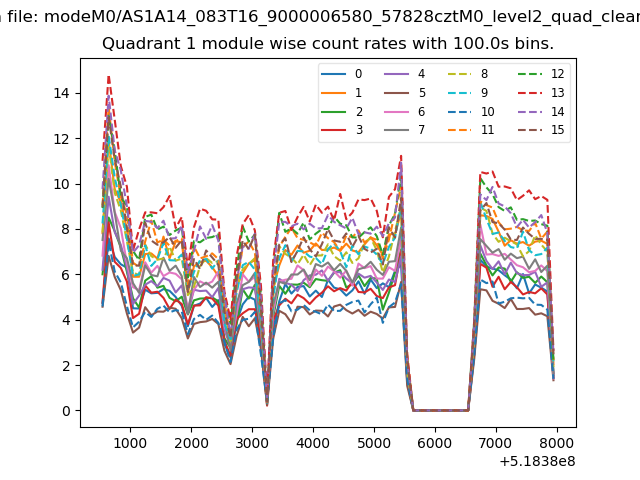
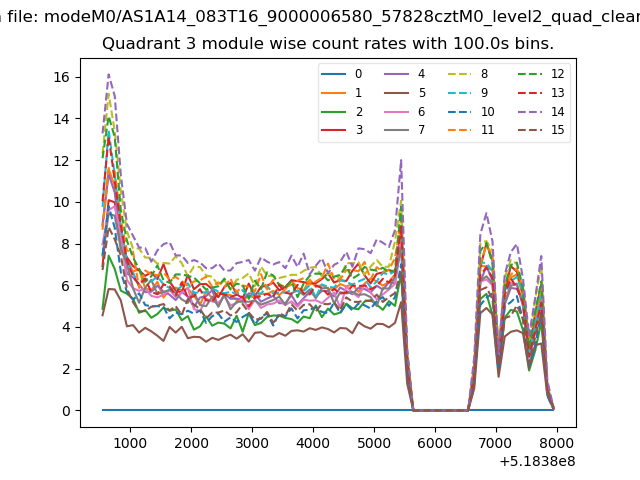
| Module-wise count rates for Quadrant A Data is divided into 100 sec bins |
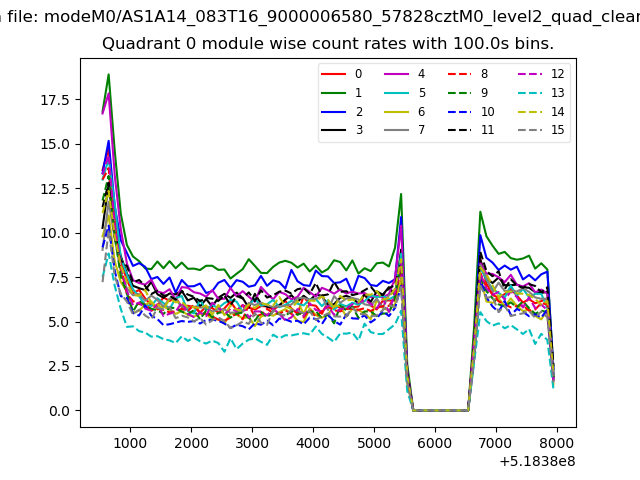 |
 |
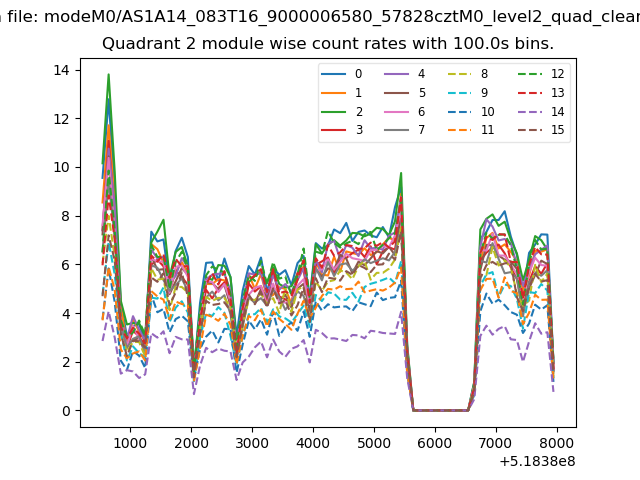
| Module-wise count rates for Quadrant B Data is divided into 100 sec bins |
 |
 |
| Module-wise count rates for Quadrant C Data is divided into 100 sec bins |
 |
 |
| Module-wise count rates for Quadrant D Data is divided into 100 sec bins |
 |
 |
| Parameter | Plot |
|---|---|
| CZT HV Monitor | 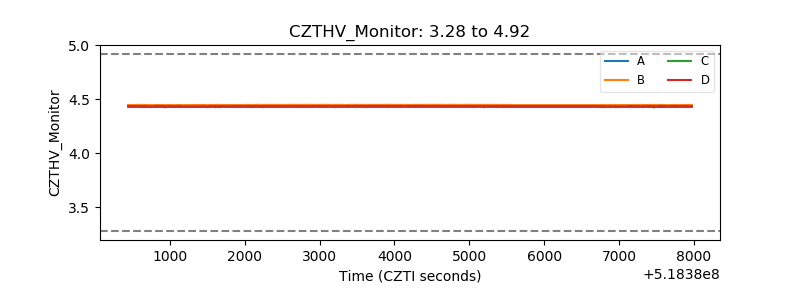 |
| D_VDD | 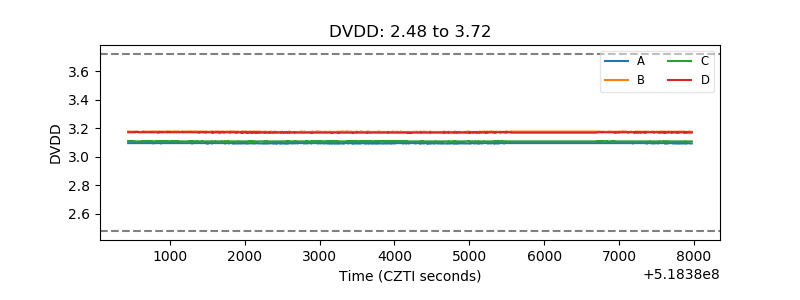 |
| Temperature 1 | 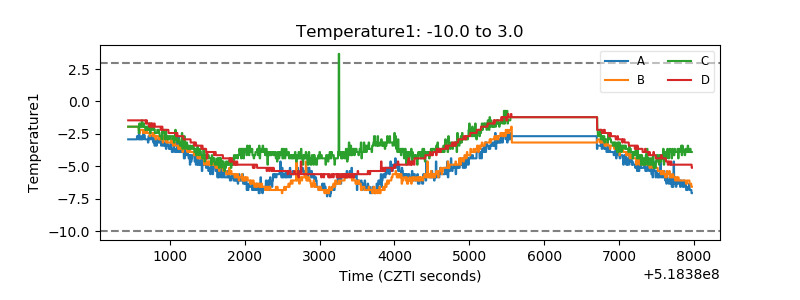 |
| Veto HV Monitor | 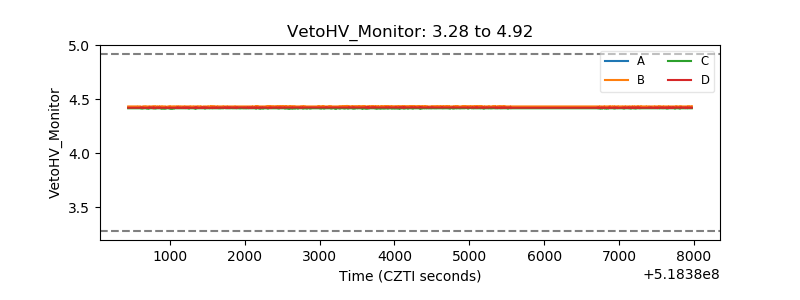 |
| Veto LLD | 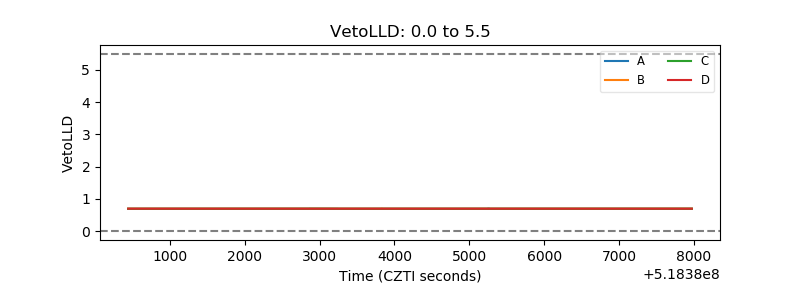 |
| Alpha Counter | 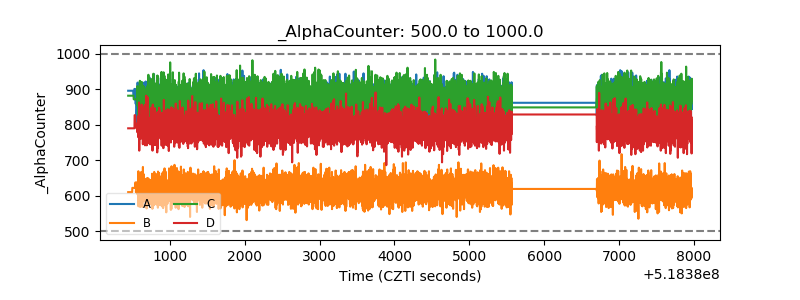 |
| _CPM_Rate | 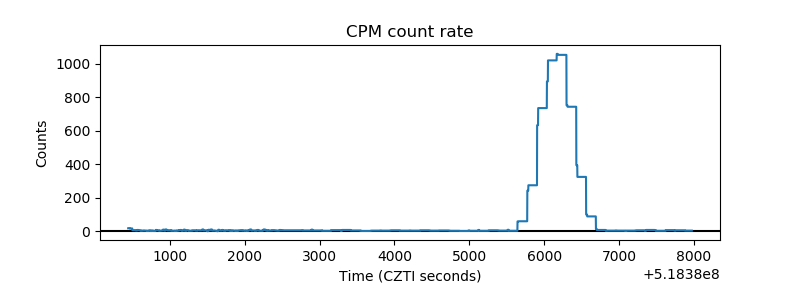 |
| CZT Counter | 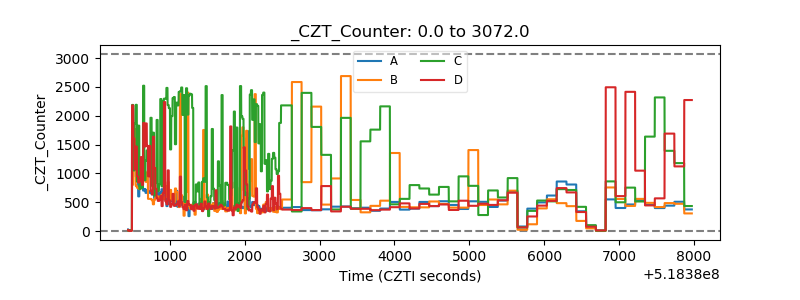 |
| +2.5 Volts monitor |  |
| +5 Volts monitor |  |
| _ROLL_ROT | 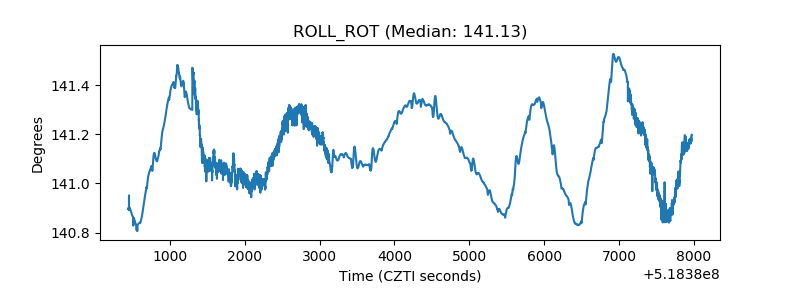 |
| _Roll_DEC | 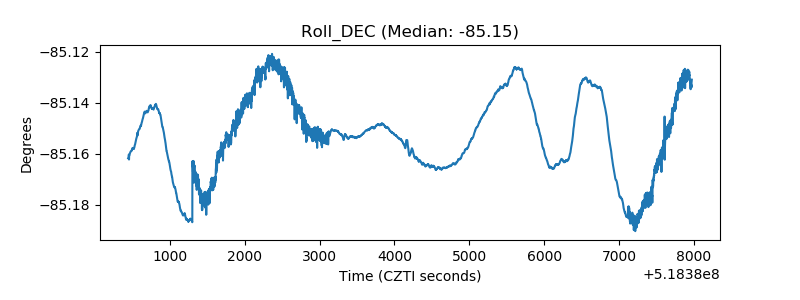 |
| _Roll_RA | 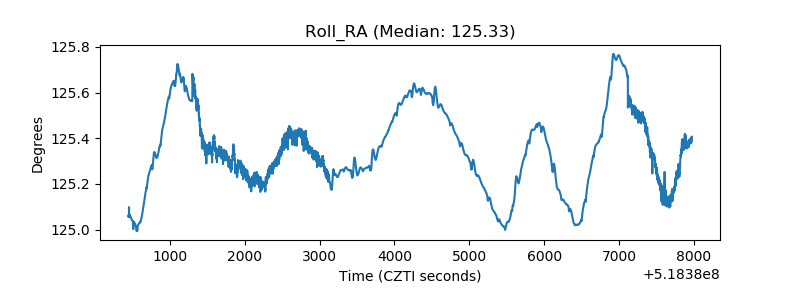 |
| Veto Counter | 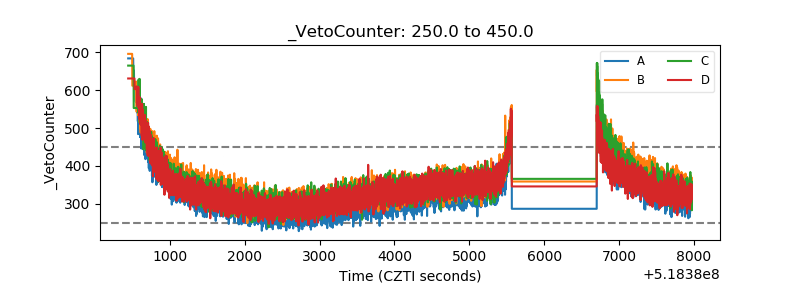 |