| Param | Original file | Final file |
|---|---|---|
| Filename | modeM0/AS1A14_083T16_9000006580_57829cztM0_level2.fits | modeM0/AS1A14_083T16_9000006580_57829cztM0_level2_quad_clean.evt |
| Size (bytes) | 691,539,840 | 88,963,200 |
| Size | 659.5 MB | 84.8 MB |
| Events in quadrant A | 3,453,165 | 635,048 |
| Events in quadrant B | 3,134,345 | 695,065 |
| Events in quadrant C | 8,618,957 | 455,929 |
| Events in quadrant D | 9,898,979 | 462,474 |
| Mode SS | |||
|---|---|---|---|
| Quadrant | BADHDUFLAG | Total packets | Discarded packets |
| A | 0 | 132 | 0 |
| B | 0 | 132 | 0 |
| C | 0 | 132 | 0 |
| D | 0 | 132 | 0 |
| Mode M0 | |||
|---|---|---|---|
| Quadrant | BADHDUFLAG | Total packets | Discarded packets |
| A | 0 | 15061 | 2 |
| B | 0 | 13980 | 2 |
| C | 0 | 30087 | 2 |
| D | 0 | 33808 | 5 |
| Mode M9 | |||
|---|---|---|---|
| Quadrant | BADHDUFLAG | Total packets | Discarded packets |
| A | 0 | 15 | 0 |
| B | 0 | 16 | 0 |
| C | 0 | 16 | 0 |
| D | 0 | 16 | 0 |
| Quadrant | Total seconds | Saturated seconds | Saturation percentage |
|---|---|---|---|
| A | 6370 | 269 | 4.222920% |
| B | 6370 | 108 | 1.695447% |
| C | 6370 | 1974 | 30.989011% |
| D | 6369 | 1568 | 24.619249% |
Noise dominated data is calculated using 1-second bins in cleaned event files. If a bin has >2000 counts, and if more than 50% of those come from <1% of pixels, then it is considered to be noise-dominated and hence unusable.
| Quadrant | # 1 sec bins | Bins with >0 counts | Bins with >2000 counts | High rate bins dominated by noise | Noise dominated (total time) | Noise dominated (detector-on time) | Marked lightcurve |
|---|---|---|---|---|---|---|---|
| A | 7540 | 6371 | 120 | 120 | 1.59% | 1.88% | 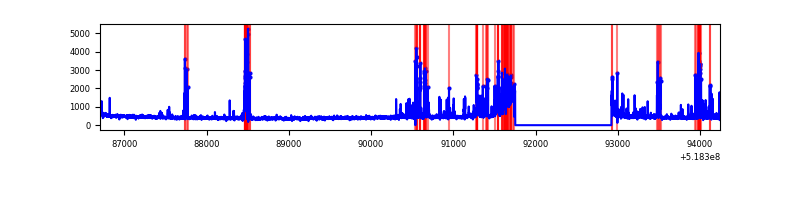 |
| B | 7540 | 6371 | 23 | 23 | 0.31% | 0.36% | 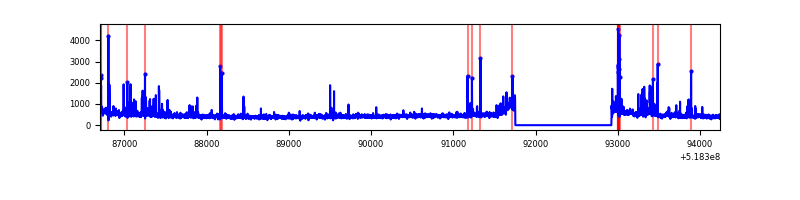 |
| C | 7540 | 6371 | 1540 | 1540 | 20.42% | 24.17% | 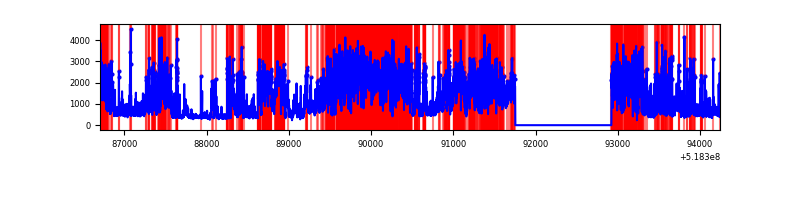 |
| D | 7539 | 6370 | 1774 | 1774 | 23.53% | 27.85% | 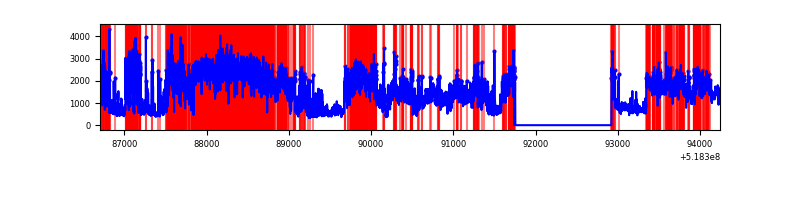 |
Top three noisy pixels from each quadrant. If the there are fewer than three noisy pixels in the level2.evt file, extra rows are filled as -1
| Pixel properties | Quadrant properties | ||||||
|---|---|---|---|---|---|---|---|
| Quadrant | DetID | PixID | Counts | Sigma | Mean | Median | Sigma |
| A | 10 | 251 | 572651 | 3266.97 | 689 | 673 | 175.1 |
| A | 3 | 250 | 94721 | 537.17 | 689 | 673 | 175.1 |
| A | 3 | 245 | 63228 | 357.3 | 689 | 673 | 175.1 |
| B | 5 | 185 | 82198 | 554.36 | 686 | 661 | 147.1 |
| B | 4 | 158 | 76429 | 515.14 | 686 | 661 | 147.1 |
| B | 0 | 63 | 66938 | 450.61 | 686 | 661 | 147.1 |
| C | 9 | 38 | 5321793 | 32060.28 | 591 | 586 | 166.0 |
| C | 15 | 224 | 721402 | 4342.92 | 591 | 586 | 166.0 |
| C | 14 | 254 | 114894 | 688.71 | 591 | 586 | 166.0 |
| D | 12 | 110 | 6149437 | 33747.72 | 622 | 590 | 182.2 |
| D | 2 | 249 | 414033 | 2269.17 | 622 | 590 | 182.2 |
| D | 8 | 160 | 402094 | 2203.64 | 622 | 590 | 182.2 |
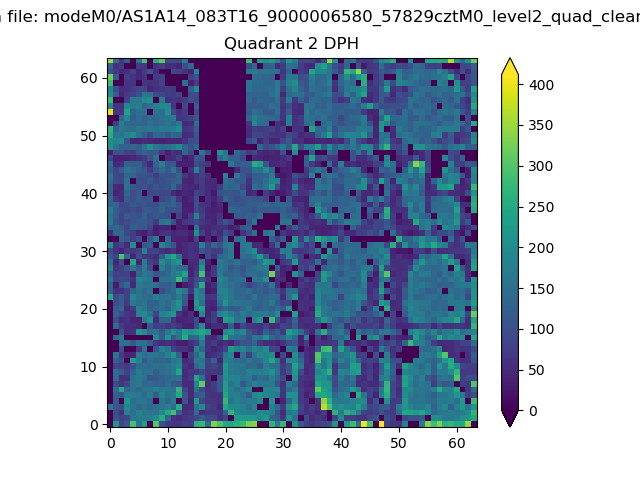
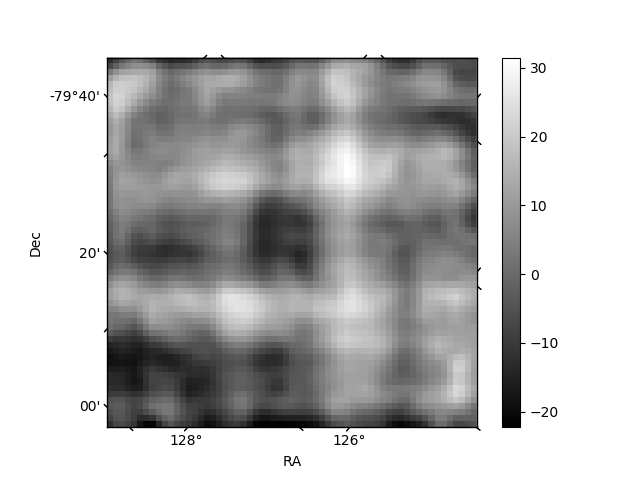
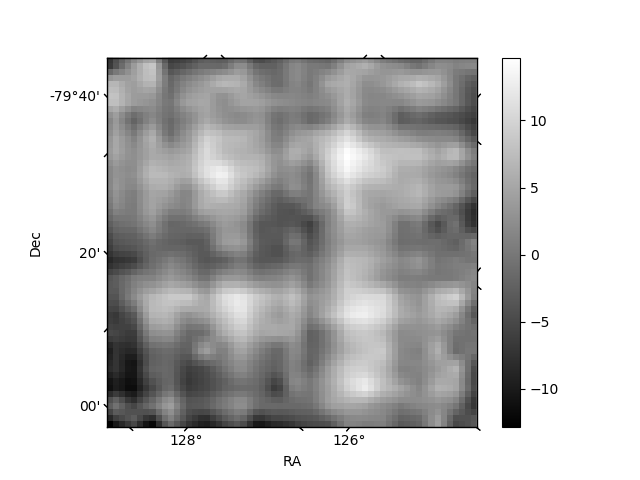
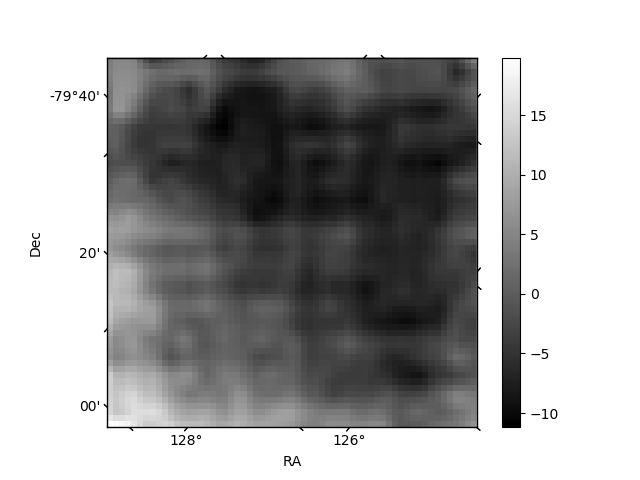
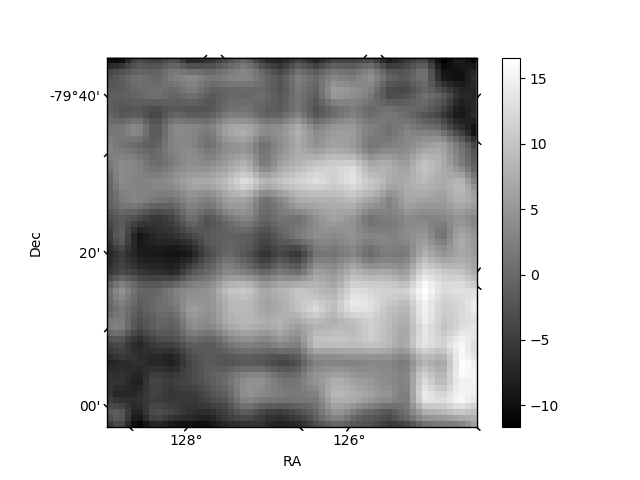
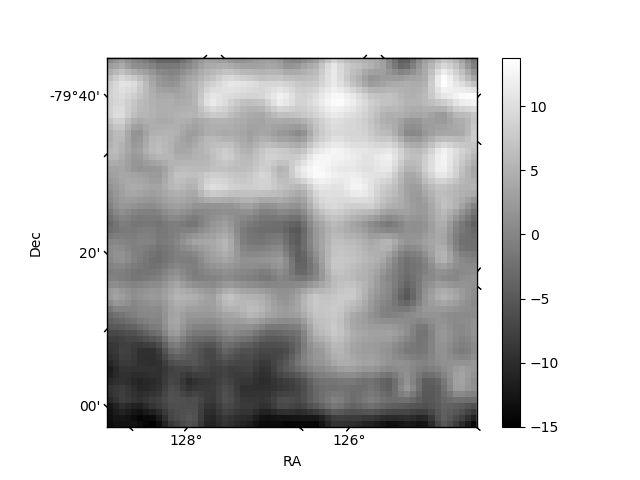
Histogram calculated using DETX and DETY for each event in the final _common_clean file
| Quadrant A | 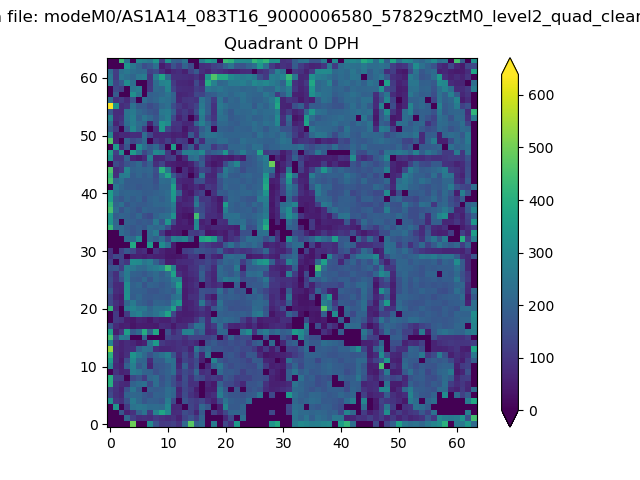 |
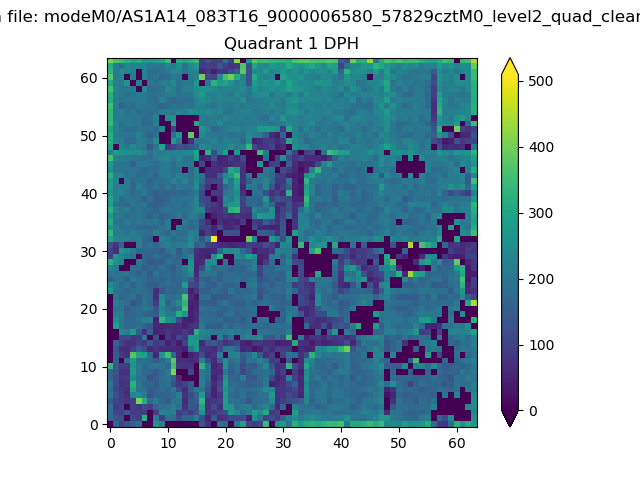 |
Quadrant B |
|---|---|---|---|
| Quadrant D | 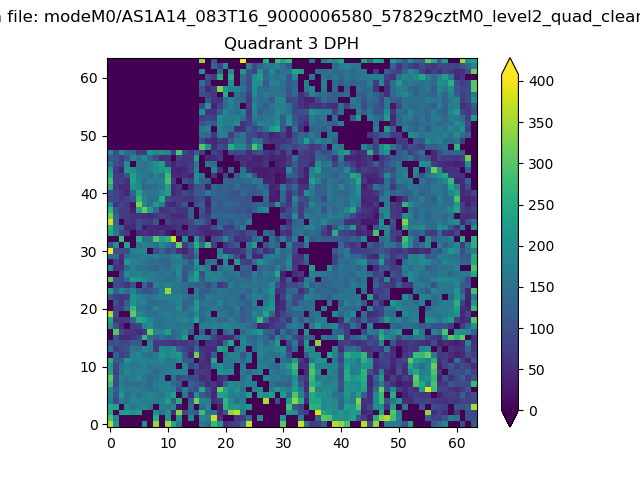 |
 |
Quadrant C |
| Plot type | Count rate plots | Images |
|---|---|---|
| Comparison with Poisson distribution Blue bars denote a histogram of data divided into 1 sec bins. Red curve is a Poisson curve with rate = median count rate of data. |
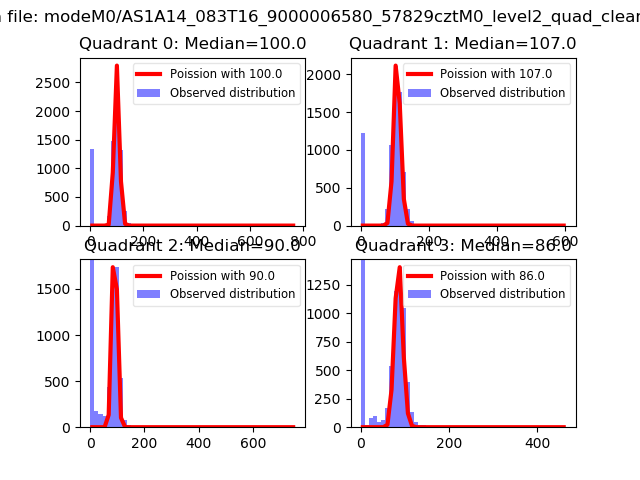 |
 |
| Quadrant-wise count rates Data is divided into 100 sec bins |
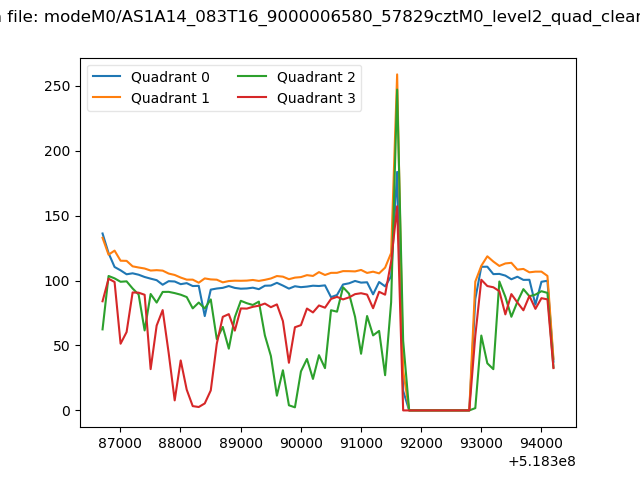 |
|
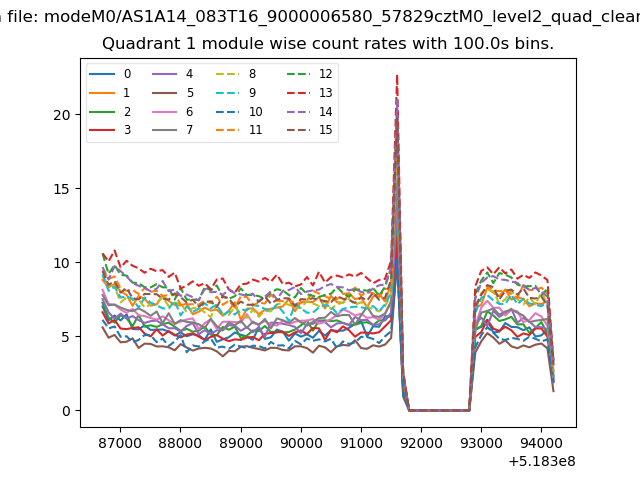
| Module-wise count rates for Quadrant A Data is divided into 100 sec bins |
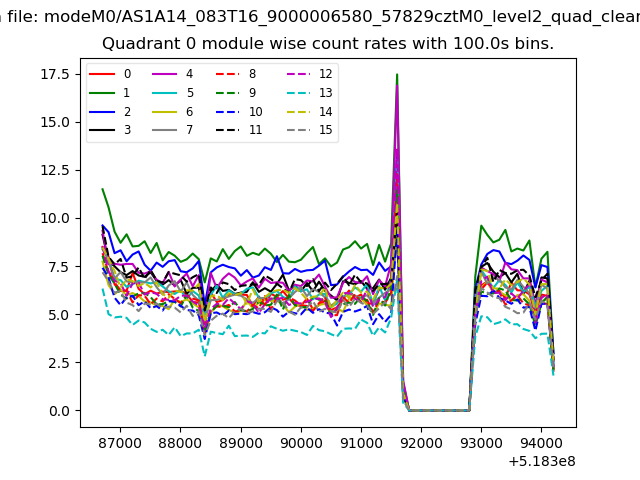 |
 |
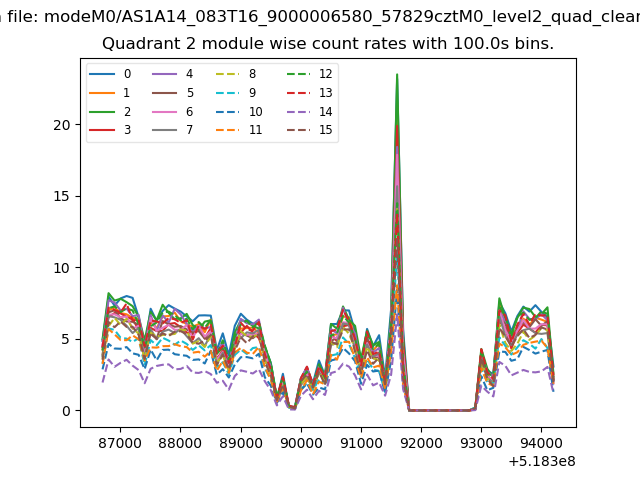
| Module-wise count rates for Quadrant B Data is divided into 100 sec bins |
 |
 |
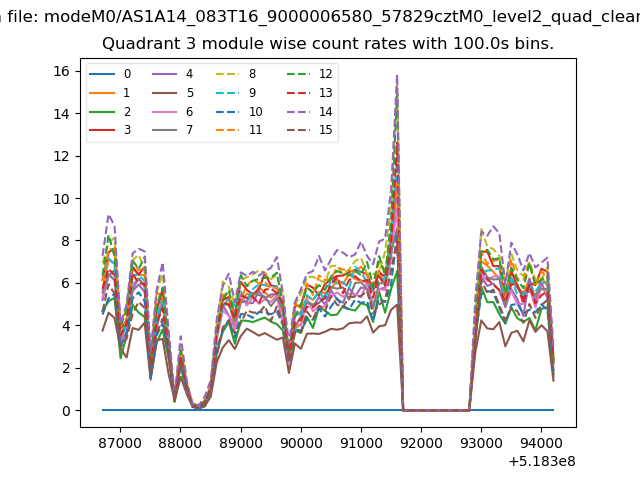
| Module-wise count rates for Quadrant C Data is divided into 100 sec bins |
 |
 |
| Module-wise count rates for Quadrant D Data is divided into 100 sec bins |
 |
 |
| Parameter | Plot |
|---|---|
| CZT HV Monitor | 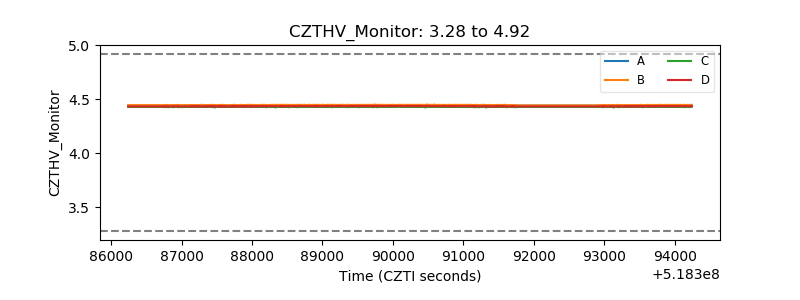 |
| D_VDD | 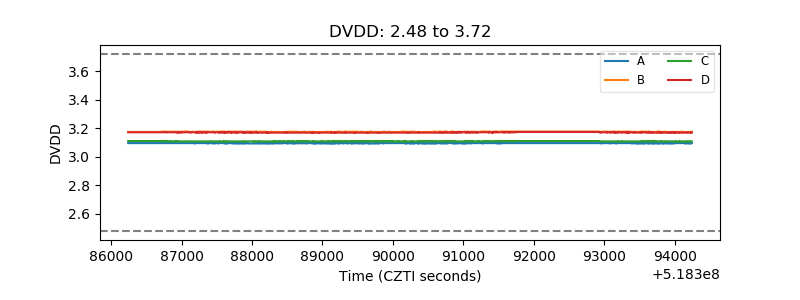 |
| Temperature 1 | 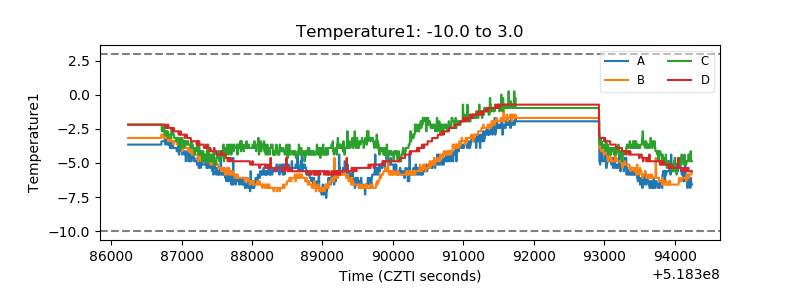 |
| Veto HV Monitor | 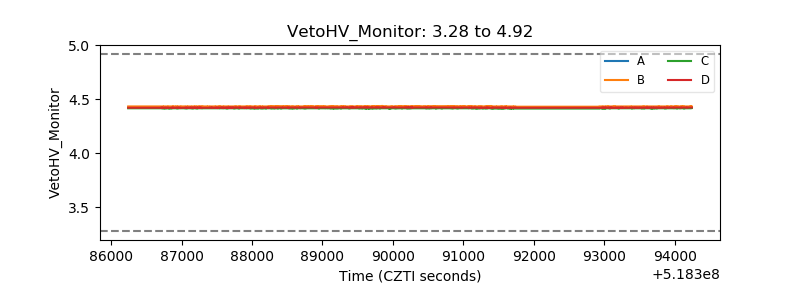 |
| Veto LLD | 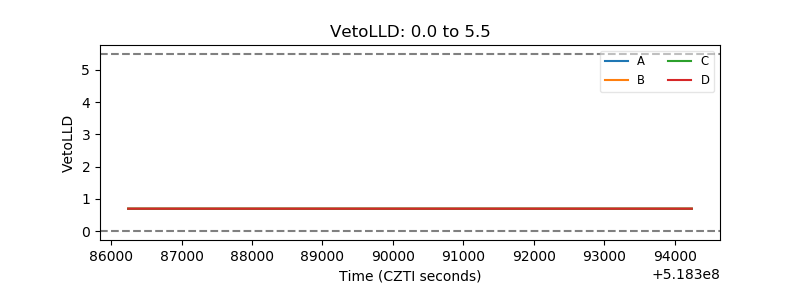 |
| Alpha Counter | 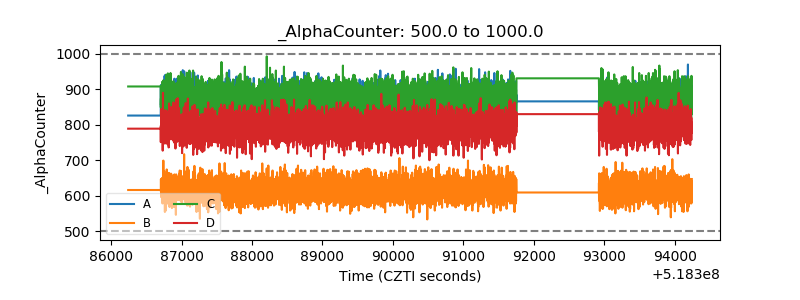 |
| _CPM_Rate | 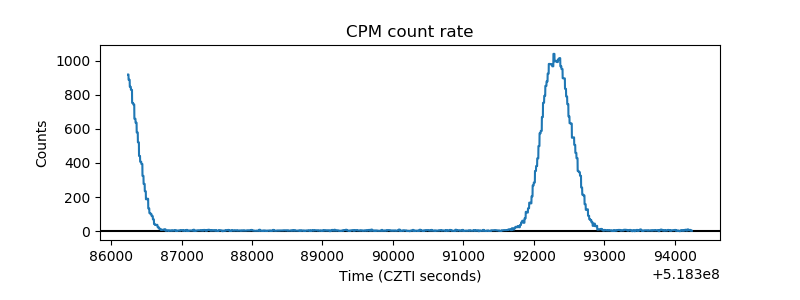 |
| CZT Counter | 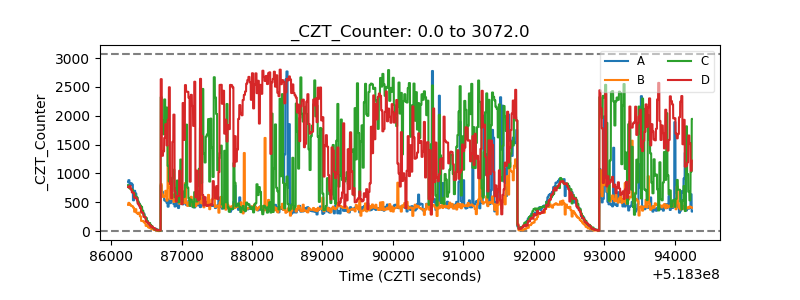 |
| +2.5 Volts monitor |  |
| +5 Volts monitor |  |
| _ROLL_ROT | 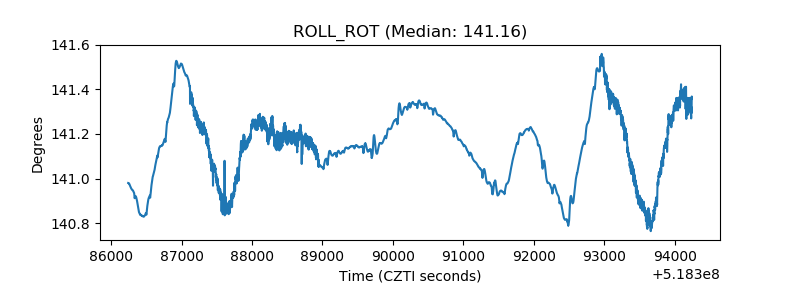 |
| _Roll_DEC | 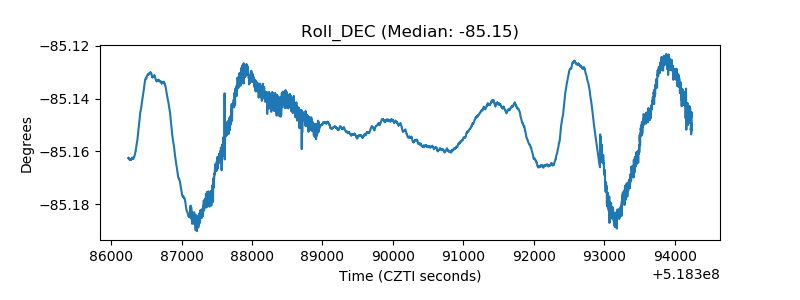 |
| _Roll_RA | 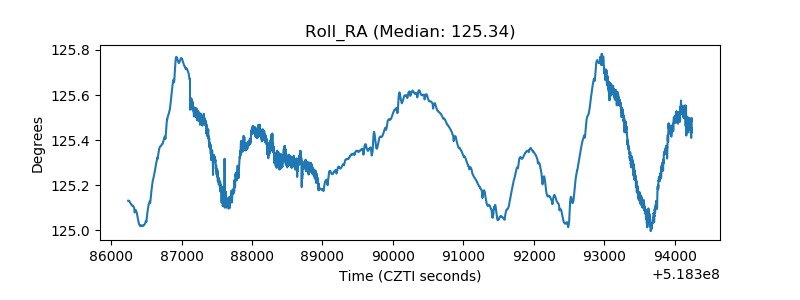 |
| Veto Counter | 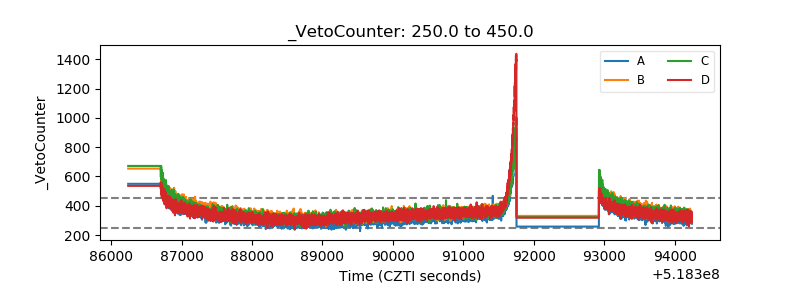 |