| Param | Original file | Final file |
|---|---|---|
| Filename | modeM0/AS1A14_125T11_9000006582_57832cztM0_level2.fits | modeM0/AS1A14_125T11_9000006582_57832cztM0_level2_quad_clean.evt |
| Size (bytes) | 520,724,160 | 102,216,960 |
| Size | 496.6 MB | 97.5 MB |
| Events in quadrant A | 3,202,802 | 702,413 |
| Events in quadrant B | 3,689,177 | 724,657 |
| Events in quadrant C | 8,025,561 | 546,692 |
| Events in quadrant D | 3,812,531 | 632,690 |
| Mode SS | |||
|---|---|---|---|
| Quadrant | BADHDUFLAG | Total packets | Discarded packets |
| A | 0 | 142 | 0 |
| B | 0 | 142 | 0 |
| C | 0 | 142 | 0 |
| D | 0 | 142 | 0 |
| Mode M0 | |||
|---|---|---|---|
| Quadrant | BADHDUFLAG | Total packets | Discarded packets |
| A | 0 | 14937 | 2 |
| B | 0 | 16027 | 3 |
| C | 0 | 28735 | 2 |
| D | 0 | 16102 | 2 |
| Mode M9 | |||
|---|---|---|---|
| Quadrant | BADHDUFLAG | Total packets | Discarded packets |
| A | 0 | 14 | 0 |
| B | 0 | 14 | 0 |
| C | 0 | 14 | 0 |
| D | 0 | 14 | 0 |
| Quadrant | Total seconds | Saturated seconds | Saturation percentage |
|---|---|---|---|
| A | 7016 | 121 | 1.724629% |
| B | 7015 | 238 | 3.392730% |
| C | 7015 | 1464 | 20.869565% |
| D | 7015 | 146 | 2.081254% |
Noise dominated data is calculated using 1-second bins in cleaned event files. If a bin has >2000 counts, and if more than 50% of those come from <1% of pixels, then it is considered to be noise-dominated and hence unusable.
| Quadrant | # 1 sec bins | Bins with >0 counts | Bins with >2000 counts | High rate bins dominated by noise | Noise dominated (total time) | Noise dominated (detector-on time) | Marked lightcurve |
|---|---|---|---|---|---|---|---|
| A | 7751 | 7017 | 21 | 21 | 0.27% | 0.30% | 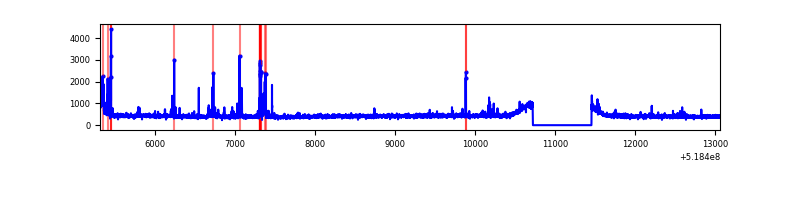 |
| B | 7750 | 7016 | 78 | 78 | 1.01% | 1.11% | 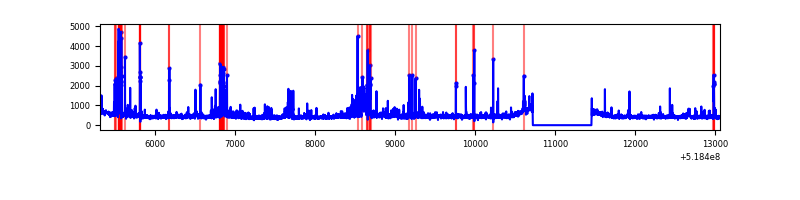 |
| C | 7750 | 7016 | 1076 | 1076 | 13.88% | 15.34% | 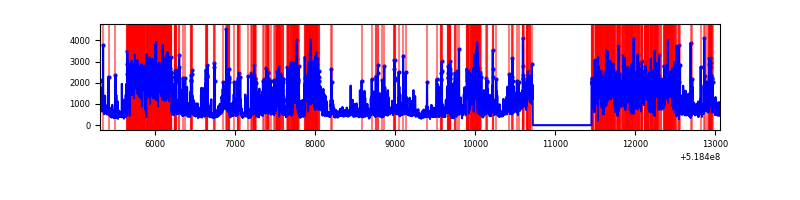 |
| D | 7750 | 7016 | 55 | 55 | 0.71% | 0.78% | 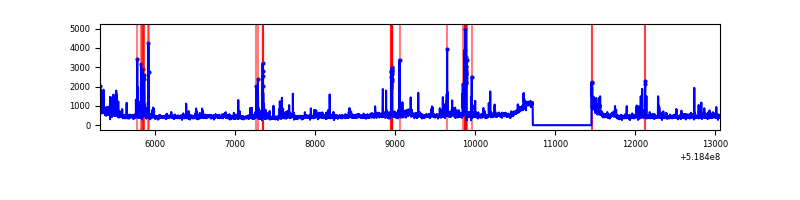 |
Top three noisy pixels from each quadrant. If the there are fewer than three noisy pixels in the level2.evt file, extra rows are filled as -1
| Pixel properties | Quadrant properties | ||||||
|---|---|---|---|---|---|---|---|
| Quadrant | DetID | PixID | Counts | Sigma | Mean | Median | Sigma |
| A | 10 | 251 | 209242 | 1098.77 | 758 | 736 | 189.8 |
| A | 3 | 128 | 31683 | 163.08 | 758 | 736 | 189.8 |
| A | 13 | 248 | 10954 | 53.85 | 758 | 736 | 189.8 |
| B | 5 | 185 | 224711 | 1406.9 | 743 | 714 | 159.2 |
| B | 6 | 51 | 151788 | 948.88 | 743 | 714 | 159.2 |
| B | 0 | 63 | 88166 | 549.28 | 743 | 714 | 159.2 |
| C | 9 | 38 | 4370153 | 23406.67 | 688 | 679 | 186.7 |
| C | 15 | 224 | 722860 | 3868.62 | 688 | 679 | 186.7 |
| C | 6 | 223 | 62512 | 331.23 | 688 | 679 | 186.7 |
| D | 12 | 110 | 430093 | 2067.47 | 735 | 700 | 207.7 |
| D | 2 | 153 | 179464 | 860.72 | 735 | 700 | 207.7 |
| D | 3 | 12 | 78476 | 374.48 | 735 | 700 | 207.7 |
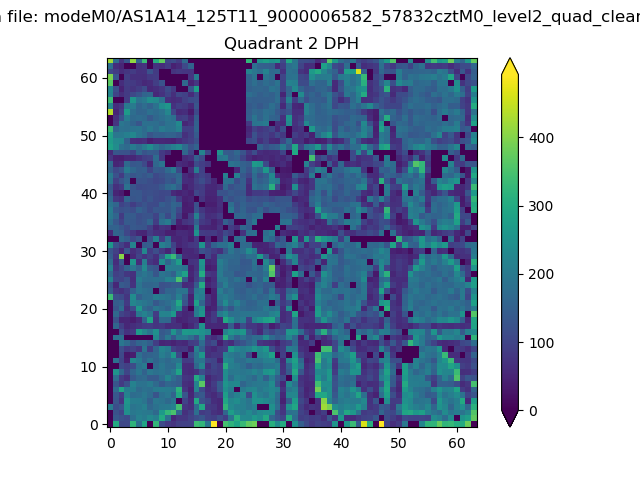
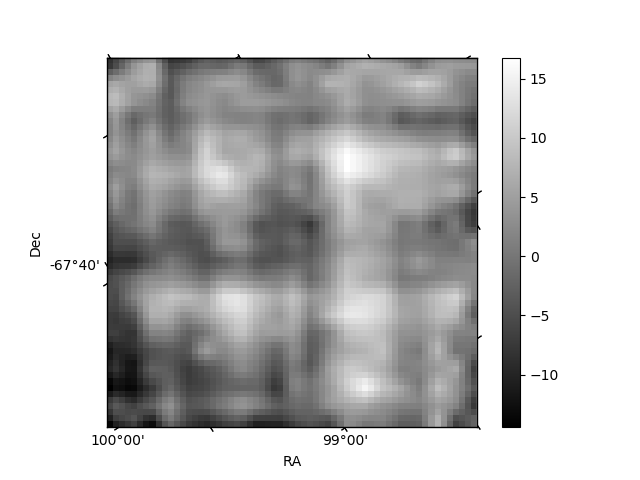
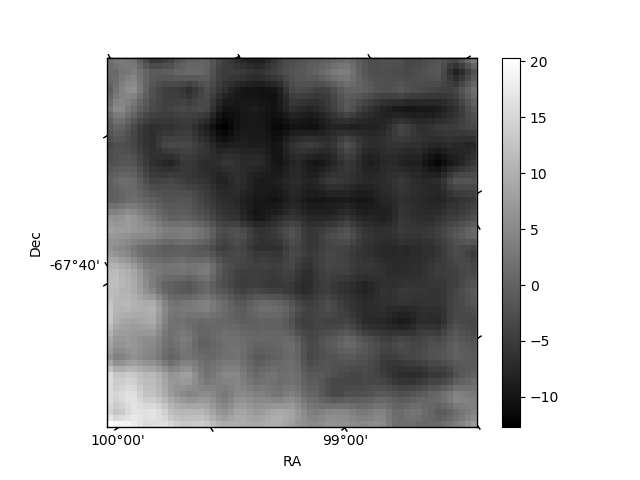
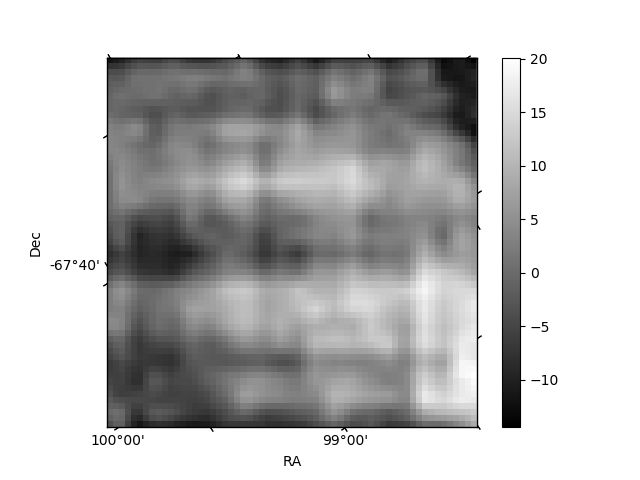
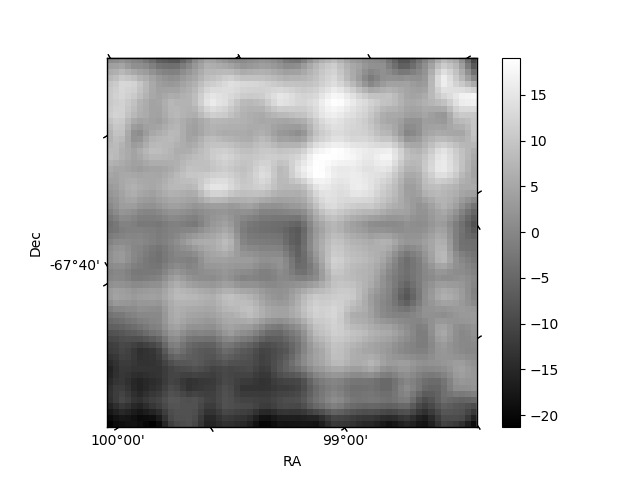
Histogram calculated using DETX and DETY for each event in the final _common_clean file
| Quadrant A | 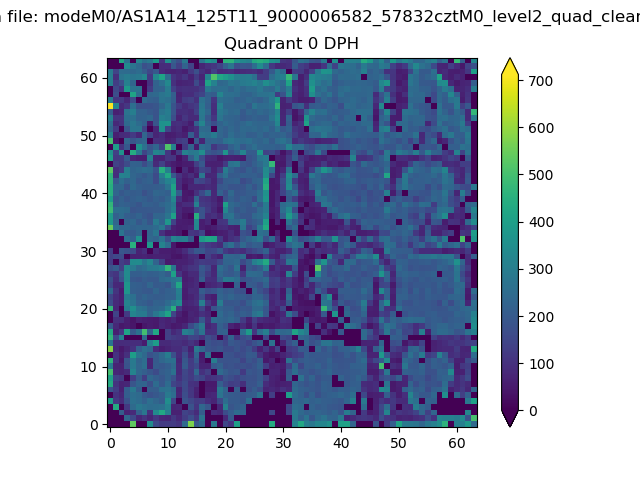 |
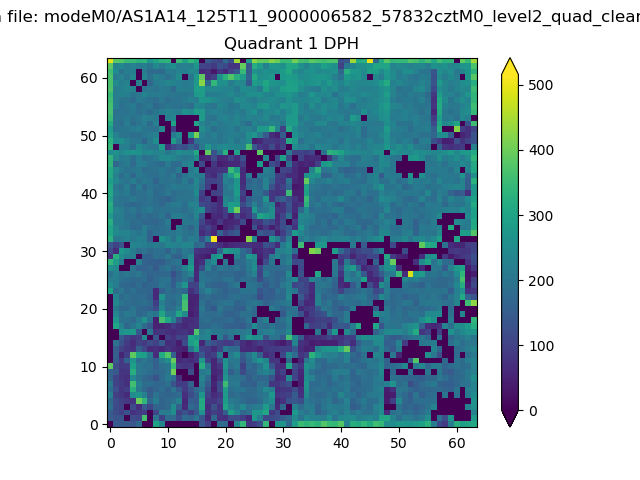 |
Quadrant B |
|---|---|---|---|
| Quadrant D | 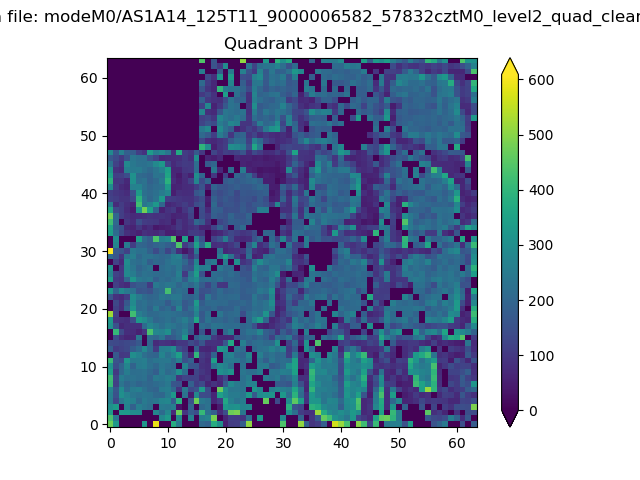 |
 |
Quadrant C |
| Plot type | Count rate plots | Images |
|---|---|---|
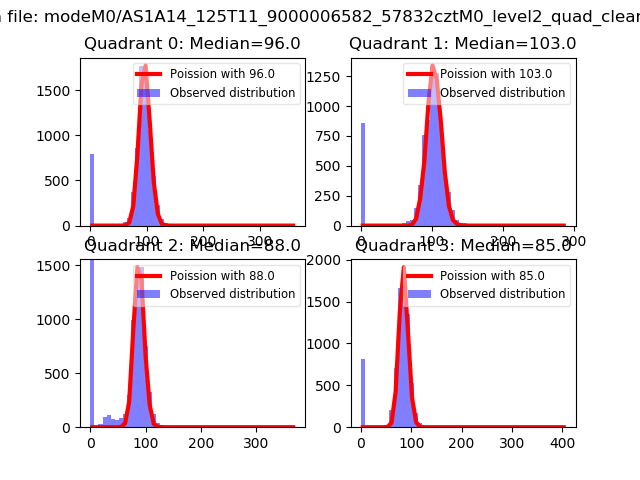
| Comparison with Poisson distribution Blue bars denote a histogram of data divided into 1 sec bins. Red curve is a Poisson curve with rate = median count rate of data. |
 |
 |
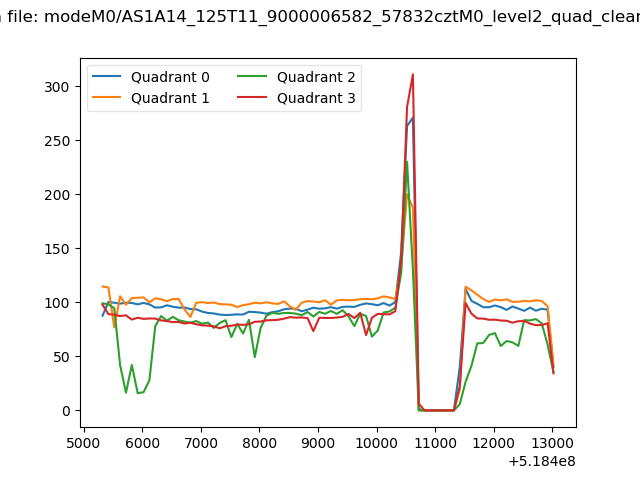
| Quadrant-wise count rates Data is divided into 100 sec bins |
 |
|
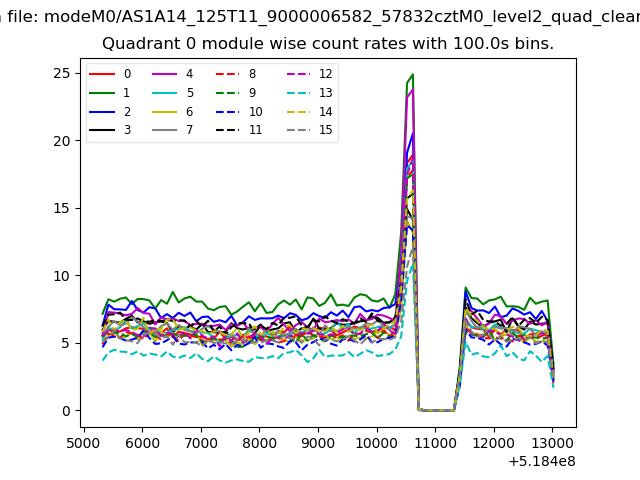
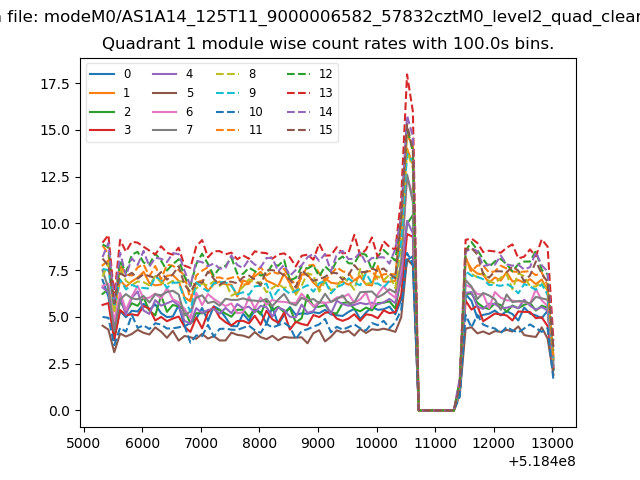
| Module-wise count rates for Quadrant A Data is divided into 100 sec bins |
 |
 |
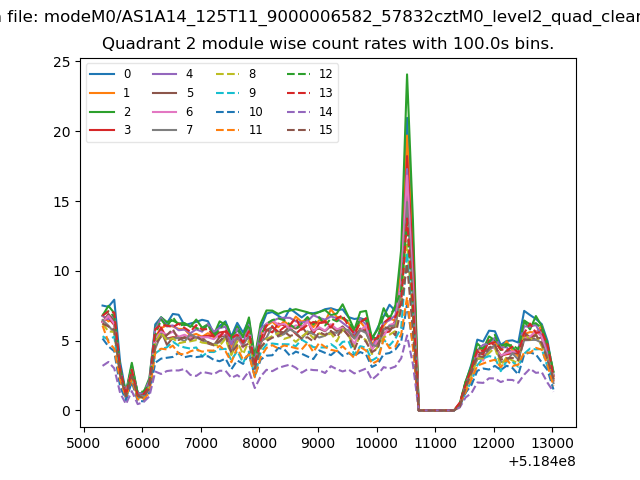
| Module-wise count rates for Quadrant B Data is divided into 100 sec bins |
 |
 |
| Module-wise count rates for Quadrant C Data is divided into 100 sec bins |
 |
 |
| Module-wise count rates for Quadrant D Data is divided into 100 sec bins |
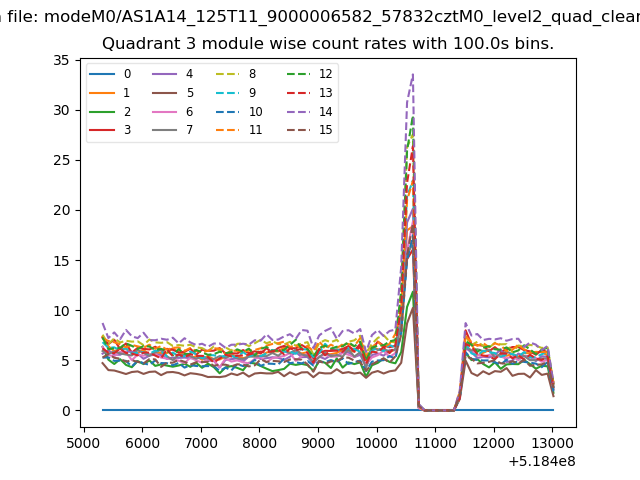 |
 |
| Parameter | Plot |
|---|---|
| CZT HV Monitor | 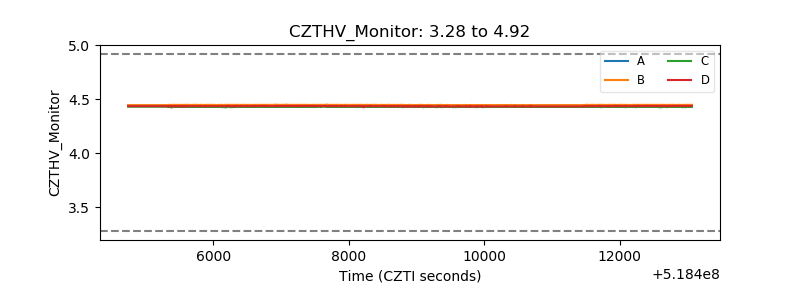 |
| D_VDD | 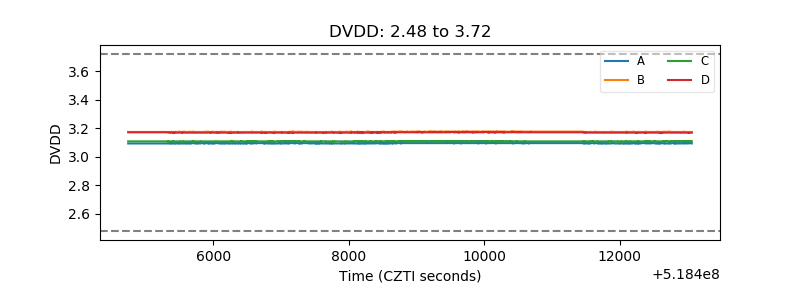 |
| Temperature 1 | 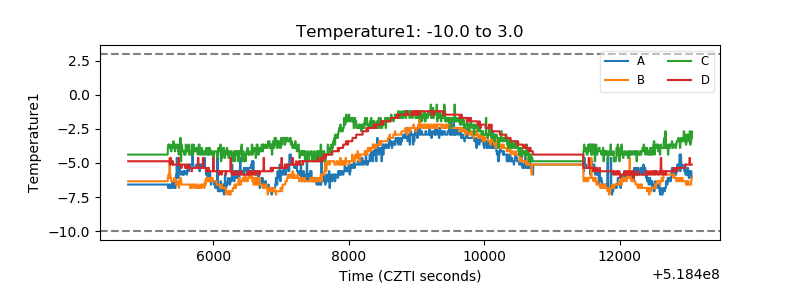 |
| Veto HV Monitor | 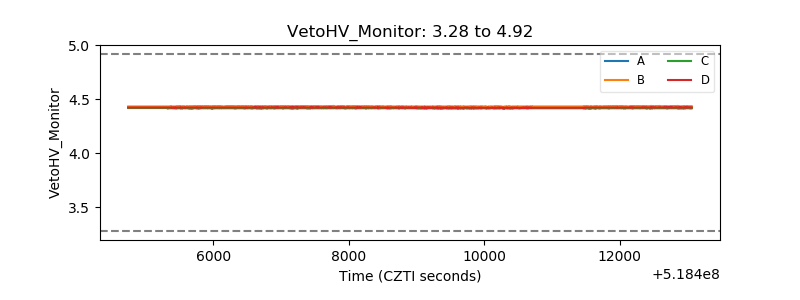 |
| Veto LLD | 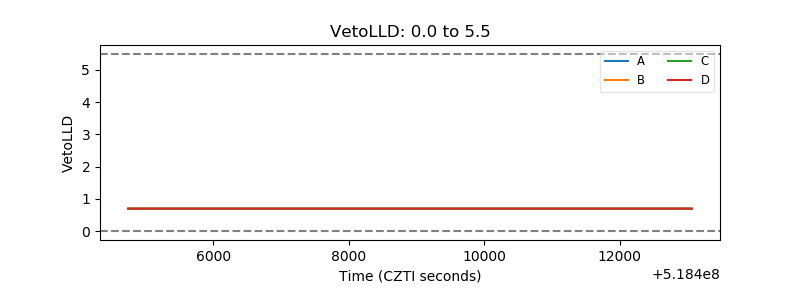 |
| Alpha Counter | 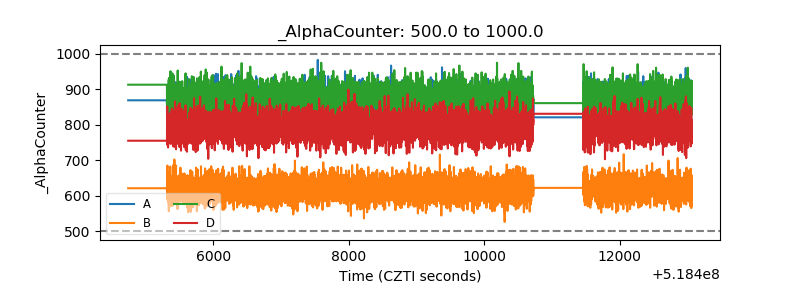 |
| _CPM_Rate | 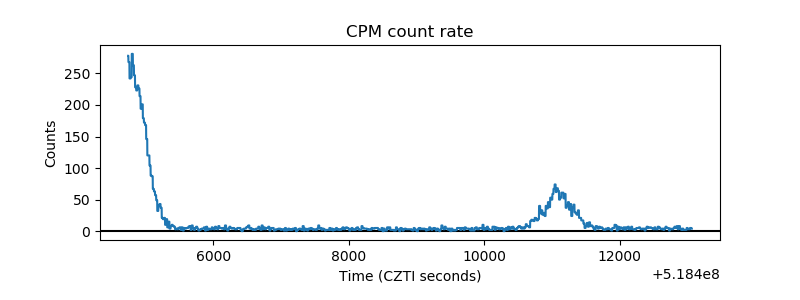 |
| CZT Counter | 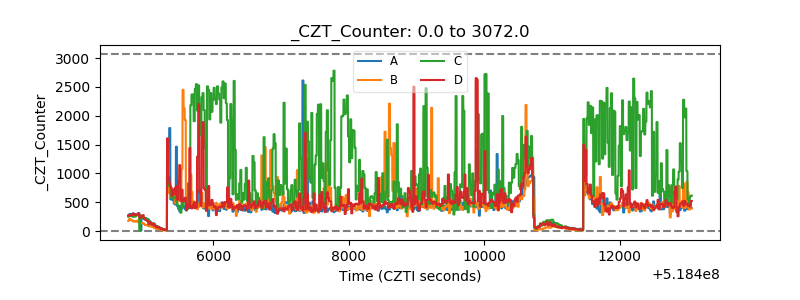 |
| +2.5 Volts monitor | 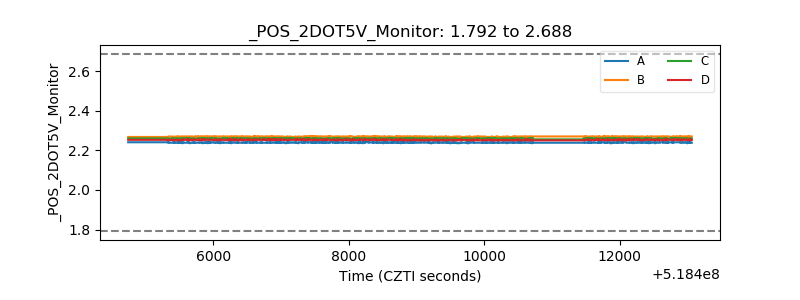 |
| +5 Volts monitor | 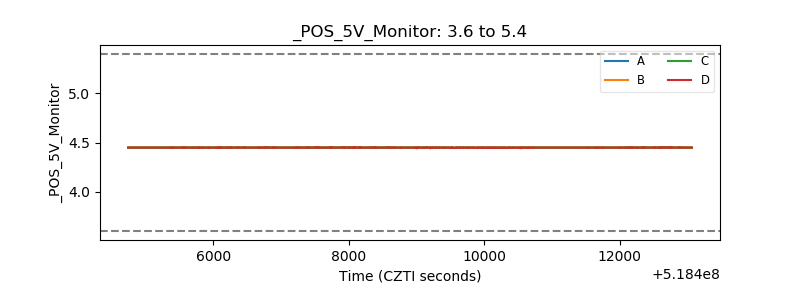 |
| _ROLL_ROT | 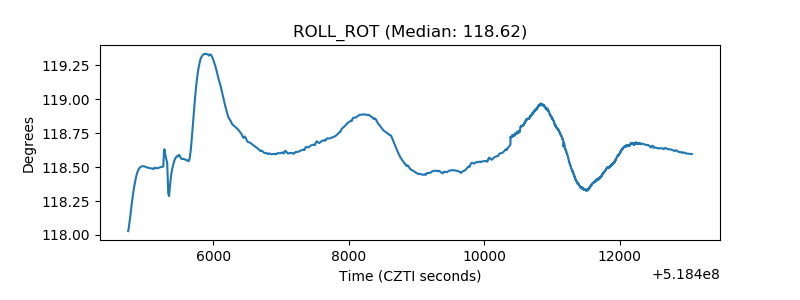 |
| _Roll_DEC | 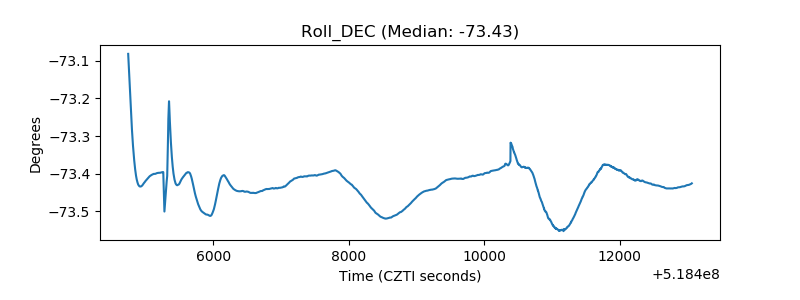 |
| _Roll_RA | 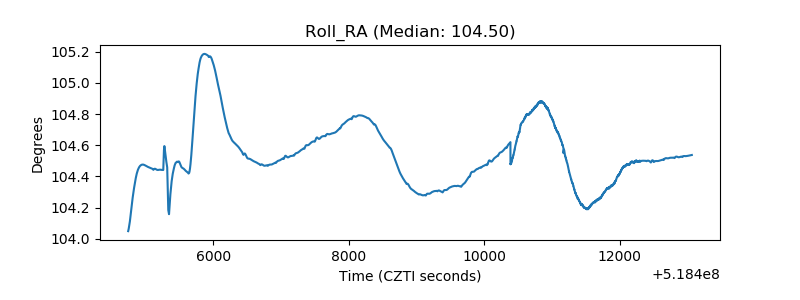 |
| Veto Counter | 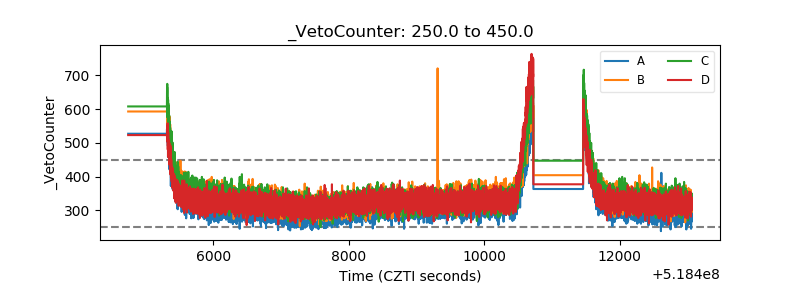 |