| Param | Original file | Final file |
|---|---|---|
| Filename | modeM0/AS1A14_125T11_9000006582_57834cztM0_level2.fits | modeM0/AS1A14_125T11_9000006582_57834cztM0_level2_quad_clean.evt |
| Size (bytes) | 658,592,640 | 103,138,560 |
| Size | 628.1 MB | 98.4 MB |
| Events in quadrant A | 3,161,540 | 723,164 |
| Events in quadrant B | 4,181,538 | 745,883 |
| Events in quadrant C | 10,773,231 | 491,085 |
| Events in quadrant D | 5,676,753 | 637,376 |
| Mode SS | |||
|---|---|---|---|
| Quadrant | BADHDUFLAG | Total packets | Discarded packets |
| A | 0 | 150 | 0 |
| B | 0 | 150 | 0 |
| C | 0 | 150 | 0 |
| D | 0 | 150 | 0 |
| Mode M0 | |||
|---|---|---|---|
| Quadrant | BADHDUFLAG | Total packets | Discarded packets |
| A | 0 | 15235 | 0 |
| B | 0 | 17918 | 0 |
| C | 0 | 37288 | 3 |
| D | 0 | 22127 | 0 |
| Quadrant | Total seconds | Saturated seconds | Saturation percentage |
|---|---|---|---|
| A | 7552 | 15 | 0.198623% |
| B | 7553 | 323 | 4.276446% |
| C | 7552 | 2505 | 33.170021% |
| D | 7552 | 169 | 2.237818% |
Noise dominated data is calculated using 1-second bins in cleaned event files. If a bin has >2000 counts, and if more than 50% of those come from <1% of pixels, then it is considered to be noise-dominated and hence unusable.
| Quadrant | # 1 sec bins | Bins with >0 counts | Bins with >2000 counts | High rate bins dominated by noise | Noise dominated (total time) | Noise dominated (detector-on time) | Marked lightcurve |
|---|---|---|---|---|---|---|---|
| A | 7552 | 7552 | 6 | 6 | 0.08% | 0.08% | 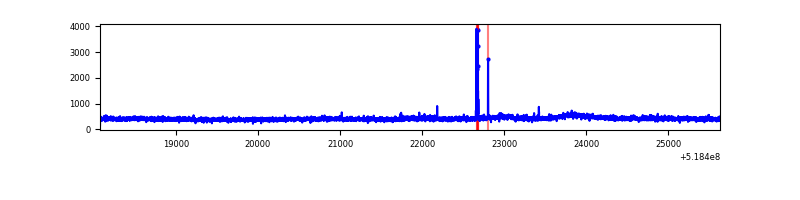 |
| B | 7553 | 7553 | 221 | 221 | 2.93% | 2.93% | 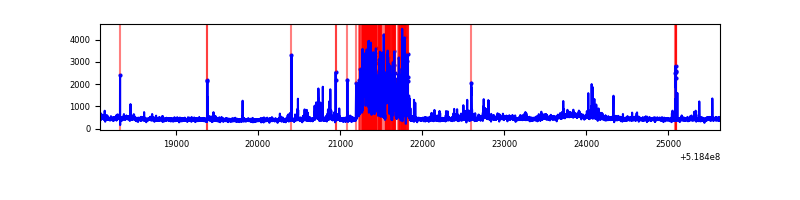 |
| C | 7552 | 7552 | 1926 | 1926 | 25.50% | 25.50% | 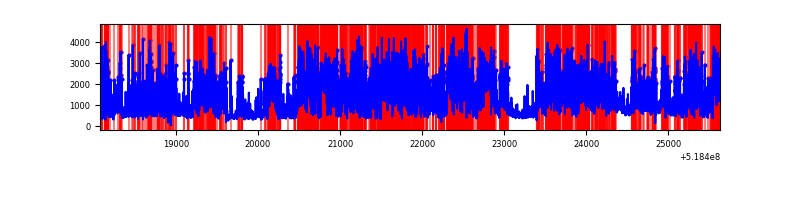 |
| D | 7552 | 7552 | 150 | 150 | 1.99% | 1.99% | 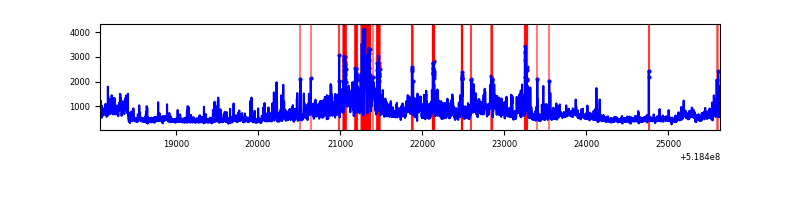 |
Top three noisy pixels from each quadrant. If the there are fewer than three noisy pixels in the level2.evt file, extra rows are filled as -1
| Pixel properties | Quadrant properties | ||||||
|---|---|---|---|---|---|---|---|
| Quadrant | DetID | PixID | Counts | Sigma | Mean | Median | Sigma |
| A | 3 | 128 | 46039 | 229.64 | 794 | 774 | 197.1 |
| A | 3 | 245 | 32572 | 161.31 | 794 | 774 | 197.1 |
| A | 13 | 254 | 10092 | 47.27 | 794 | 774 | 197.1 |
| B | 2 | 249 | 813927 | 4901.11 | 776 | 748 | 165.9 |
| B | 0 | 213 | 45771 | 271.36 | 776 | 748 | 165.9 |
| B | 5 | 185 | 43511 | 257.74 | 776 | 748 | 165.9 |
| C | 9 | 38 | 5582272 | 29841.81 | 679 | 669 | 187.0 |
| C | 15 | 224 | 2069716 | 11062.07 | 679 | 669 | 187.0 |
| C | 6 | 223 | 141749 | 754.28 | 679 | 669 | 187.0 |
| D | 12 | 110 | 1198911 | 5558.44 | 766 | 730 | 215.6 |
| D | 8 | 160 | 639889 | 2965.1 | 766 | 730 | 215.6 |
| D | 2 | 62 | 482695 | 2235.87 | 766 | 730 | 215.6 |
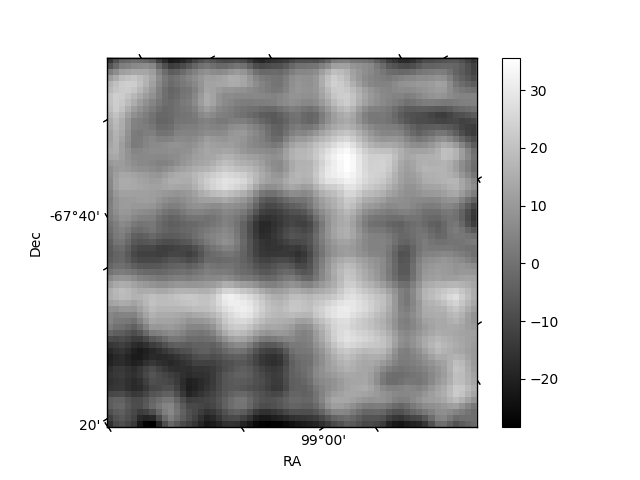
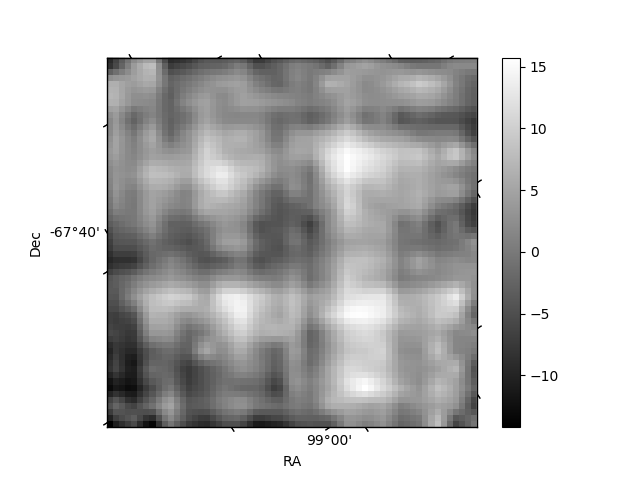
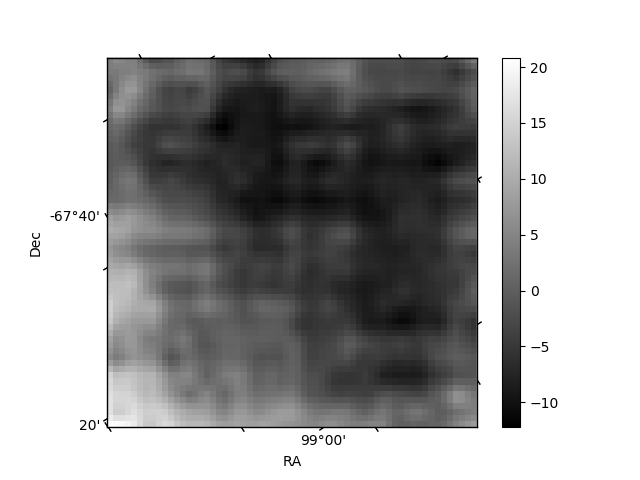
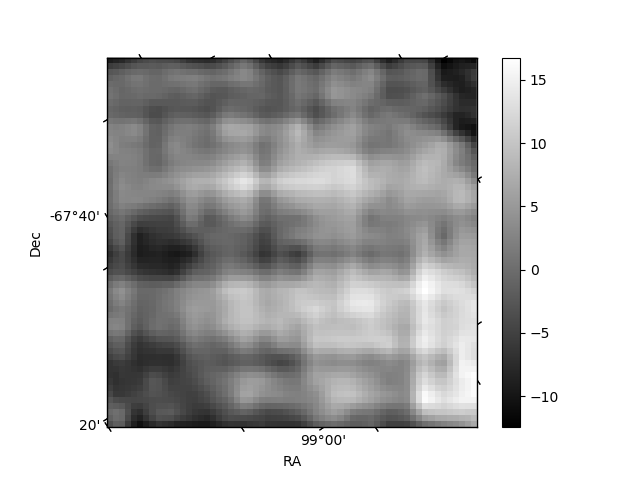
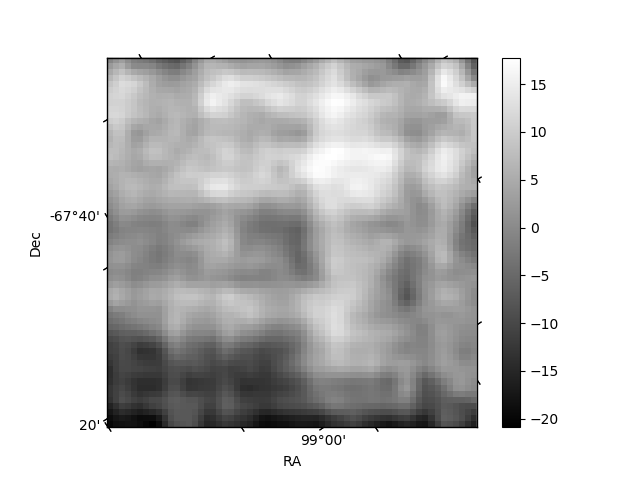
Histogram calculated using DETX and DETY for each event in the final _common_clean file
| Quadrant A | 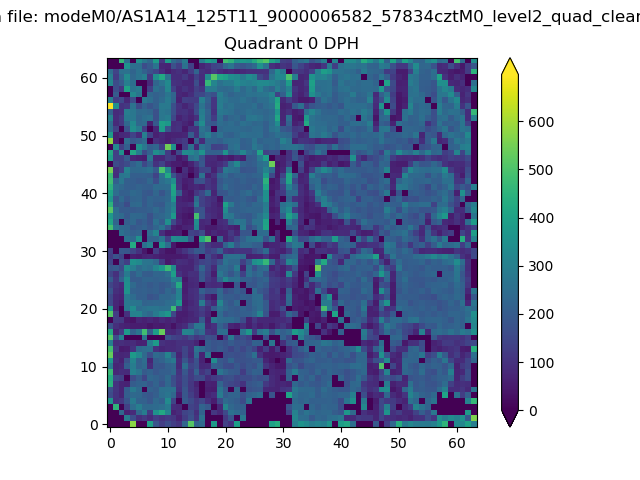 |
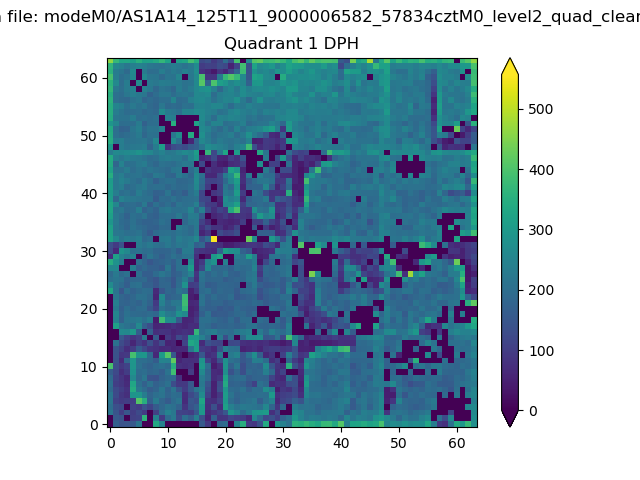 |
Quadrant B |
|---|---|---|---|
| Quadrant D | 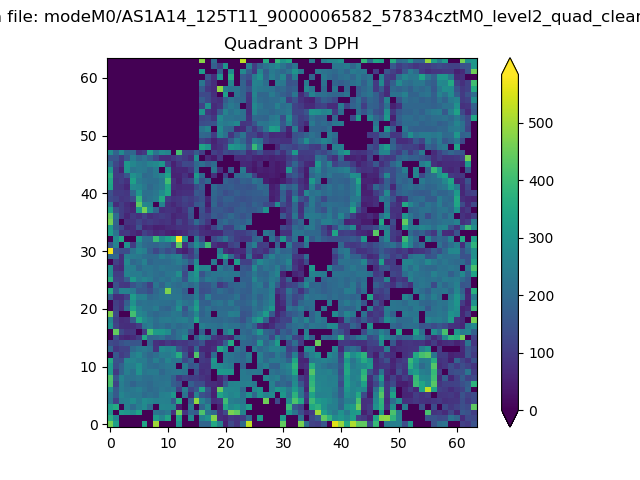 |
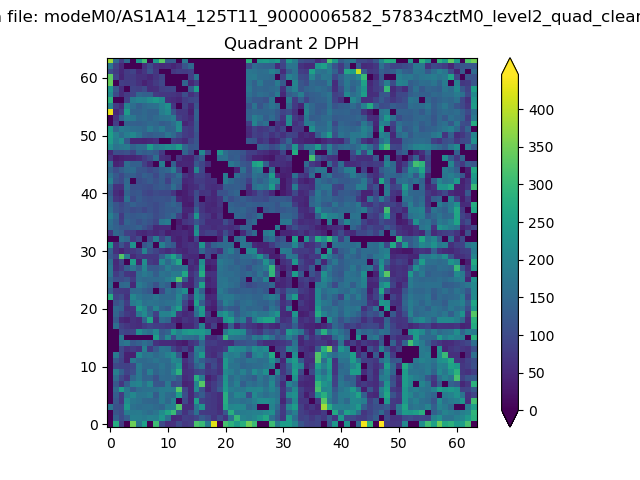 |
Quadrant C |
| Plot type | Count rate plots | Images |
|---|---|---|
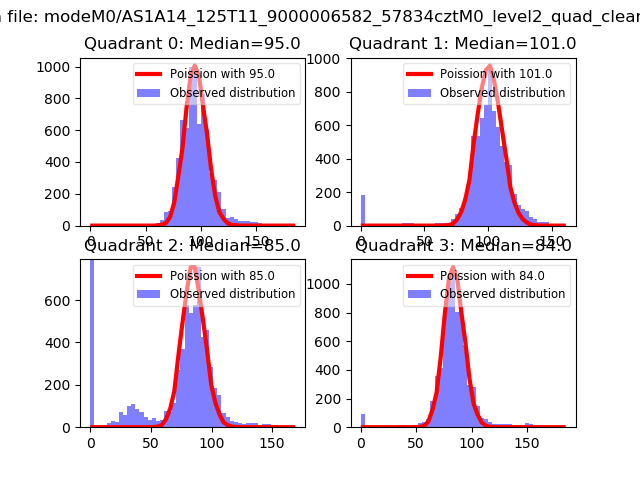
| Comparison with Poisson distribution Blue bars denote a histogram of data divided into 1 sec bins. Red curve is a Poisson curve with rate = median count rate of data. |
 |
 |
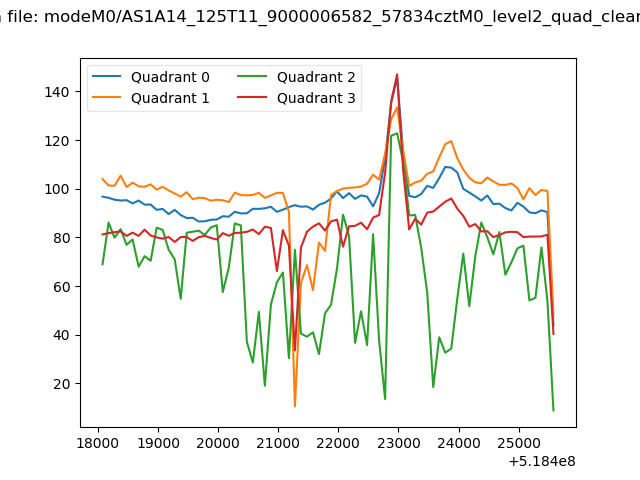
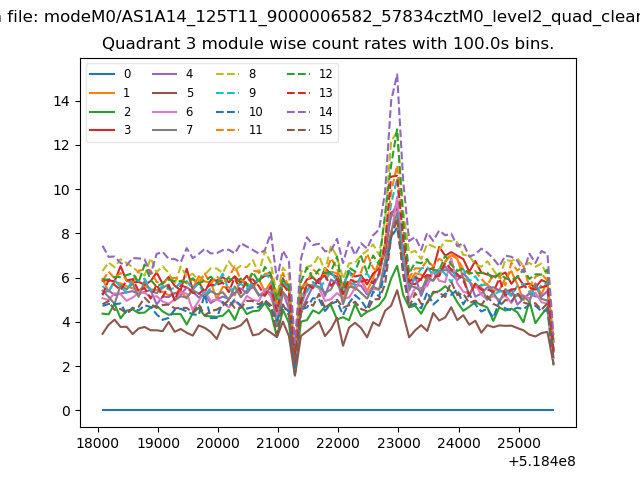
| Quadrant-wise count rates Data is divided into 100 sec bins |
 |
|
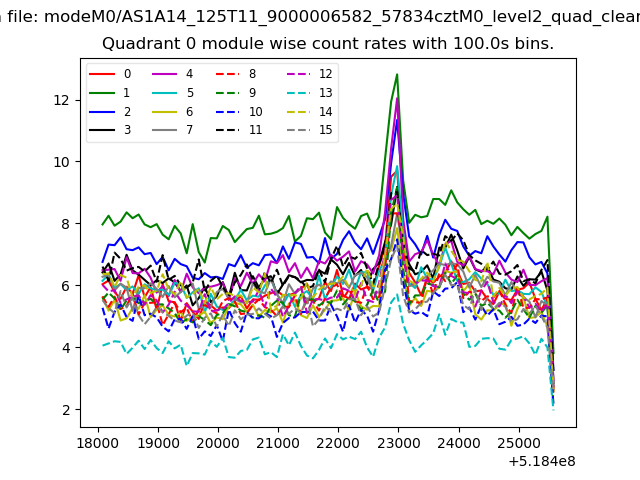
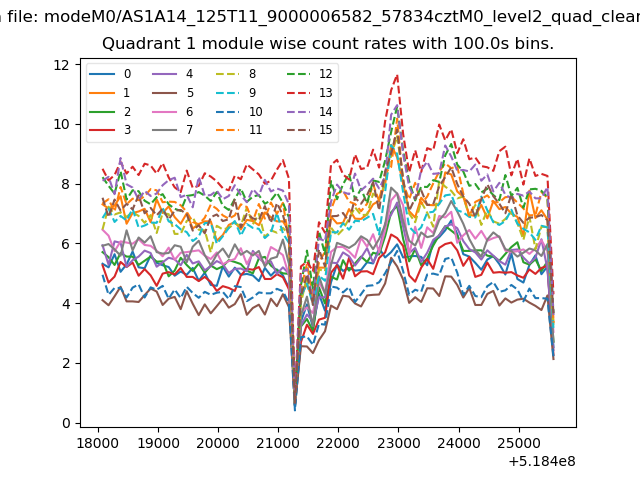
| Module-wise count rates for Quadrant A Data is divided into 100 sec bins |
 |
 |
| Module-wise count rates for Quadrant B Data is divided into 100 sec bins |
 |
 |
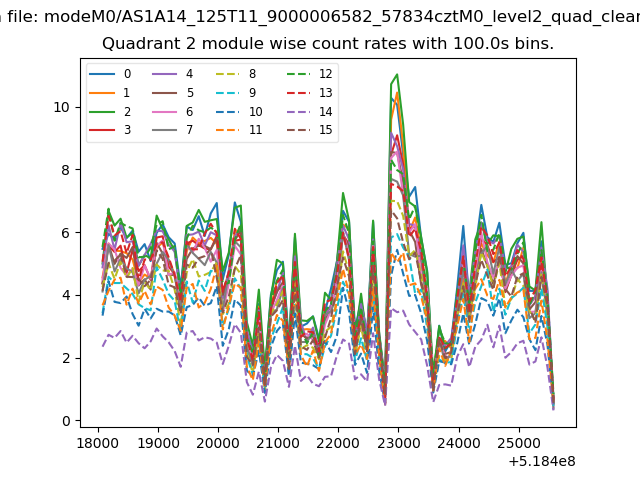
| Module-wise count rates for Quadrant C Data is divided into 100 sec bins |
 |
 |
| Module-wise count rates for Quadrant D Data is divided into 100 sec bins |
 |
 |
| Parameter | Plot |
|---|---|
| CZT HV Monitor | 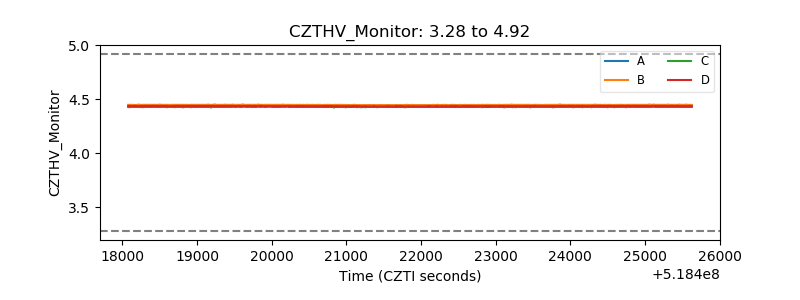 |
| D_VDD | 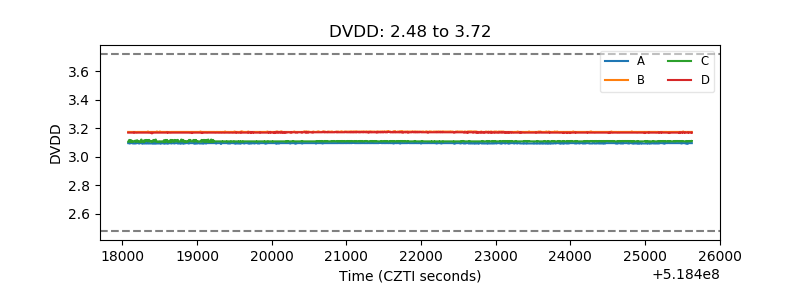 |
| Temperature 1 | 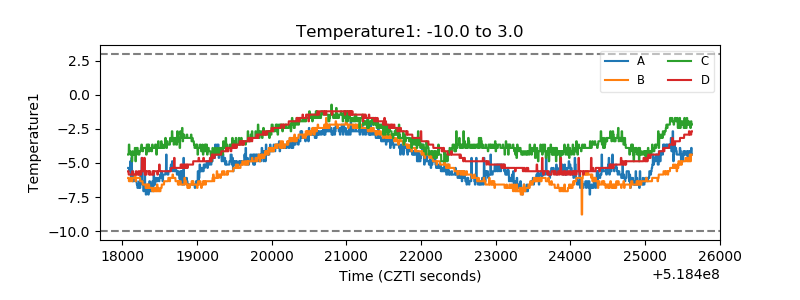 |
| Veto HV Monitor | 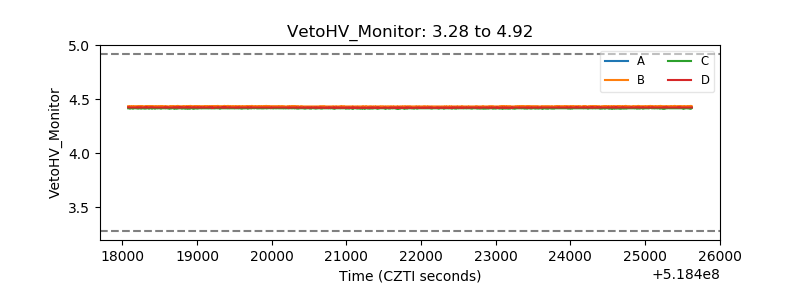 |
| Veto LLD | 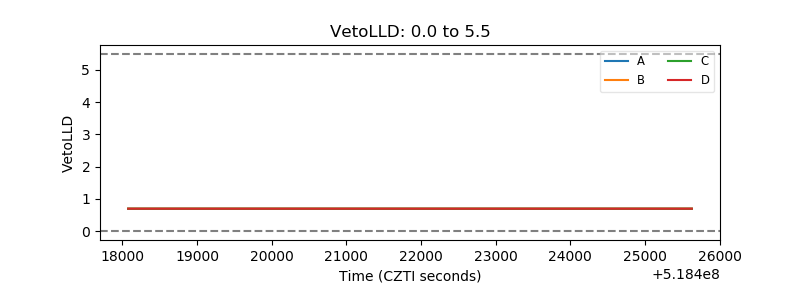 |
| Alpha Counter | 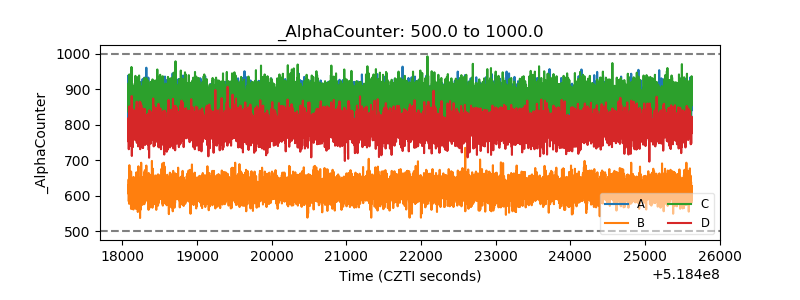 |
| _CPM_Rate | 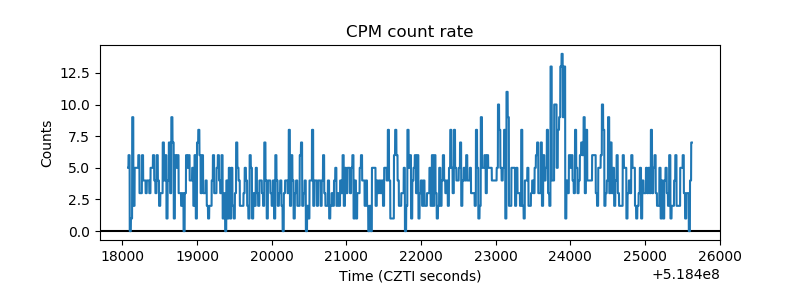 |
| CZT Counter | 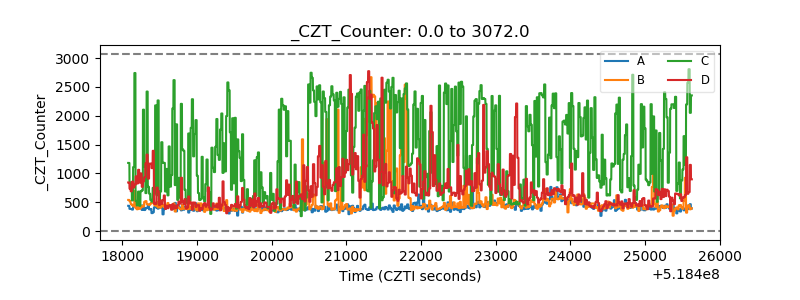 |
| +2.5 Volts monitor | 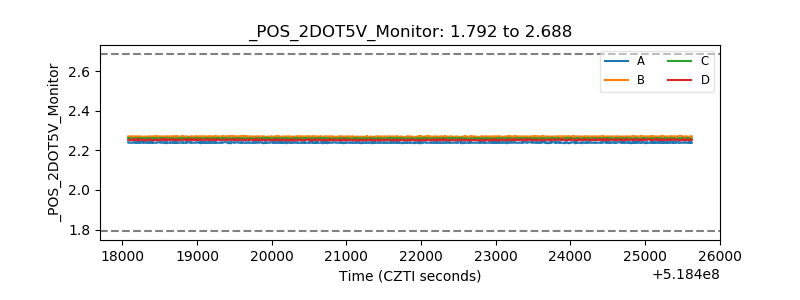 |
| +5 Volts monitor | 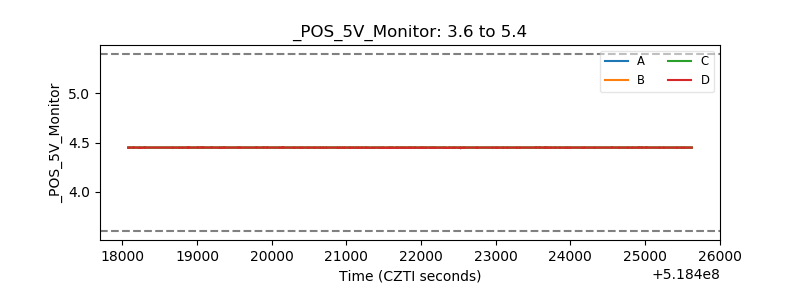 |
| _ROLL_ROT | 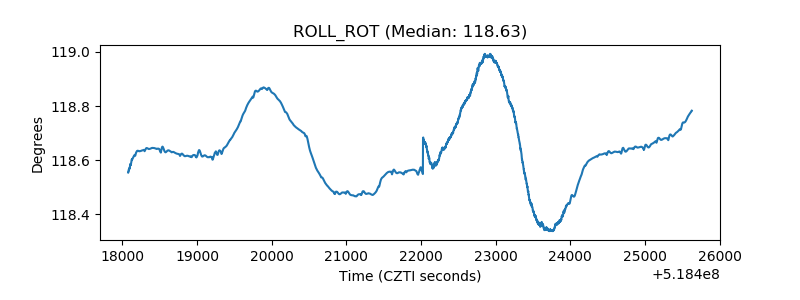 |
| _Roll_DEC | 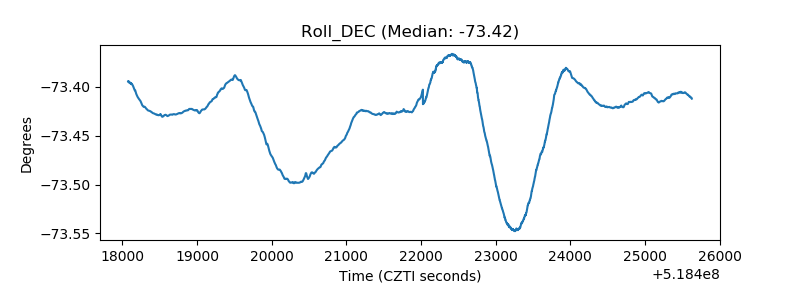 |
| _Roll_RA | 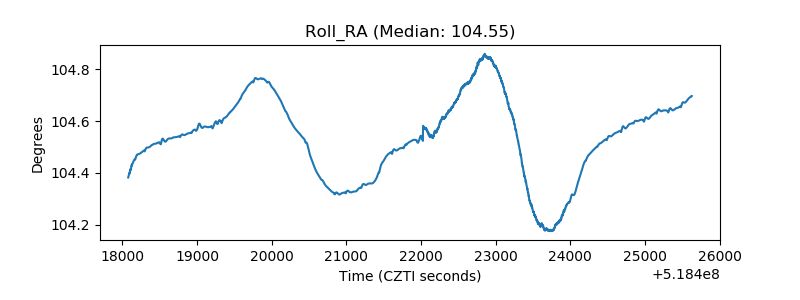 |
| Veto Counter | 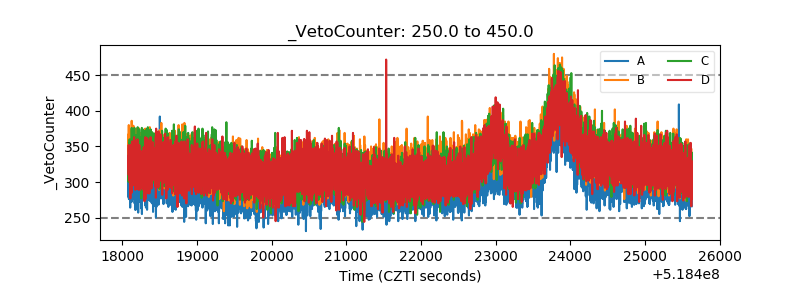 |