| Param | Original file | Final file |
|---|---|---|
| Filename | modeM0/AS1A14_125T11_9000006582_57835cztM0_level2.fits | modeM0/AS1A14_125T11_9000006582_57835cztM0_level2_quad_clean.evt |
| Size (bytes) | 628,931,520 | 99,815,040 |
| Size | 599.8 MB | 95.2 MB |
| Events in quadrant A | 3,266,096 | 687,090 |
| Events in quadrant B | 4,104,528 | 712,367 |
| Events in quadrant C | 10,337,081 | 503,160 |
| Events in quadrant D | 5,005,039 | 609,863 |
| Mode SS | |||
|---|---|---|---|
| Quadrant | BADHDUFLAG | Total packets | Discarded packets |
| A | 0 | 146 | 0 |
| B | 0 | 146 | 0 |
| C | 0 | 146 | 0 |
| D | 0 | 146 | 0 |
| Mode M0 | |||
|---|---|---|---|
| Quadrant | BADHDUFLAG | Total packets | Discarded packets |
| A | 0 | 15305 | 0 |
| B | 0 | 17582 | 6 |
| C | 0 | 35870 | 10 |
| D | 0 | 19775 | 13 |
| Quadrant | Total seconds | Saturated seconds | Saturation percentage |
|---|---|---|---|
| A | 7325 | 55 | 0.750853% |
| B | 7322 | 346 | 4.725485% |
| C | 7323 | 2122 | 28.977195% |
| D | 7322 | 150 | 2.048621% |
Noise dominated data is calculated using 1-second bins in cleaned event files. If a bin has >2000 counts, and if more than 50% of those come from <1% of pixels, then it is considered to be noise-dominated and hence unusable.
| Quadrant | # 1 sec bins | Bins with >0 counts | Bins with >2000 counts | High rate bins dominated by noise | Noise dominated (total time) | Noise dominated (detector-on time) | Marked lightcurve |
|---|---|---|---|---|---|---|---|
| A | 7325 | 7325 | 28 | 28 | 0.38% | 0.38% | 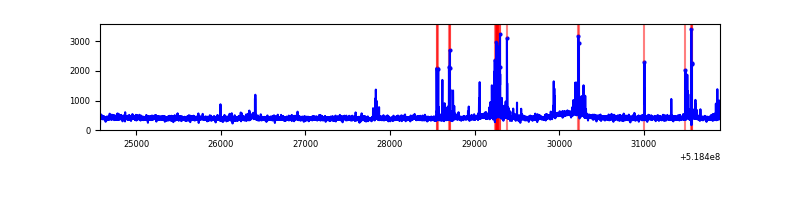 |
| B | 7326 | 7325 | 238 | 238 | 3.25% | 3.25% | 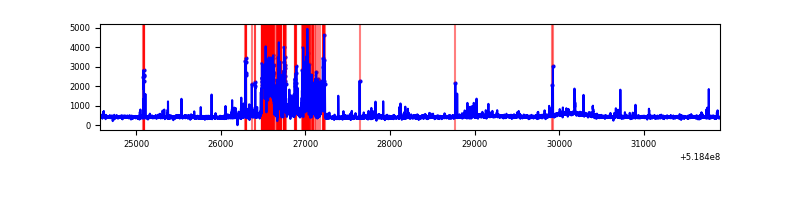 |
| C | 7325 | 7325 | 1630 | 1630 | 22.25% | 22.25% | 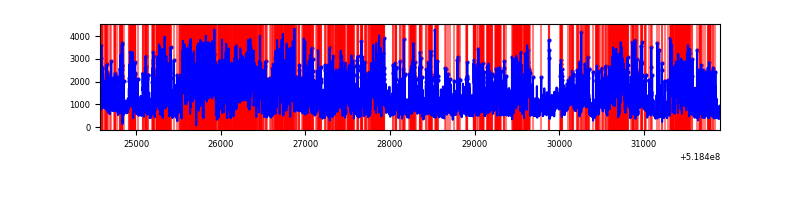 |
| D | 7325 | 7324 | 133 | 133 | 1.82% | 1.82% | 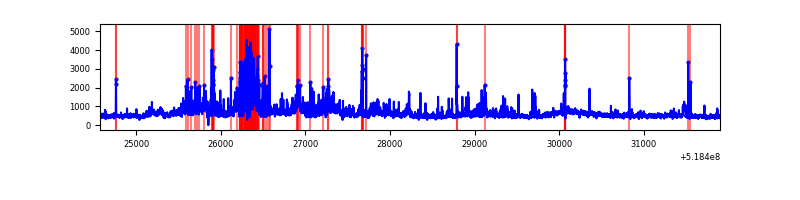 |
Top three noisy pixels from each quadrant. If the there are fewer than three noisy pixels in the level2.evt file, extra rows are filled as -1
| Pixel properties | Quadrant properties | ||||||
|---|---|---|---|---|---|---|---|
| Quadrant | DetID | PixID | Counts | Sigma | Mean | Median | Sigma |
| A | 10 | 251 | 195064 | 1020.57 | 773 | 751 | 190.4 |
| A | 3 | 128 | 33032 | 169.55 | 773 | 751 | 190.4 |
| A | 3 | 245 | 27604 | 141.04 | 773 | 751 | 190.4 |
| B | 5 | 185 | 452031 | 2827.47 | 750 | 721 | 159.6 |
| B | 2 | 249 | 350773 | 2193.09 | 750 | 721 | 159.6 |
| B | 10 | 247 | 144316 | 899.63 | 750 | 721 | 159.6 |
| C | 9 | 38 | 5137036 | 27662.2 | 681 | 673 | 185.7 |
| C | 15 | 224 | 2199063 | 11839.57 | 681 | 673 | 185.7 |
| C | 6 | 223 | 125544 | 672.5 | 681 | 673 | 185.7 |
| D | 12 | 110 | 837845 | 3976.93 | 746 | 713 | 210.5 |
| D | 8 | 240 | 328852 | 1558.88 | 746 | 713 | 210.5 |
| D | 2 | 62 | 264644 | 1253.85 | 746 | 713 | 210.5 |
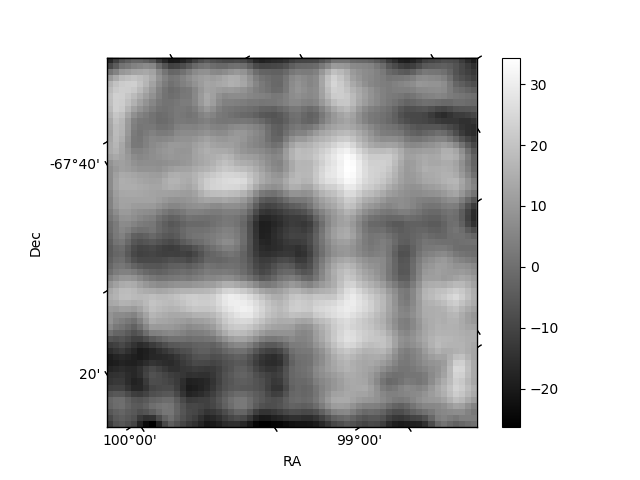
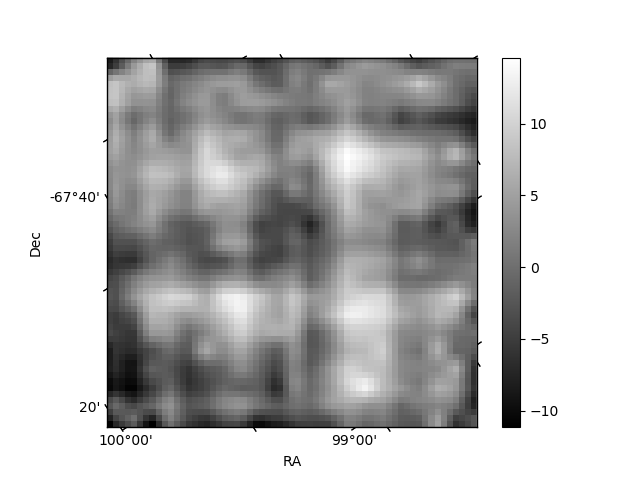
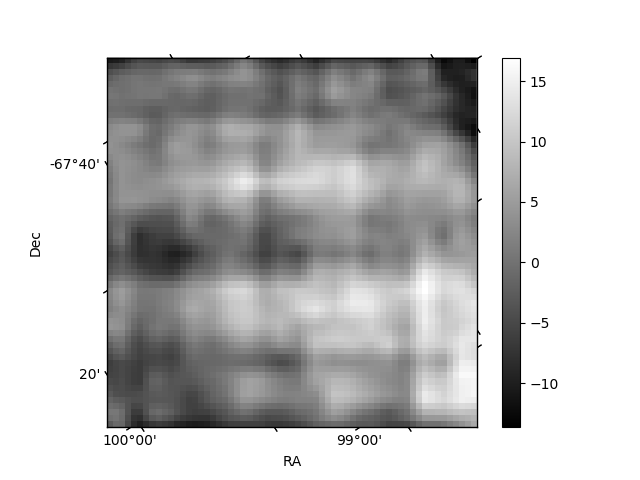
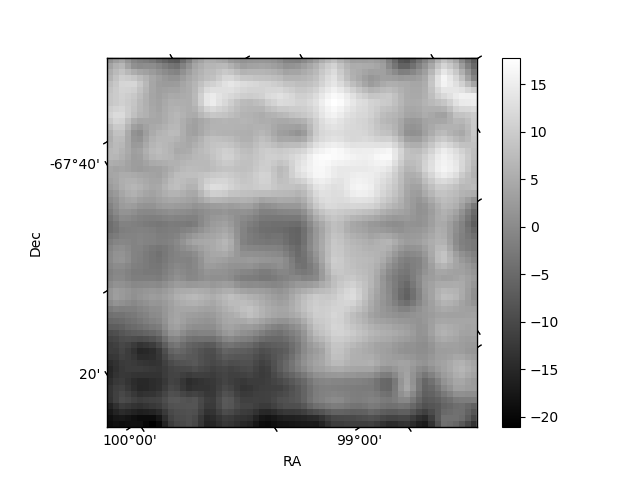
Histogram calculated using DETX and DETY for each event in the final _common_clean file
| Quadrant A | 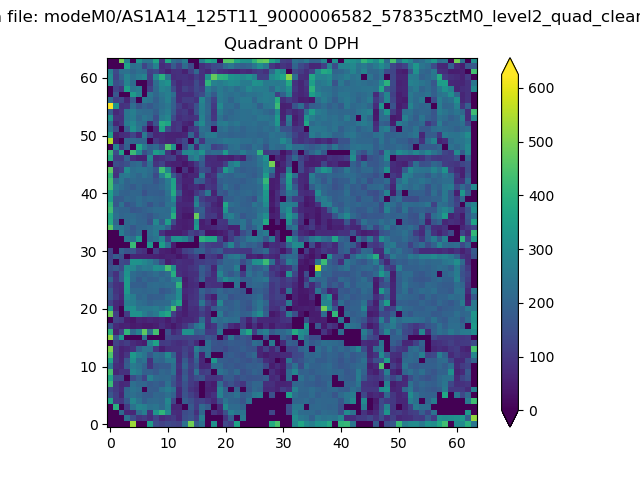 |
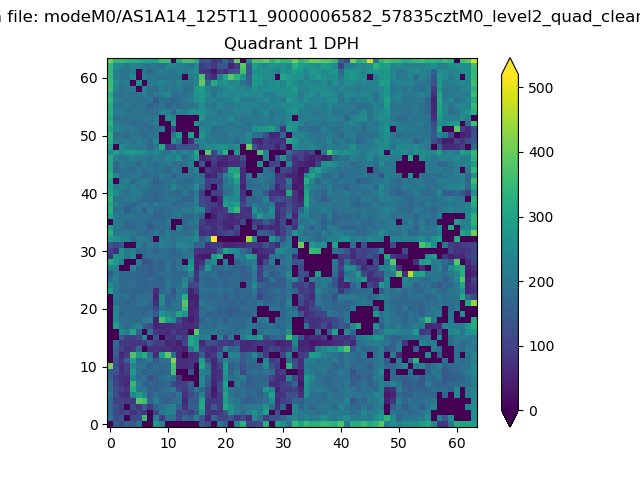 |
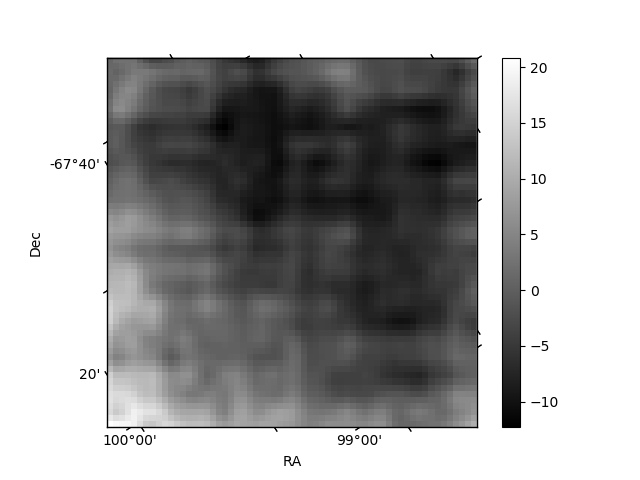
Quadrant B |
|---|---|---|---|
| Quadrant D | 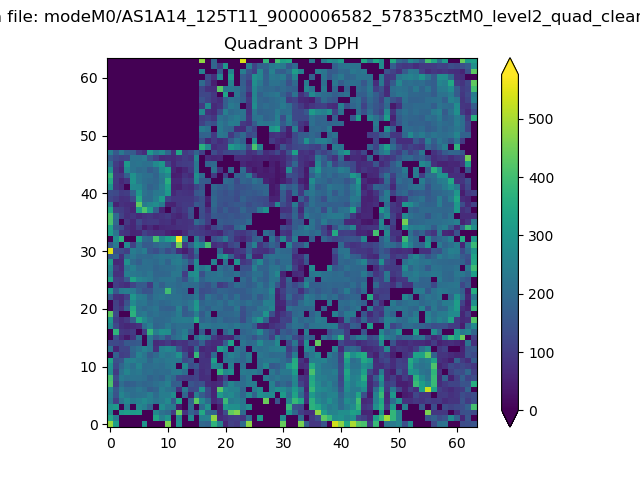 |
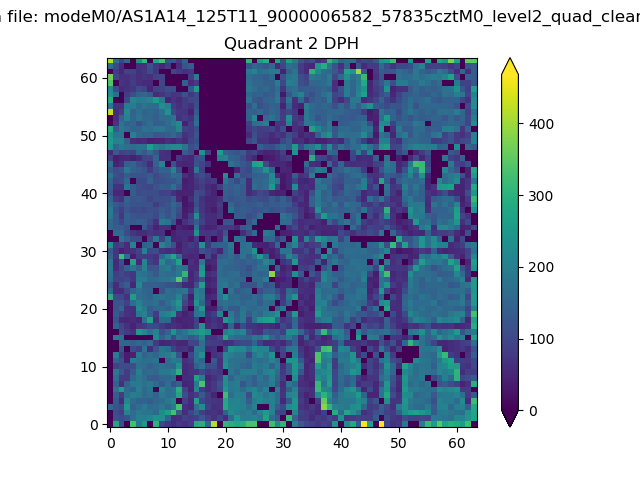 |
Quadrant C |
| Plot type | Count rate plots | Images |
|---|---|---|
| Comparison with Poisson distribution Blue bars denote a histogram of data divided into 1 sec bins. Red curve is a Poisson curve with rate = median count rate of data. |
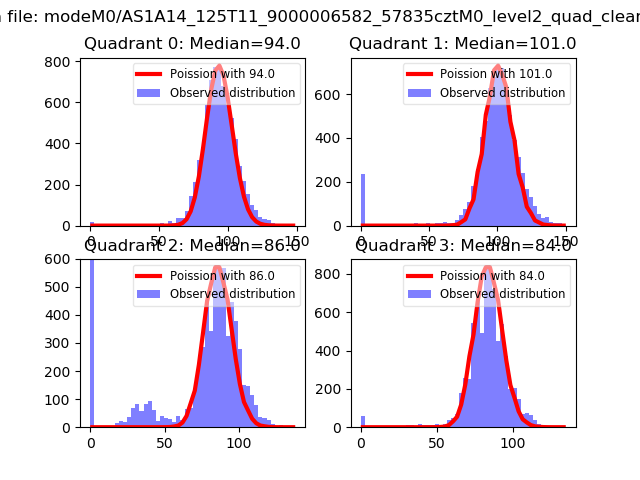 |
 |
| Quadrant-wise count rates Data is divided into 100 sec bins |
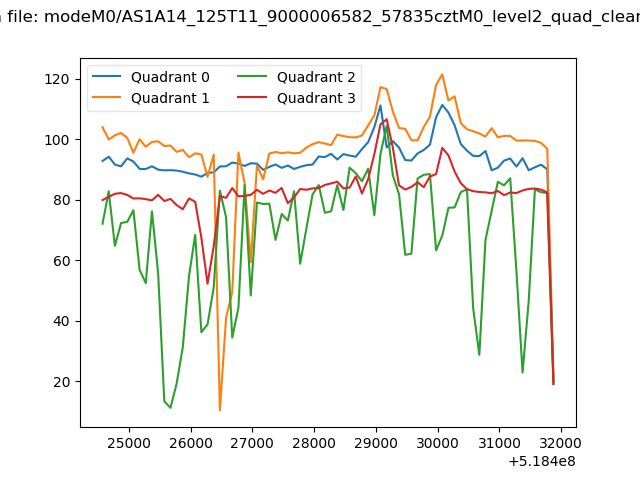 |
|
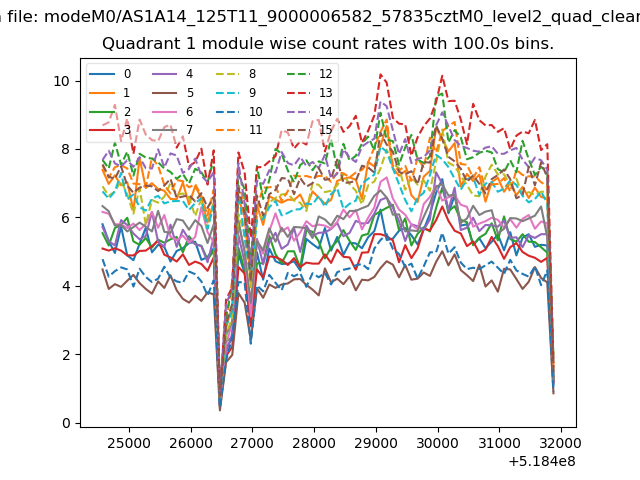
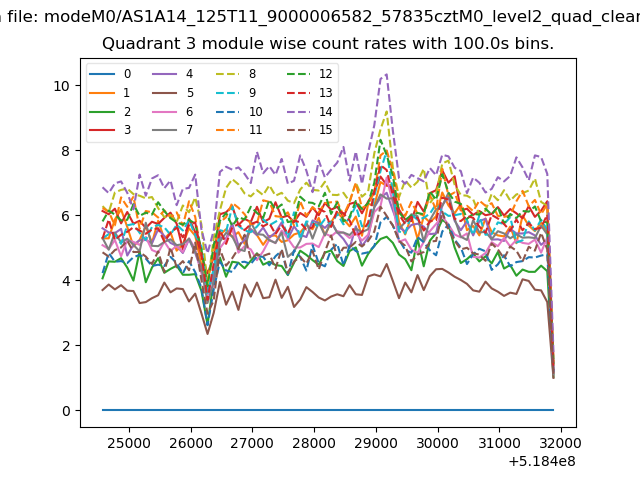
| Module-wise count rates for Quadrant A Data is divided into 100 sec bins |
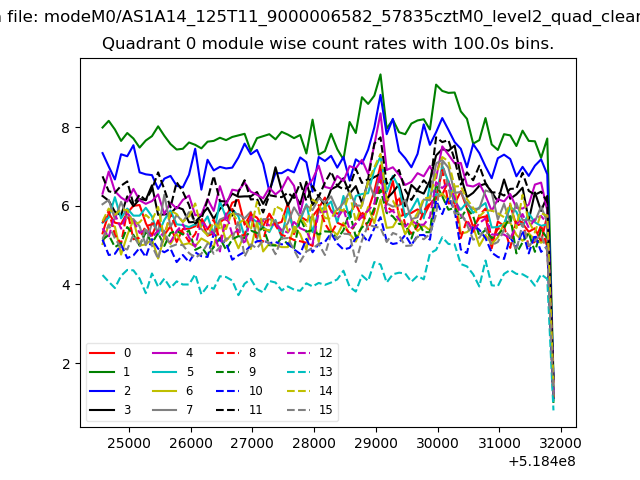 |
 |
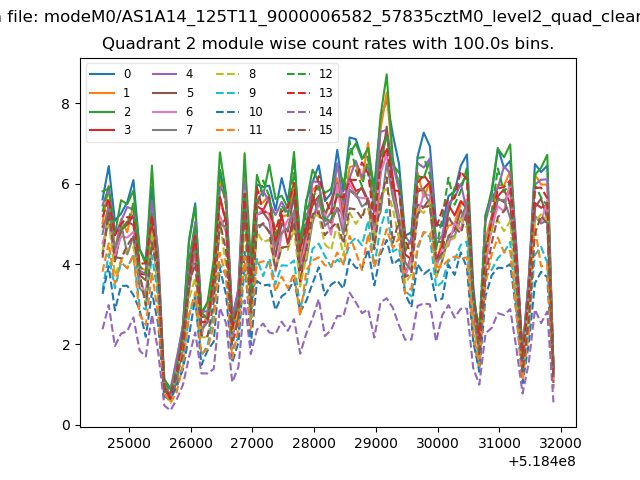
| Module-wise count rates for Quadrant B Data is divided into 100 sec bins |
 |
 |
| Module-wise count rates for Quadrant C Data is divided into 100 sec bins |
 |
 |
| Module-wise count rates for Quadrant D Data is divided into 100 sec bins |
 |
 |
| Parameter | Plot |
|---|---|
| CZT HV Monitor | 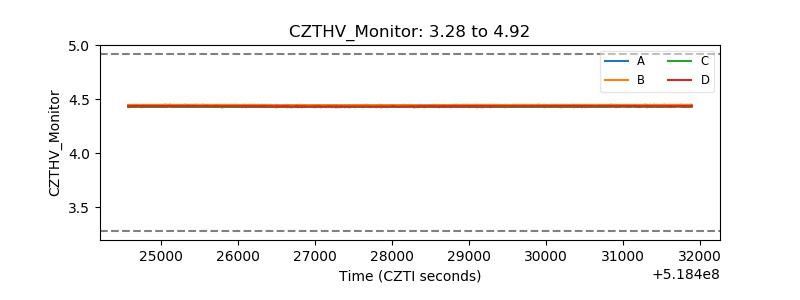 |
| D_VDD | 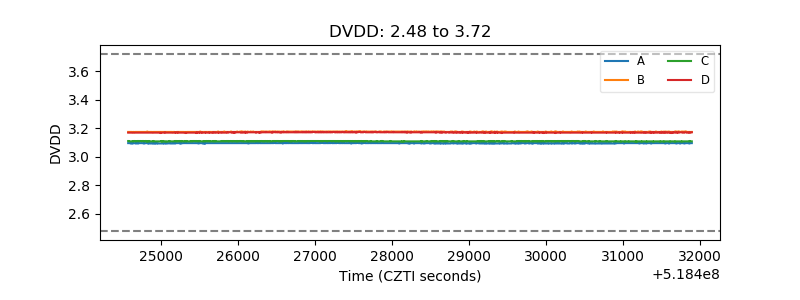 |
| Temperature 1 | 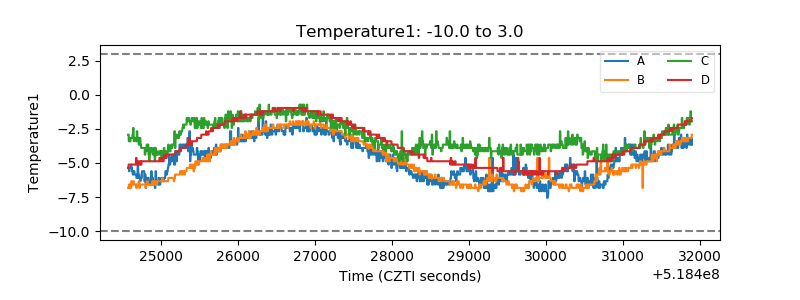 |
| Veto HV Monitor | 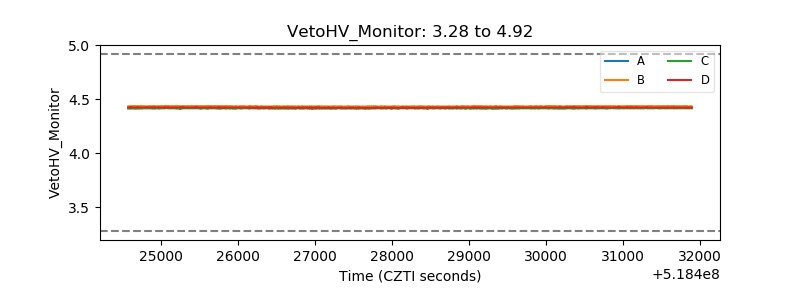 |
| Veto LLD | 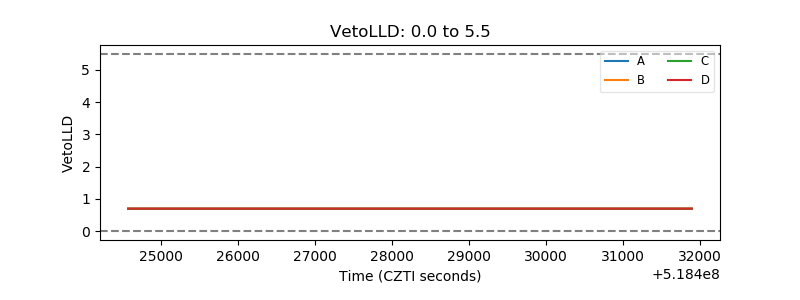 |
| Alpha Counter | 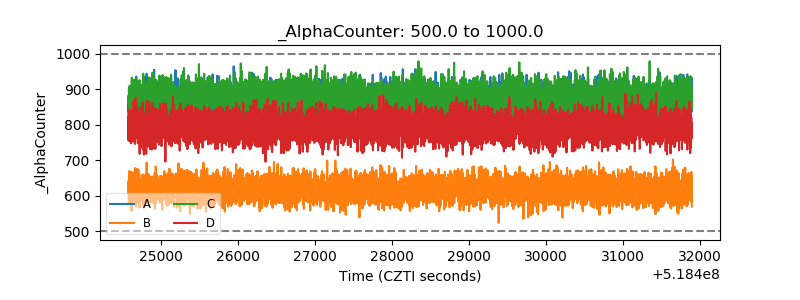 |
| _CPM_Rate | 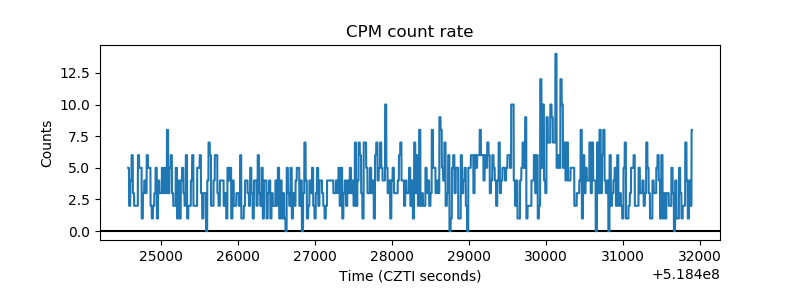 |
| CZT Counter | 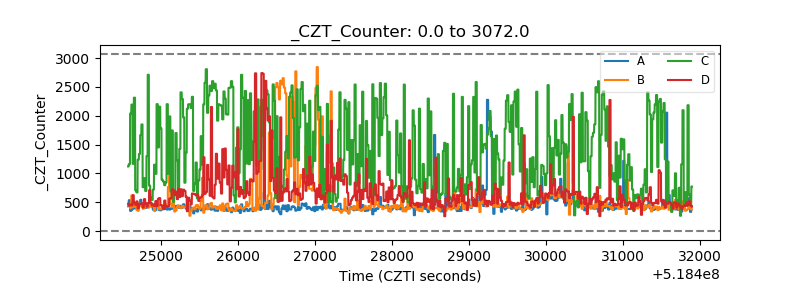 |
| +2.5 Volts monitor |  |
| +5 Volts monitor | 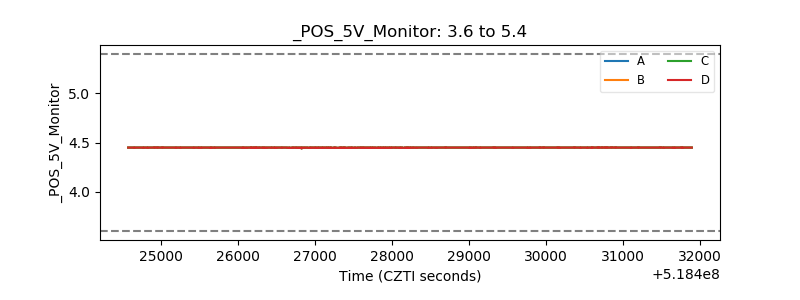 |
| _ROLL_ROT | 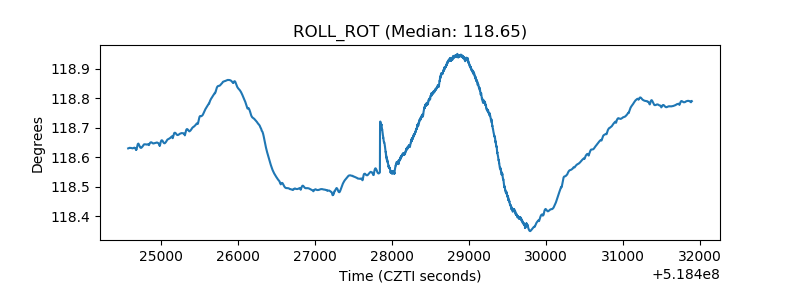 |
| _Roll_DEC | 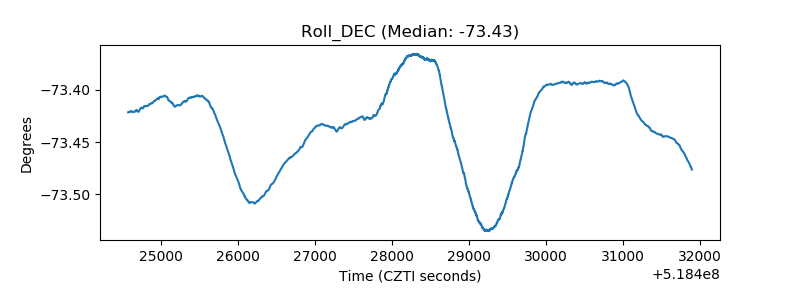 |
| _Roll_RA | 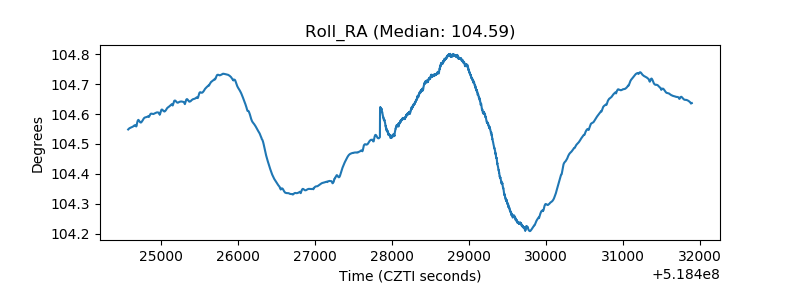 |
| Veto Counter | 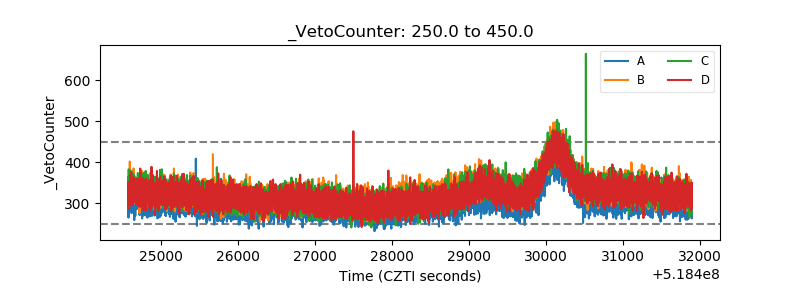 |