| Param | Original file | Final file |
|---|---|---|
| Filename | modeM0/AS1A14_125T11_9000006582_57838cztM0_level2.fits | modeM0/AS1A14_125T11_9000006582_57838cztM0_level2_quad_clean.evt |
| Size (bytes) | 1,715,653,440 | 240,163,200 |
| Size | 1.6 GB | 229.0 MB |
| Events in quadrant A | 9,003,844 | 1,729,577 |
| Events in quadrant B | 9,558,748 | 1,827,418 |
| Events in quadrant C | 27,136,142 | 1,063,550 |
| Events in quadrant D | 16,376,048 | 1,373,099 |
| Mode SS | |||
|---|---|---|---|
| Quadrant | BADHDUFLAG | Total packets | Discarded packets |
| A | 0 | 376 | 0 |
| B | 0 | 376 | 0 |
| C | 0 | 376 | 0 |
| D | 0 | 376 | 0 |
| Mode M0 | |||
|---|---|---|---|
| Quadrant | BADHDUFLAG | Total packets | Discarded packets |
| A | 0 | 40601 | 3 |
| B | 0 | 41749 | 3 |
| C | 0 | 93489 | 3 |
| D | 0 | 61278 | 3 |
| Mode M9 | |||
|---|---|---|---|
| Quadrant | BADHDUFLAG | Total packets | Discarded packets |
| A | 0 | 12 | 0 |
| B | 0 | 12 | 0 |
| C | 0 | 12 | 0 |
| D | 0 | 12 | 0 |
| Quadrant | Total seconds | Saturated seconds | Saturation percentage |
|---|---|---|---|
| A | 18533 | 501 | 2.703286% |
| B | 18533 | 561 | 3.027033% |
| C | 18533 | 6869 | 37.063616% |
| D | 18533 | 2284 | 12.323963% |
Noise dominated data is calculated using 1-second bins in cleaned event files. If a bin has >2000 counts, and if more than 50% of those come from <1% of pixels, then it is considered to be noise-dominated and hence unusable.
| Quadrant | # 1 sec bins | Bins with >0 counts | Bins with >2000 counts | High rate bins dominated by noise | Noise dominated (total time) | Noise dominated (detector-on time) | Marked lightcurve |
|---|---|---|---|---|---|---|---|
| A | 19643 | 18536 | 184 | 184 | 0.94% | 0.99% | 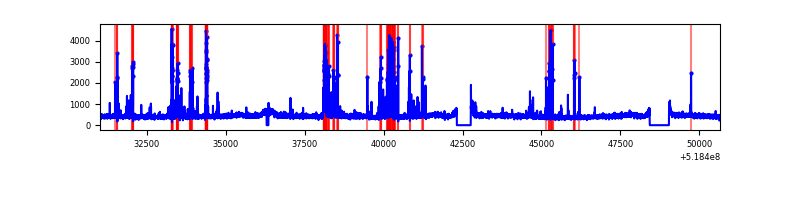 |
| B | 19643 | 18536 | 160 | 160 | 0.81% | 0.86% | 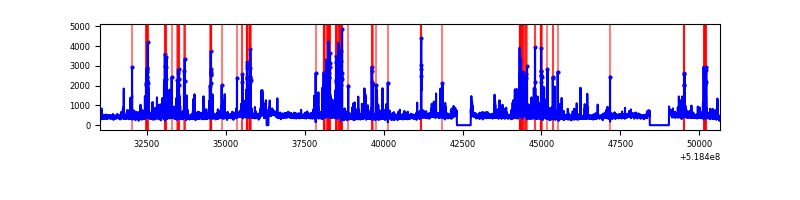 |
| C | 19643 | 18535 | 5371 | 5371 | 27.34% | 28.98% | 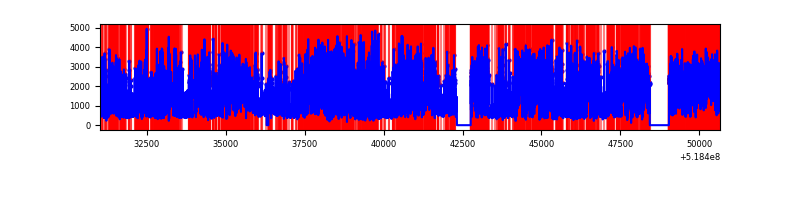 |
| D | 19643 | 18536 | 1995 | 1995 | 10.16% | 10.76% | 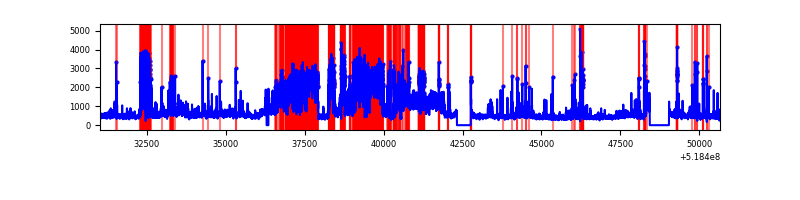 |
Top three noisy pixels from each quadrant. If the there are fewer than three noisy pixels in the level2.evt file, extra rows are filled as -1
| Pixel properties | Quadrant properties | ||||||
|---|---|---|---|---|---|---|---|
| Quadrant | DetID | PixID | Counts | Sigma | Mean | Median | Sigma |
| A | 10 | 251 | 813674 | 1659.28 | 1984 | 1932 | 489.2 |
| A | 3 | 245 | 383162 | 779.27 | 1984 | 1932 | 489.2 |
| A | 4 | 3 | 76182 | 151.77 | 1984 | 1932 | 489.2 |
| B | 2 | 249 | 684017 | 1653.33 | 1949 | 1875 | 412.6 |
| B | 5 | 185 | 417019 | 1006.2 | 1949 | 1875 | 412.6 |
| B | 10 | 247 | 160424 | 384.28 | 1949 | 1875 | 412.6 |
| C | 9 | 38 | 16072574 | 36656.13 | 1612 | 1592 | 438.4 |
| C | 15 | 224 | 4089226 | 9323.44 | 1612 | 1592 | 438.4 |
| C | 14 | 254 | 225364 | 510.4 | 1612 | 1592 | 438.4 |
| D | 12 | 110 | 6708790 | 12697.7 | 1864 | 1780 | 528.2 |
| D | 3 | 224 | 654906 | 1236.5 | 1864 | 1780 | 528.2 |
| D | 2 | 62 | 287968 | 541.81 | 1864 | 1780 | 528.2 |
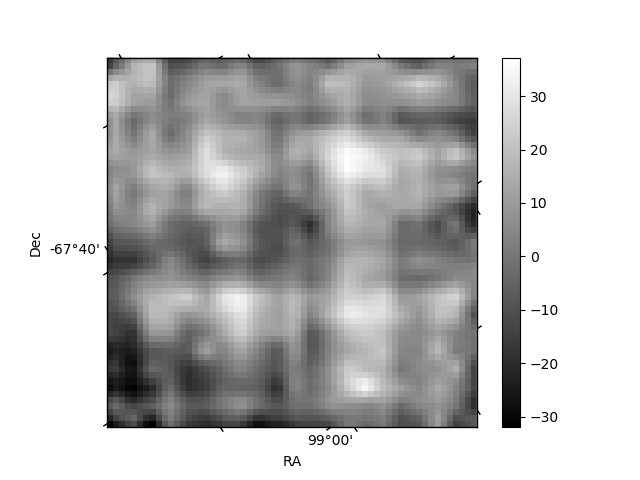
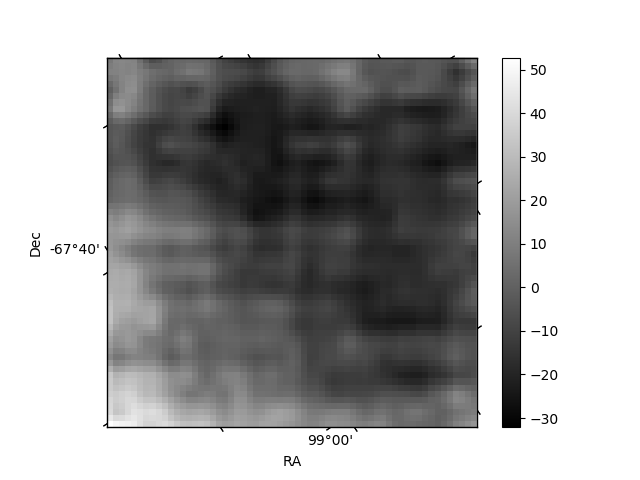
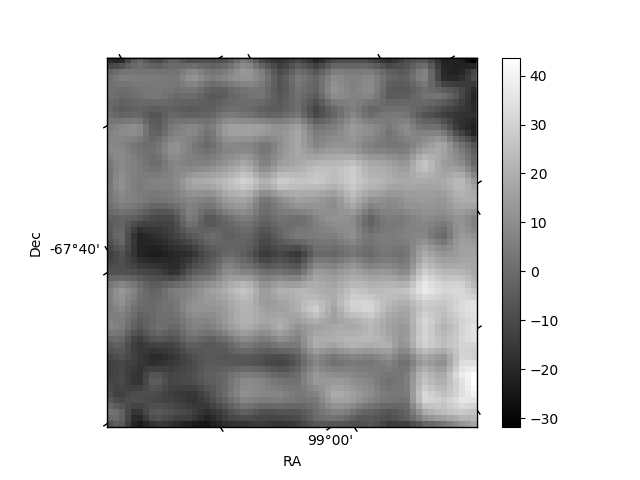
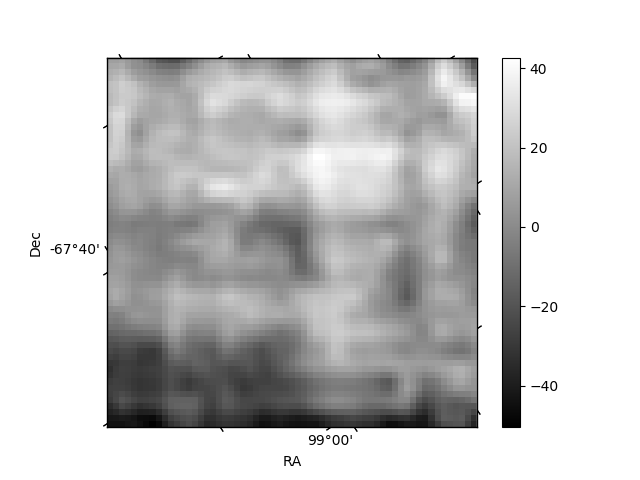
Histogram calculated using DETX and DETY for each event in the final _common_clean file
| Quadrant A | 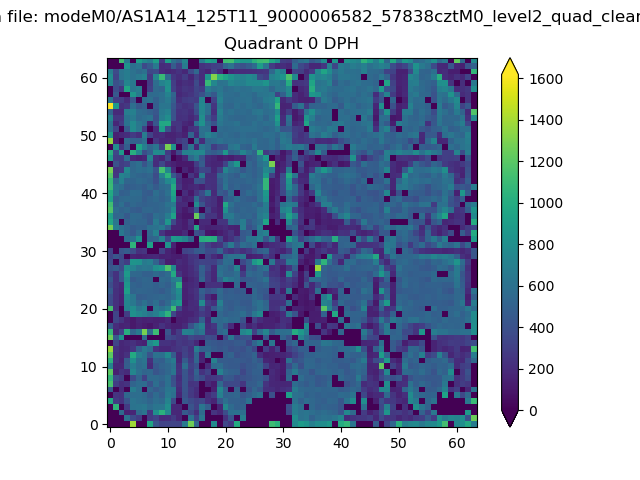 |
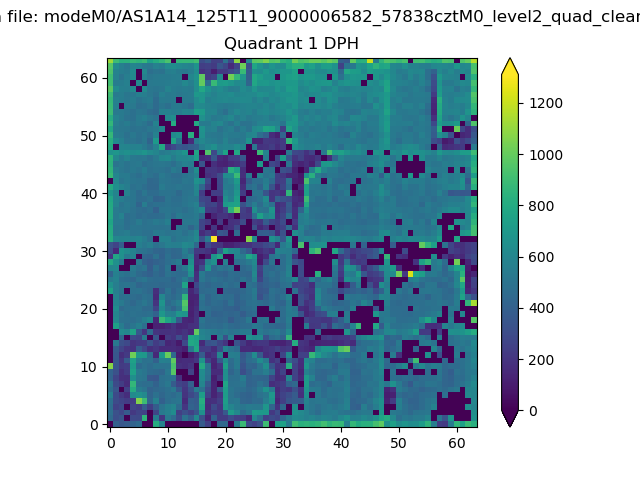 |
Quadrant B |
|---|---|---|---|
| Quadrant D | 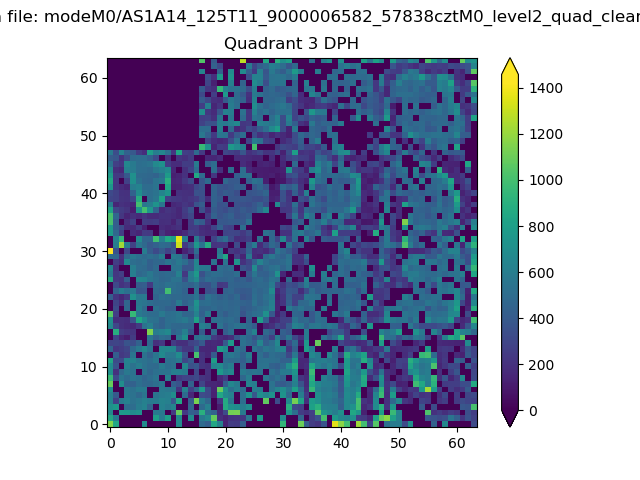 |
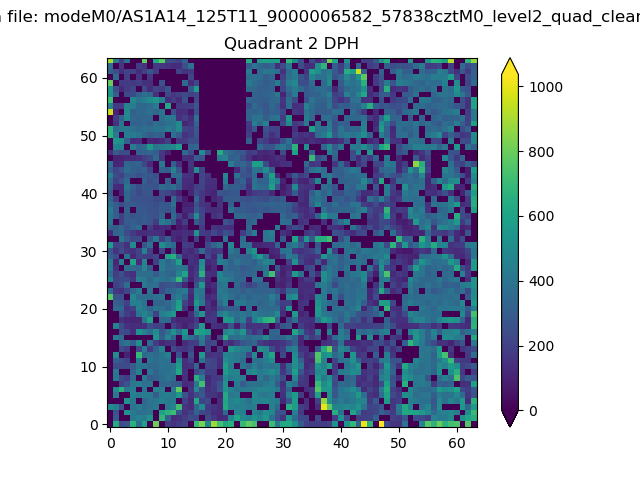 |
Quadrant C |
| Plot type | Count rate plots | Images |
|---|---|---|
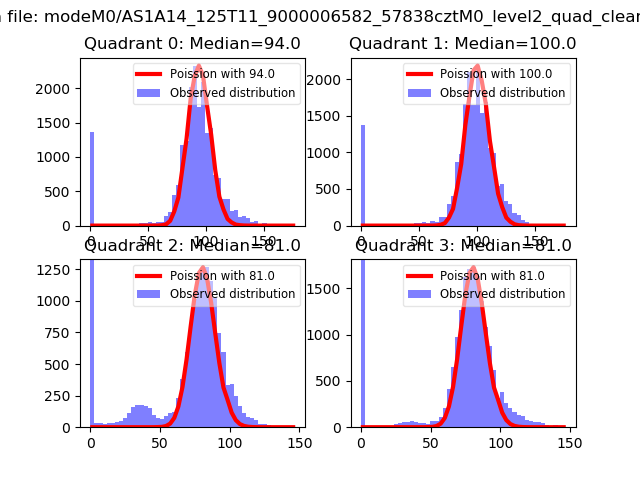
| Comparison with Poisson distribution Blue bars denote a histogram of data divided into 1 sec bins. Red curve is a Poisson curve with rate = median count rate of data. |
 |
 |
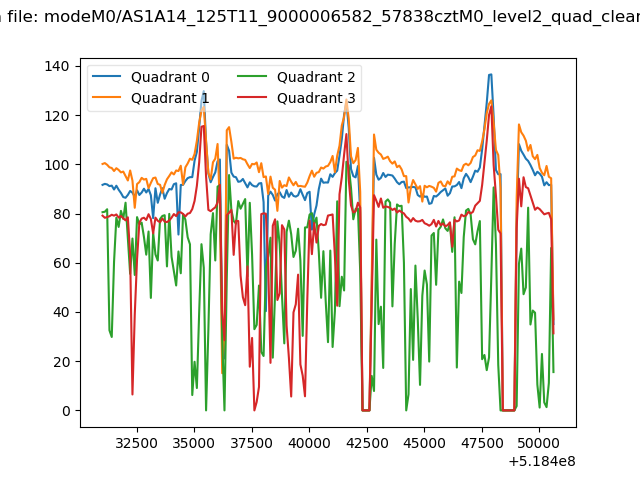
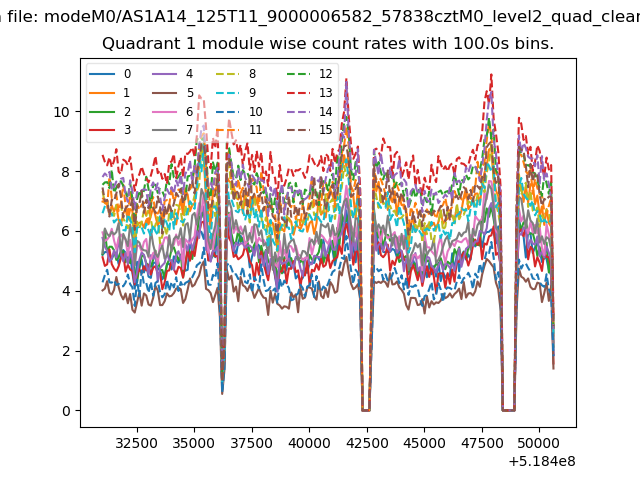
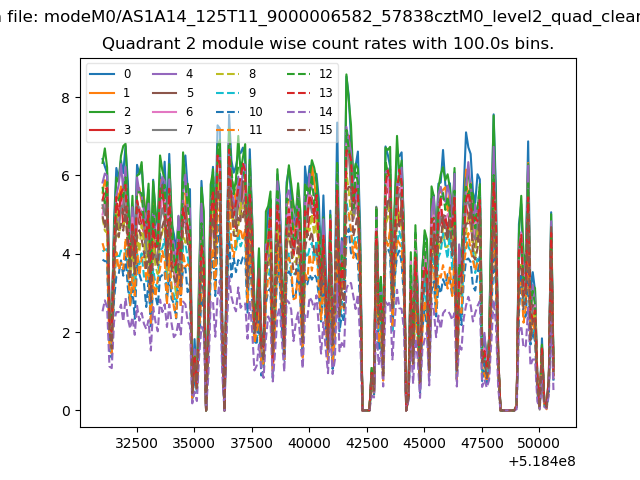
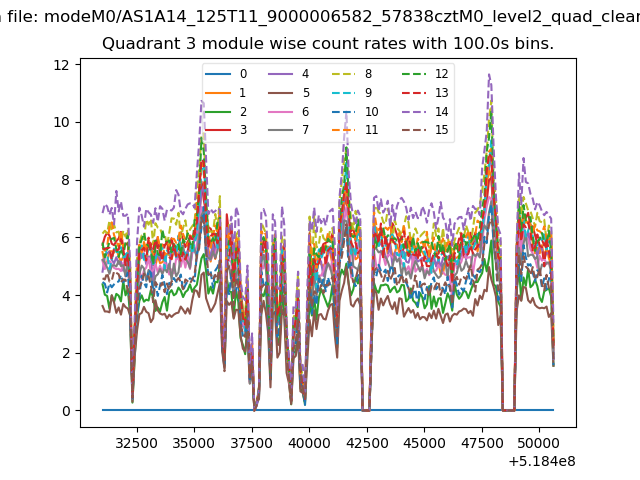
| Quadrant-wise count rates Data is divided into 100 sec bins |
 |
|
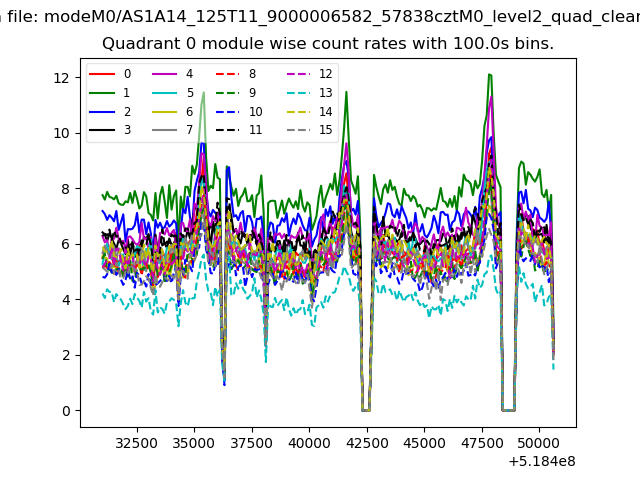
| Module-wise count rates for Quadrant A Data is divided into 100 sec bins |
 |
 |
| Module-wise count rates for Quadrant B Data is divided into 100 sec bins |
 |
 |
| Module-wise count rates for Quadrant C Data is divided into 100 sec bins |
 |
 |
| Module-wise count rates for Quadrant D Data is divided into 100 sec bins |
 |
 |
| Parameter | Plot |
|---|---|
| CZT HV Monitor | 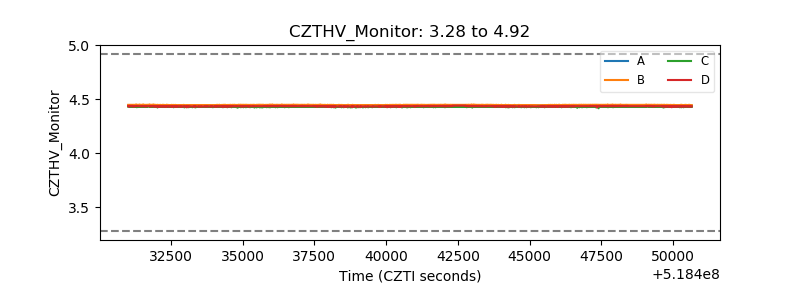 |
| D_VDD | 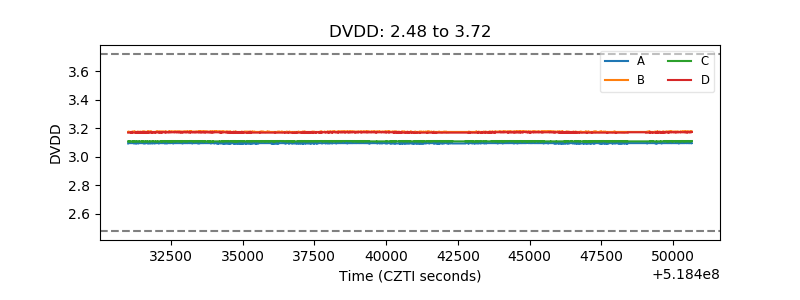 |
| Temperature 1 | 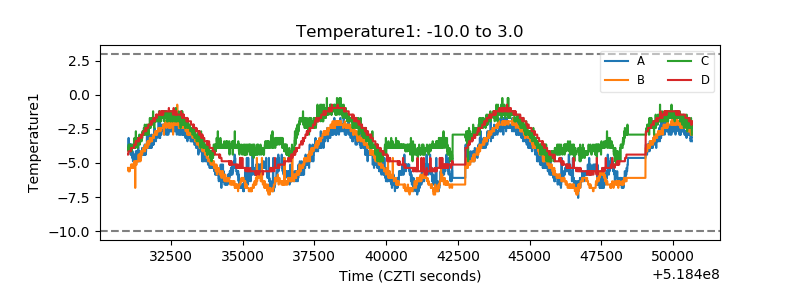 |
| Veto HV Monitor | 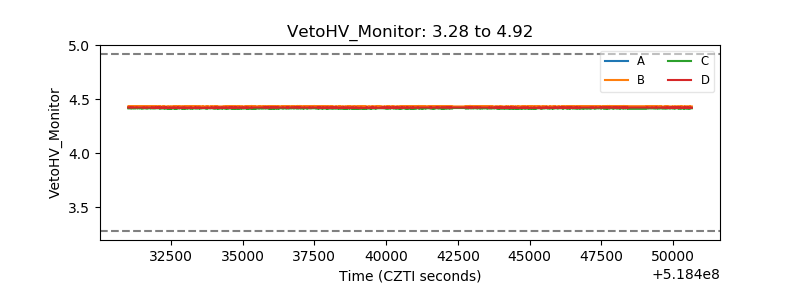 |
| Veto LLD | 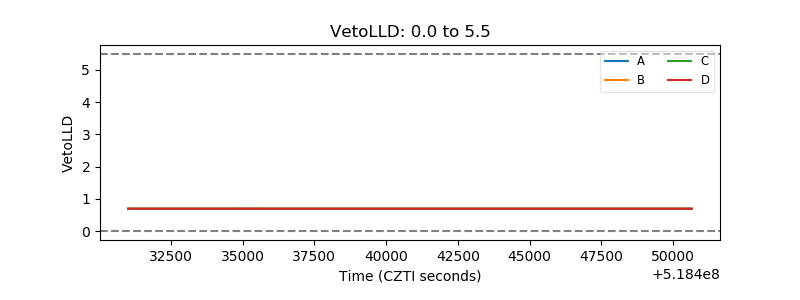 |
| Alpha Counter | 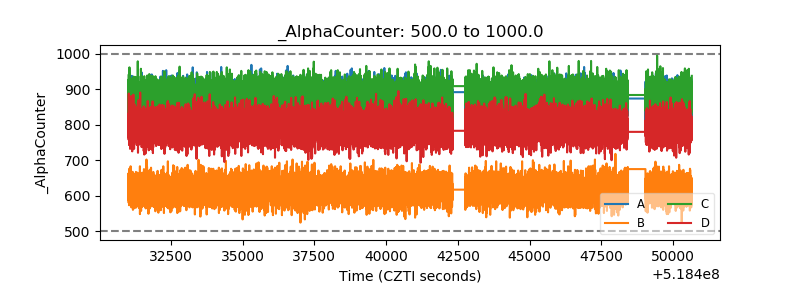 |
| _CPM_Rate | 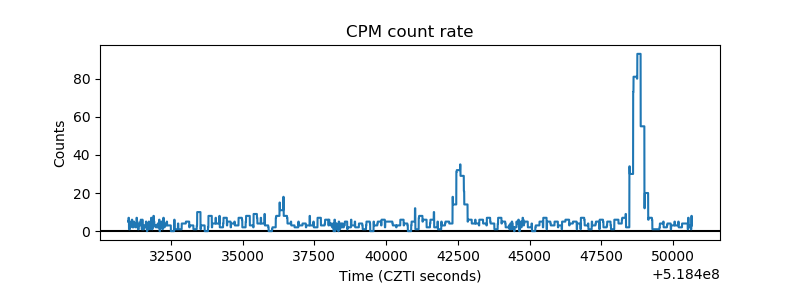 |
| CZT Counter | 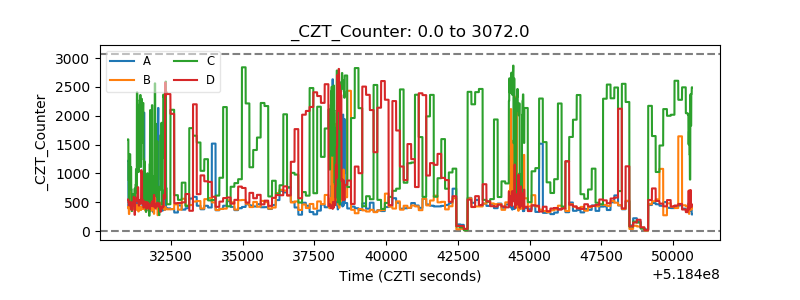 |
| +2.5 Volts monitor | 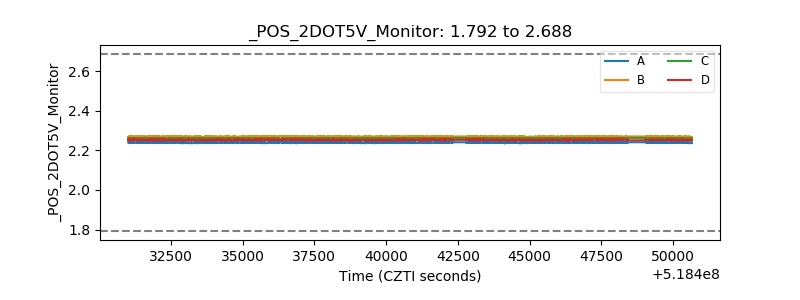 |
| +5 Volts monitor | 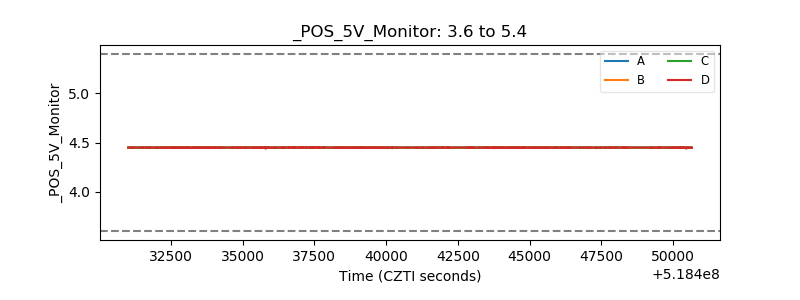 |
| _ROLL_ROT | 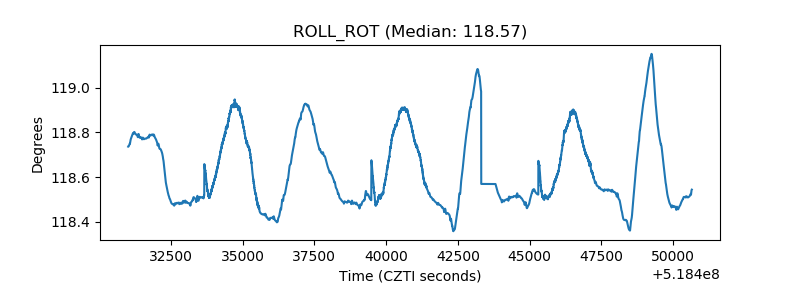 |
| _Roll_DEC | 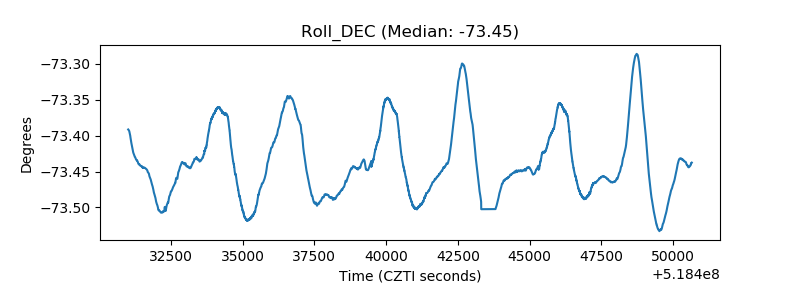 |
| _Roll_RA | 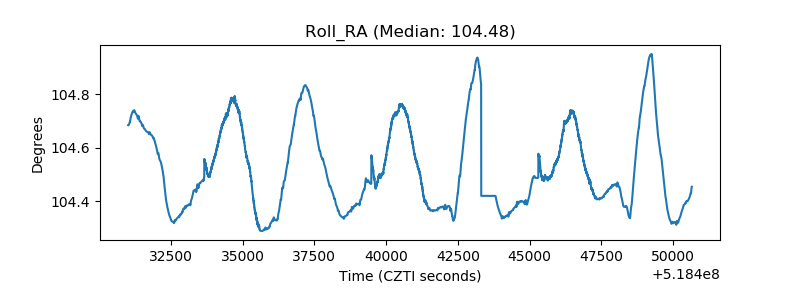 |
| Veto Counter | 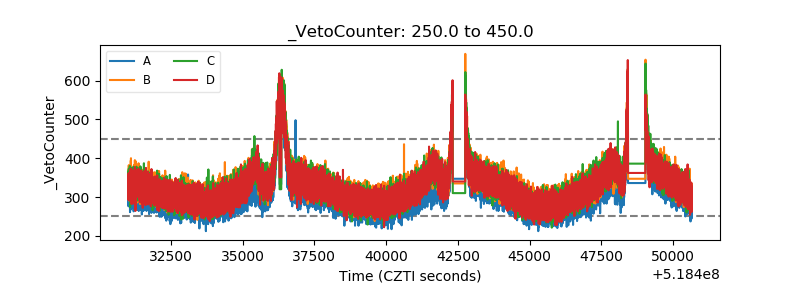 |