| Param | Original file | Final file |
|---|---|---|
| Filename | modeM0/AS1A14_125T11_9000006582_57839cztM0_level2.fits | modeM0/AS1A14_125T11_9000006582_57839cztM0_level2_quad_clean.evt |
| Size (bytes) | 2,995,159,680 | 419,860,800 |
| Size | 2.8 GB | 400.4 MB |
| Events in quadrant A | 14,581,005 | 3,006,617 |
| Events in quadrant B | 17,083,579 | 3,142,001 |
| Events in quadrant C | 49,246,127 | 1,836,052 |
| Events in quadrant D | 27,516,093 | 2,551,190 |
| Mode SS | |||
|---|---|---|---|
| Quadrant | BADHDUFLAG | Total packets | Discarded packets |
| A | 0 | 638 | 0 |
| B | 0 | 638 | 0 |
| C | 0 | 636 | 0 |
| D | 0 | 636 | 0 |
| Mode M0 | |||
|---|---|---|---|
| Quadrant | BADHDUFLAG | Total packets | Discarded packets |
| A | 0 | 67335 | 3 |
| B | 0 | 73778 | 3 |
| C | 0 | 168320 | 8 |
| D | 0 | 103618 | 3 |
| Mode M9 | |||
|---|---|---|---|
| Quadrant | BADHDUFLAG | Total packets | Discarded packets |
| A | 0 | 15 | 0 |
| B | 0 | 15 | 0 |
| C | 0 | 15 | 0 |
| D | 0 | 15 | 0 |
| Quadrant | Total seconds | Saturated seconds | Saturation percentage |
|---|---|---|---|
| A | 31658 | 522 | 1.648872% |
| B | 31658 | 1205 | 3.806305% |
| C | 31657 | 13008 | 41.090438% |
| D | 31659 | 2844 | 8.983228% |
Noise dominated data is calculated using 1-second bins in cleaned event files. If a bin has >2000 counts, and if more than 50% of those come from <1% of pixels, then it is considered to be noise-dominated and hence unusable.
| Quadrant | # 1 sec bins | Bins with >0 counts | Bins with >2000 counts | High rate bins dominated by noise | Noise dominated (total time) | Noise dominated (detector-on time) | Marked lightcurve |
|---|---|---|---|---|---|---|---|
| A | 37866 | 31662 | 205 | 205 | 0.54% | 0.65% | 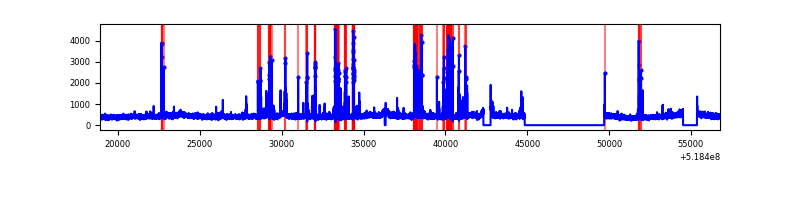 |
| B | 37866 | 31662 | 635 | 635 | 1.68% | 2.01% | 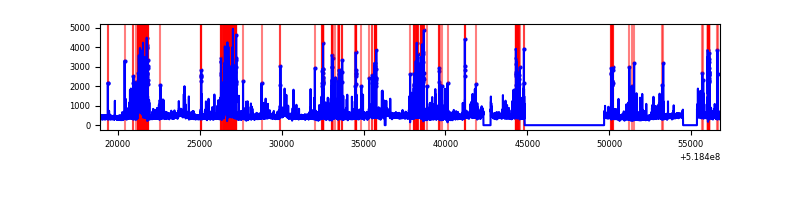 |
| C | 37866 | 31661 | 10303 | 10303 | 27.21% | 32.54% | 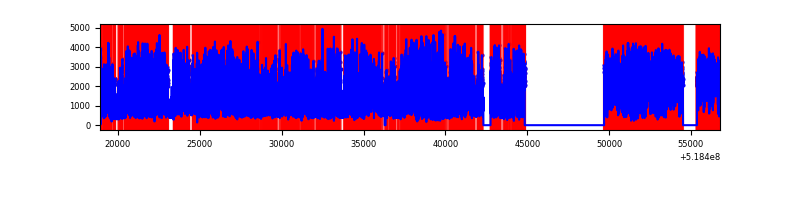 |
| D | 37867 | 31663 | 2586 | 2586 | 6.83% | 8.17% | 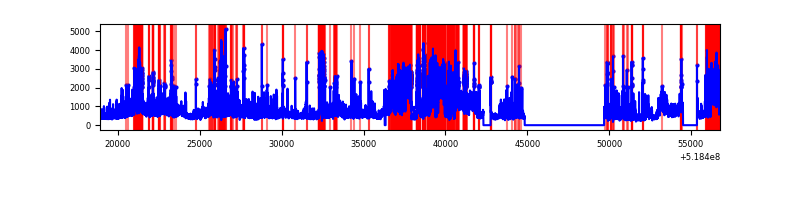 |
Top three noisy pixels from each quadrant. If the there are fewer than three noisy pixels in the level2.evt file, extra rows are filled as -1
| Pixel properties | Quadrant properties | ||||||
|---|---|---|---|---|---|---|---|
| Quadrant | DetID | PixID | Counts | Sigma | Mean | Median | Sigma |
| A | 10 | 251 | 973232 | 1165.62 | 3371 | 3287 | 832.1 |
| A | 3 | 245 | 351099 | 417.98 | 3371 | 3287 | 832.1 |
| A | 4 | 3 | 85082 | 98.3 | 3371 | 3287 | 832.1 |
| B | 2 | 249 | 1809878 | 2596.34 | 3291 | 3167 | 695.9 |
| B | 5 | 185 | 1046996 | 1500.04 | 3291 | 3167 | 695.9 |
| B | 10 | 247 | 334144 | 475.63 | 3291 | 3167 | 695.9 |
| C | 9 | 38 | 29284596 | 39927.58 | 2701 | 2663 | 733.4 |
| C | 15 | 224 | 7982464 | 10880.91 | 2701 | 2663 | 733.4 |
| C | 14 | 254 | 293681 | 396.82 | 2701 | 2663 | 733.4 |
| D | 12 | 110 | 9966645 | 11107.12 | 3187 | 3043 | 897.0 |
| D | 3 | 224 | 1040173 | 1156.16 | 3187 | 3043 | 897.0 |
| D | 8 | 160 | 947077 | 1052.38 | 3187 | 3043 | 897.0 |
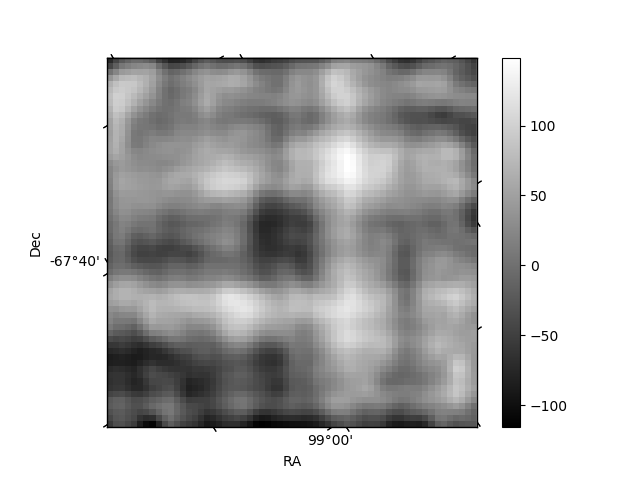
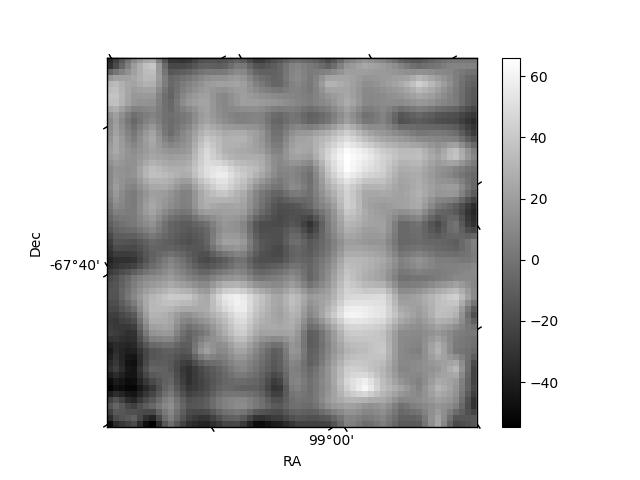
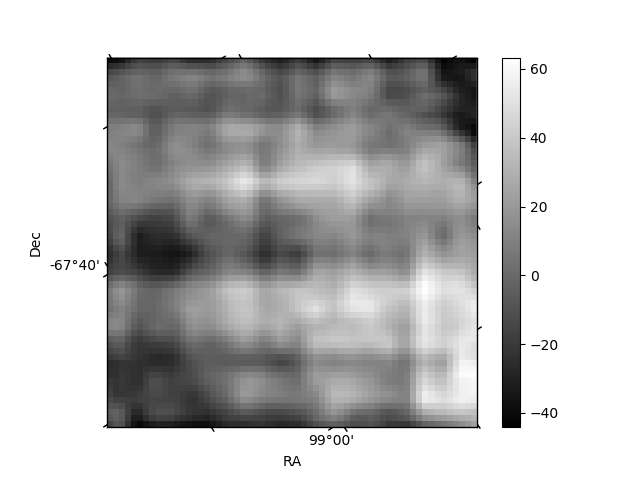
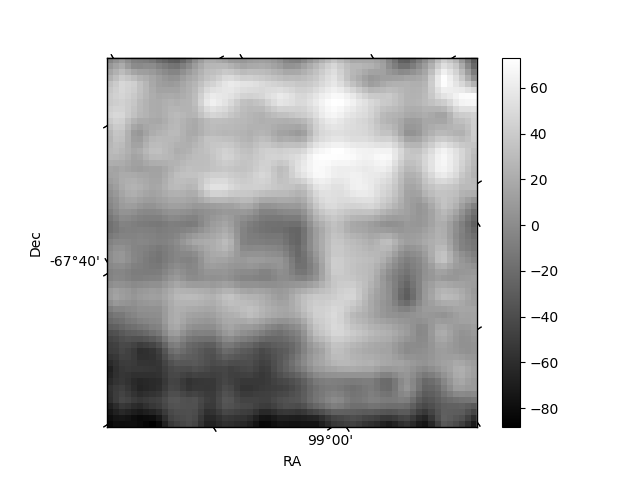
Histogram calculated using DETX and DETY for each event in the final _common_clean file
| Quadrant A | 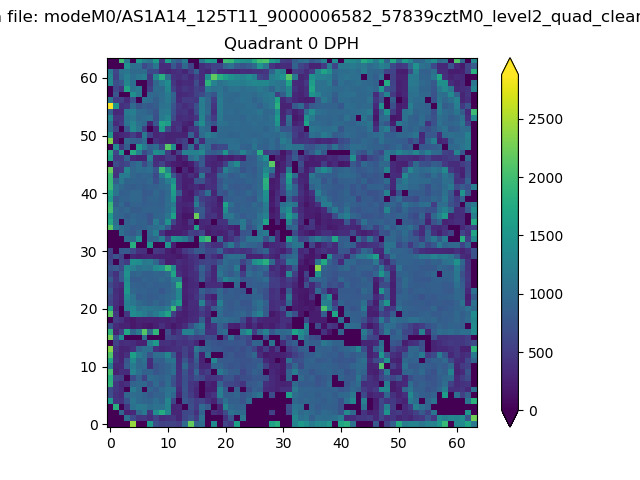 |
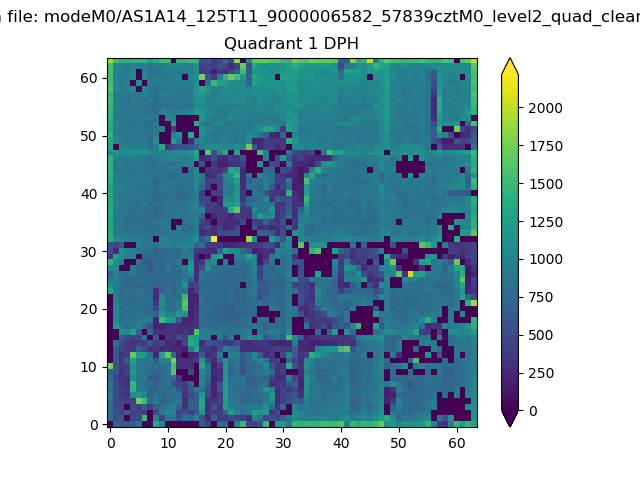 |
Quadrant B |
|---|---|---|---|
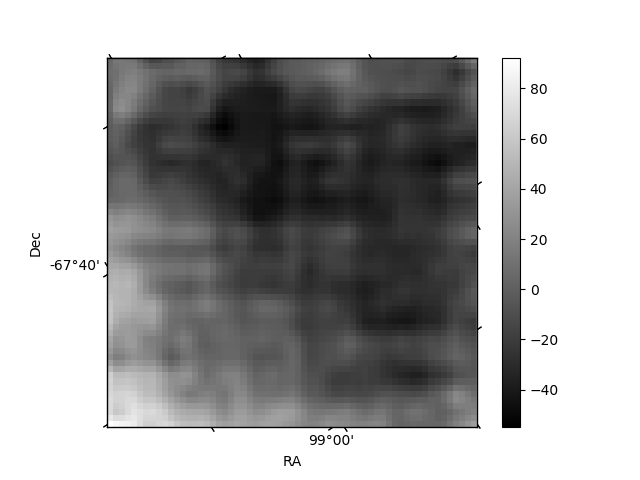
| Quadrant D | 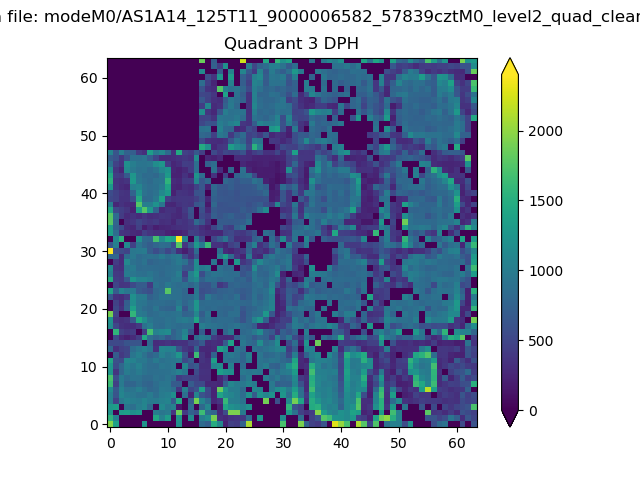 |
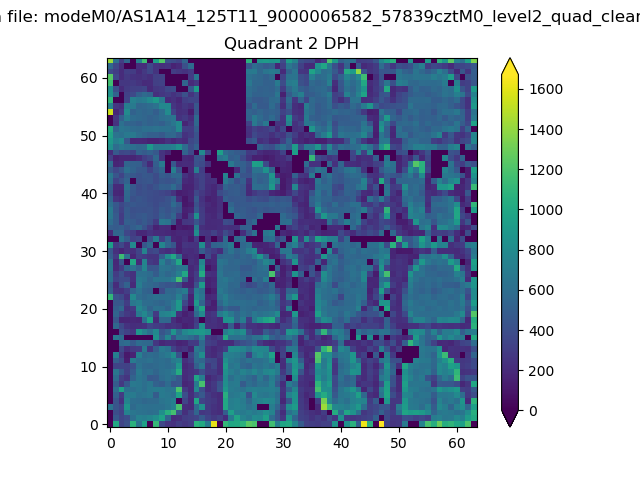 |
Quadrant C |
| Plot type | Count rate plots | Images |
|---|---|---|
| Comparison with Poisson distribution Blue bars denote a histogram of data divided into 1 sec bins. Red curve is a Poisson curve with rate = median count rate of data. |
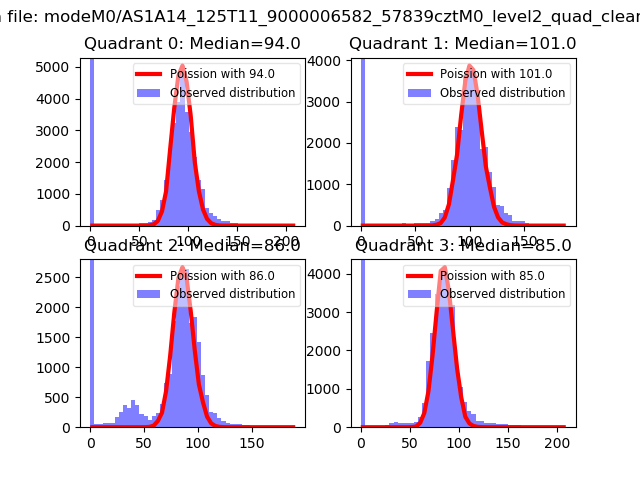 |
 |
| Quadrant-wise count rates Data is divided into 100 sec bins |
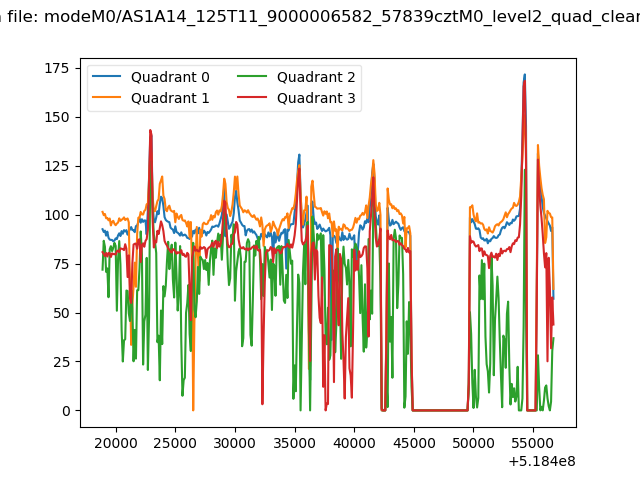 |
|
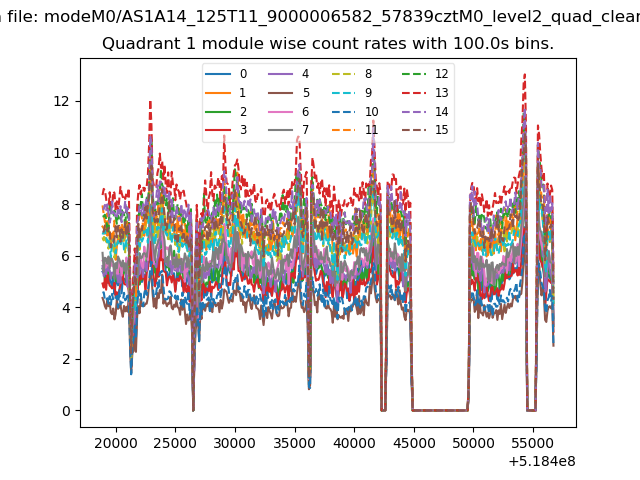
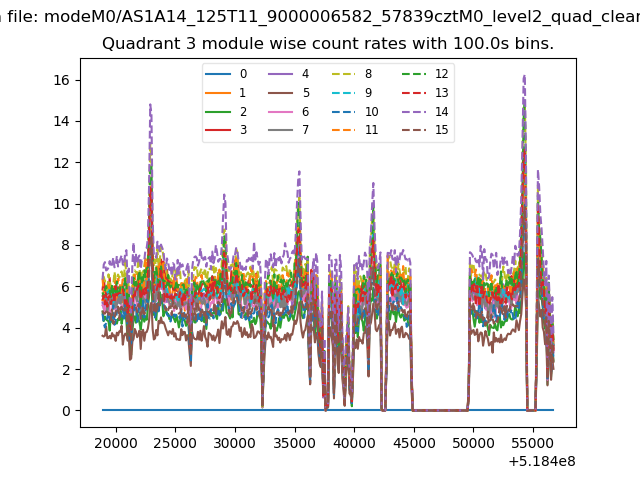
| Module-wise count rates for Quadrant A Data is divided into 100 sec bins |
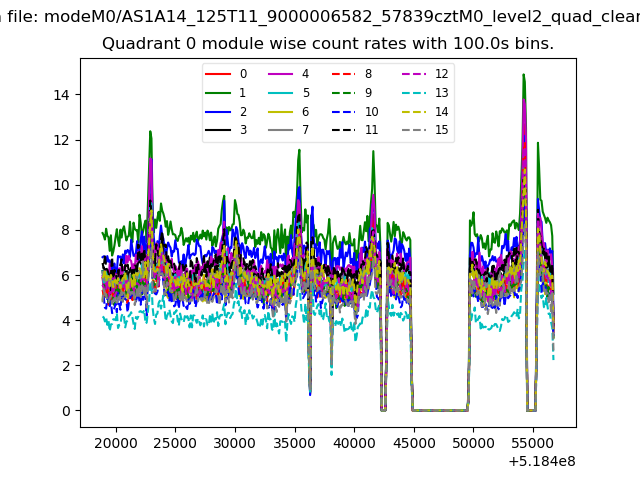 |
 |
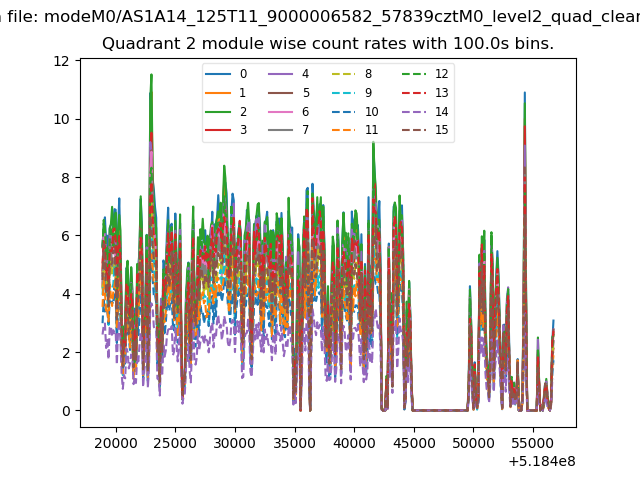
| Module-wise count rates for Quadrant B Data is divided into 100 sec bins |
 |
 |
| Module-wise count rates for Quadrant C Data is divided into 100 sec bins |
 |
 |
| Module-wise count rates for Quadrant D Data is divided into 100 sec bins |
 |
 |
| Parameter | Plot |
|---|---|
| CZT HV Monitor | 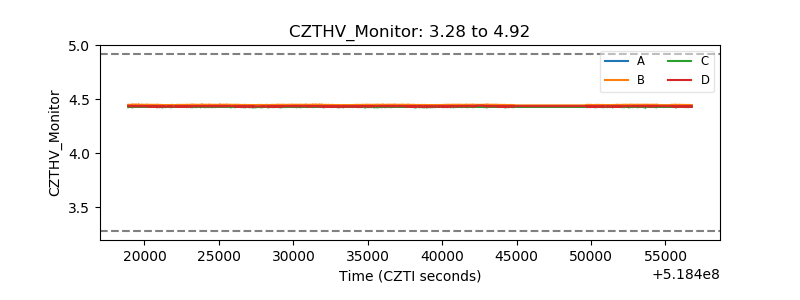 |
| D_VDD | 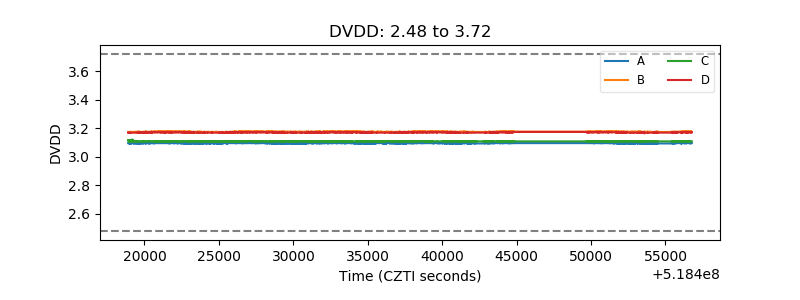 |
| Temperature 1 | 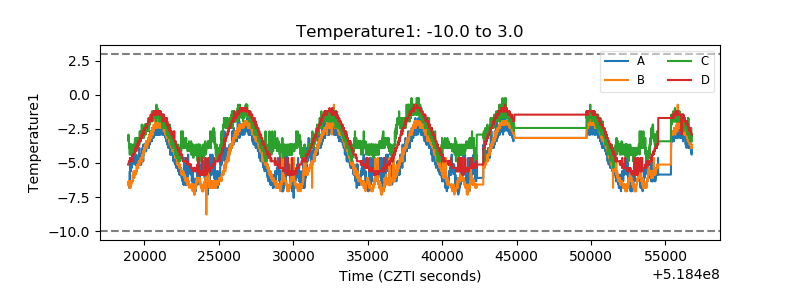 |
| Veto HV Monitor | 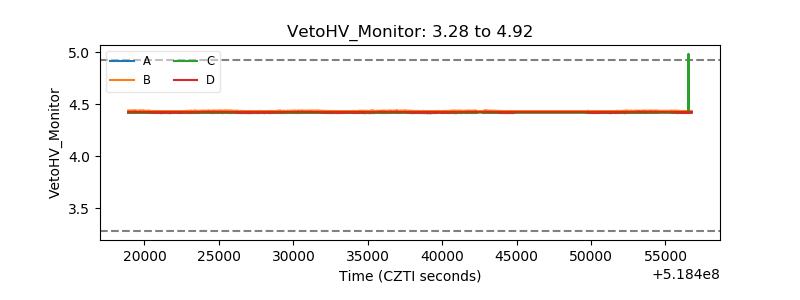 |
| Veto LLD | 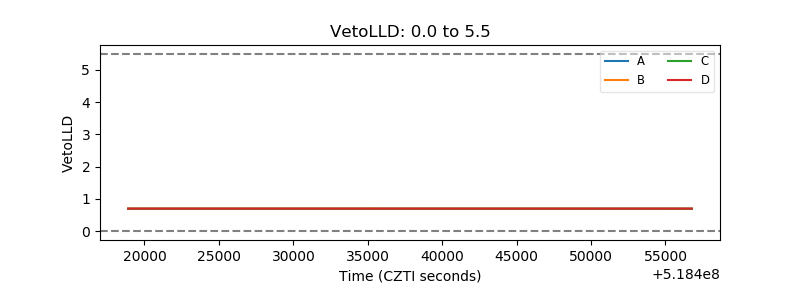 |
| Alpha Counter | 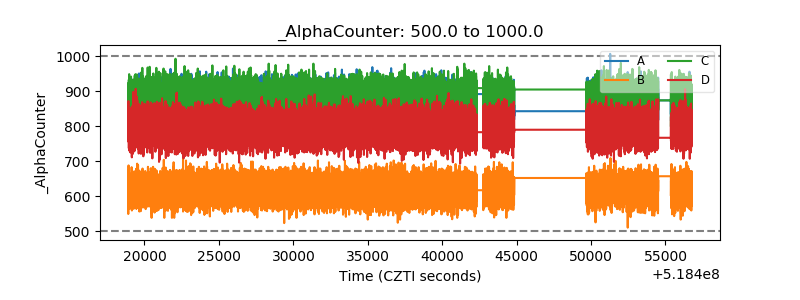 |
| _CPM_Rate | 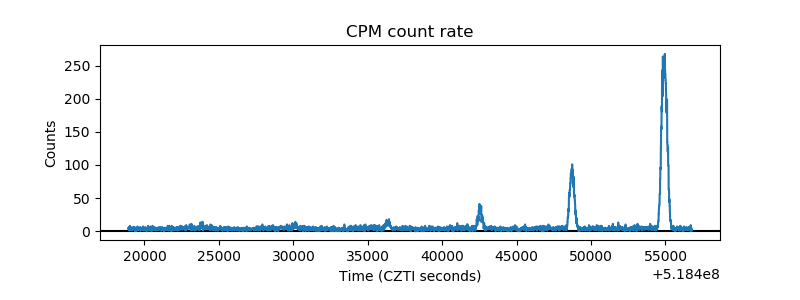 |
| CZT Counter | 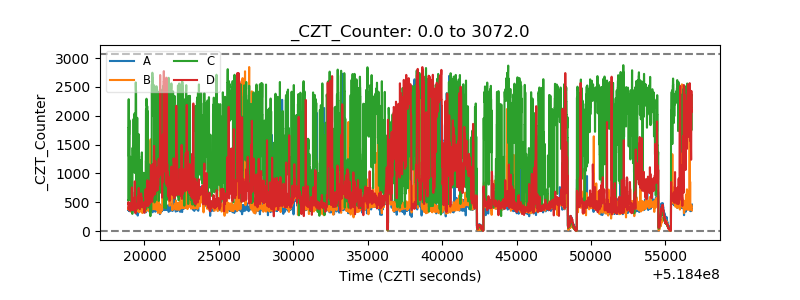 |
| +2.5 Volts monitor | 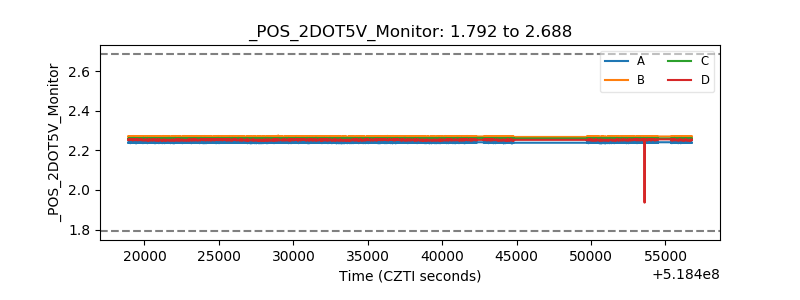 |
| +5 Volts monitor | 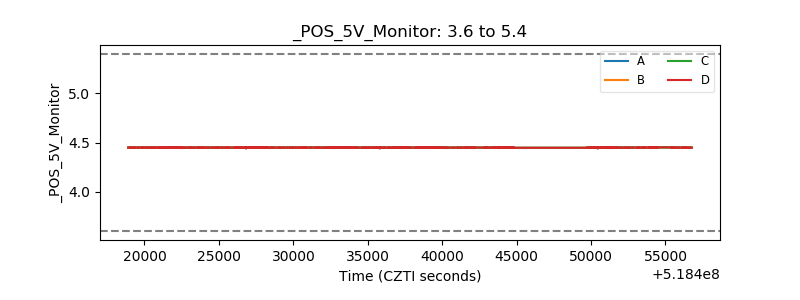 |
| _ROLL_ROT | 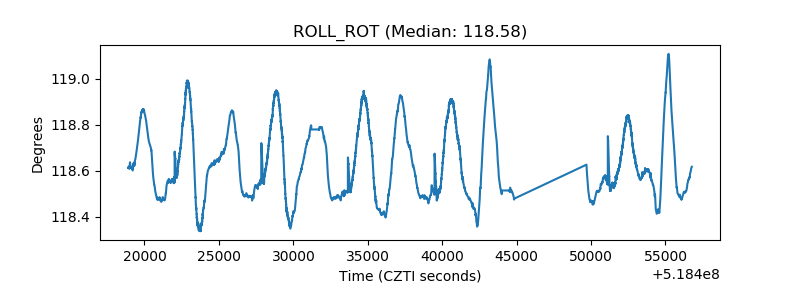 |
| _Roll_DEC | 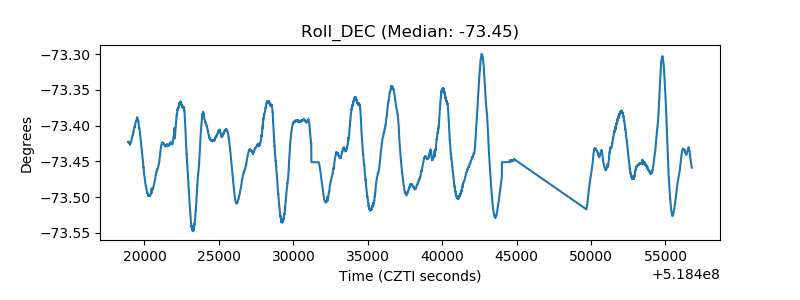 |
| _Roll_RA | 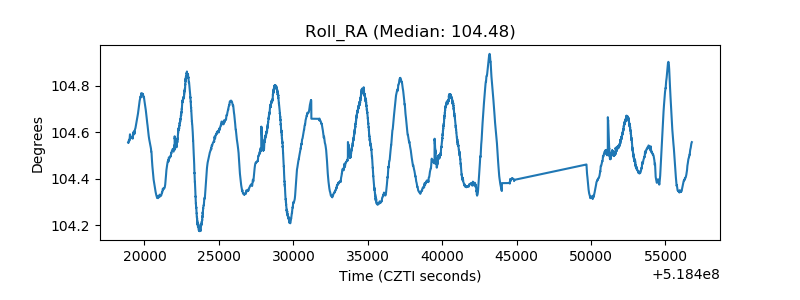 |
| Veto Counter | 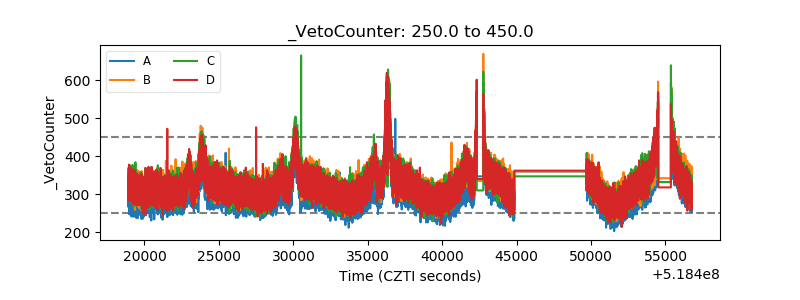 |