| Param | Original file | Final file |
|---|---|---|
| Filename | modeM0/AS1A14_125T11_9000006582_57842cztM0_level2.fits | modeM0/AS1A14_125T11_9000006582_57842cztM0_level2_quad_clean.evt |
| Size (bytes) | 618,344,640 | 90,432,000 |
| Size | 589.7 MB | 86.2 MB |
| Events in quadrant A | 2,804,834 | 632,199 |
| Events in quadrant B | 2,942,389 | 672,366 |
| Events in quadrant C | 7,482,226 | 509,910 |
| Events in quadrant D | 9,170,651 | 482,622 |
| Mode SS | |||
|---|---|---|---|
| Quadrant | BADHDUFLAG | Total packets | Discarded packets |
| A | 0 | 128 | 0 |
| B | 0 | 128 | 0 |
| C | 0 | 128 | 0 |
| D | 0 | 128 | 0 |
| Mode M0 | |||
|---|---|---|---|
| Quadrant | BADHDUFLAG | Total packets | Discarded packets |
| A | 0 | 13273 | 13 |
| B | 0 | 13428 | 15 |
| C | 0 | 26710 | 54 |
| D | 0 | 31801 | 100 |
| Mode M9 | |||
|---|---|---|---|
| Quadrant | BADHDUFLAG | Total packets | Discarded packets |
| A | 0 | 11 | 0 |
| B | 0 | 11 | 0 |
| C | 0 | 11 | 0 |
| D | 0 | 11 | 0 |
| Quadrant | Total seconds | Saturated seconds | Saturation percentage |
|---|---|---|---|
| A | 6325 | 40 | 0.632411% |
| B | 6323 | 37 | 0.585165% |
| C | 6320 | 1043 | 16.503165% |
| D | 6314 | 1039 | 16.455496% |
Noise dominated data is calculated using 1-second bins in cleaned event files. If a bin has >2000 counts, and if more than 50% of those come from <1% of pixels, then it is considered to be noise-dominated and hence unusable.
| Quadrant | # 1 sec bins | Bins with >0 counts | Bins with >2000 counts | High rate bins dominated by noise | Noise dominated (total time) | Noise dominated (detector-on time) | Marked lightcurve |
|---|---|---|---|---|---|---|---|
| A | 7420 | 6331 | 24 | 24 | 0.32% | 0.38% | 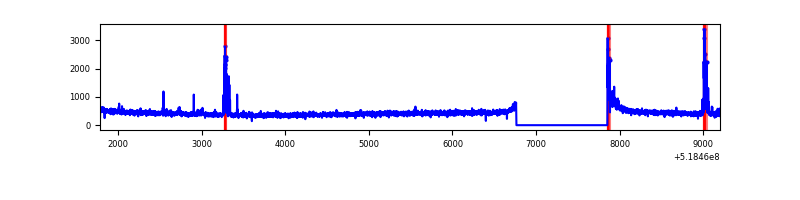 |
| B | 7420 | 6331 | 16 | 16 | 0.22% | 0.25% | 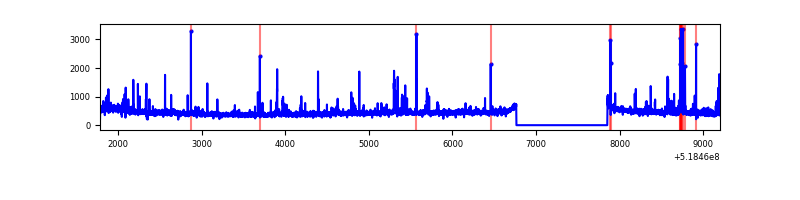 |
| C | 7419 | 6328 | 894 | 894 | 12.05% | 14.13% | 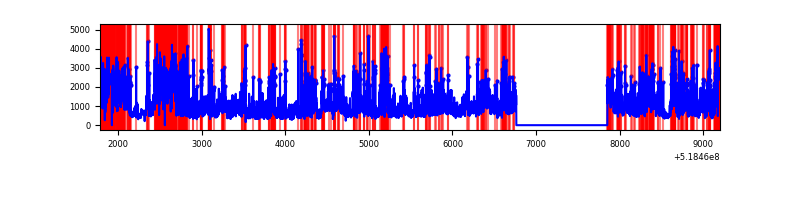 |
| D | 7420 | 6331 | 1161 | 1161 | 15.65% | 18.34% | 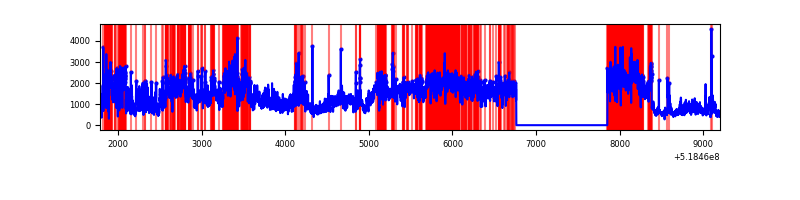 |
Top three noisy pixels from each quadrant. If the there are fewer than three noisy pixels in the level2.evt file, extra rows are filled as -1
| Pixel properties | Quadrant properties | ||||||
|---|---|---|---|---|---|---|---|
| Quadrant | DetID | PixID | Counts | Sigma | Mean | Median | Sigma |
| A | 3 | 245 | 133103 | 790.35 | 677 | 660 | 167.6 |
| A | 3 | 14 | 34989 | 204.86 | 677 | 660 | 167.6 |
| A | 13 | 248 | 11349 | 63.79 | 677 | 660 | 167.6 |
| B | 5 | 185 | 105679 | 734.45 | 668 | 642 | 143.0 |
| B | 0 | 213 | 50120 | 345.96 | 668 | 642 | 143.0 |
| B | 0 | 153 | 21043 | 142.65 | 668 | 642 | 143.0 |
| C | 9 | 38 | 3409350 | 20563.44 | 602 | 596 | 165.8 |
| C | 15 | 224 | 942580 | 5682.55 | 602 | 596 | 165.8 |
| C | 15 | 208 | 347706 | 2093.95 | 602 | 596 | 165.8 |
| D | 12 | 110 | 5872956 | 33075.62 | 619 | 592 | 177.5 |
| D | 8 | 160 | 544493 | 3063.48 | 619 | 592 | 177.5 |
| D | 3 | 12 | 116124 | 650.72 | 619 | 592 | 177.5 |
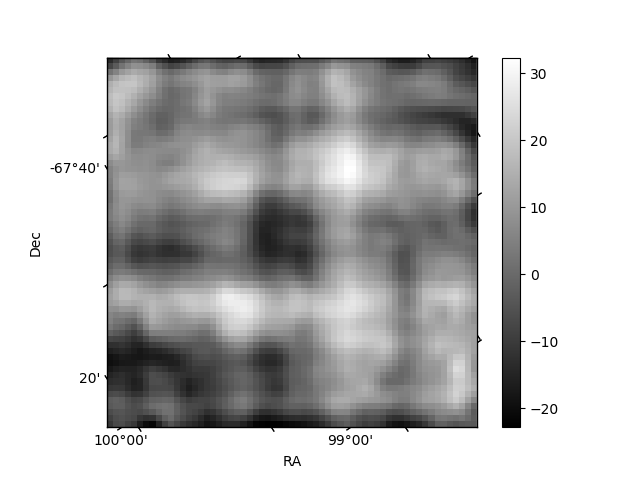
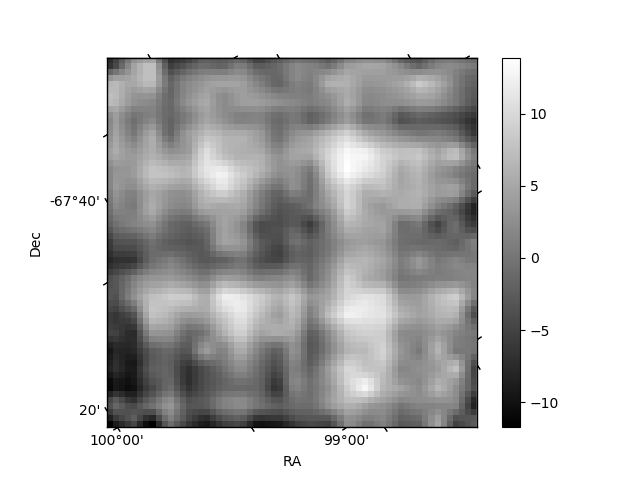
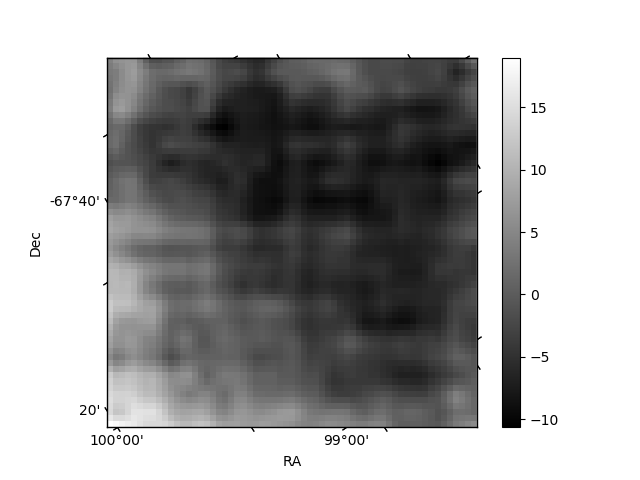
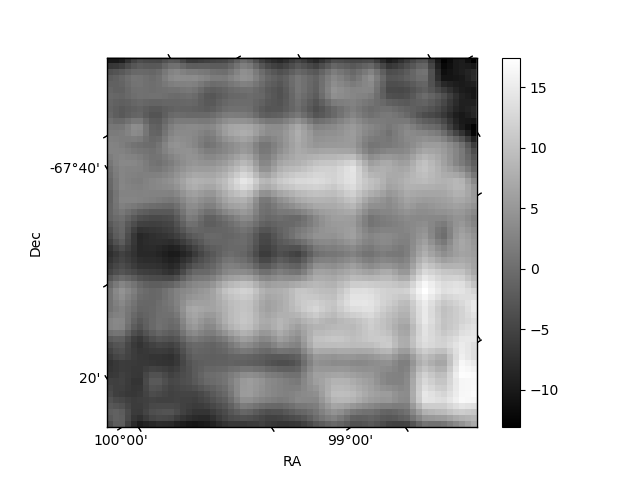
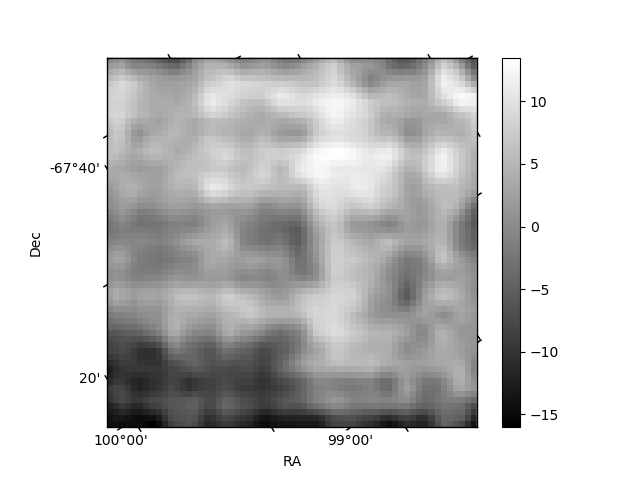
Histogram calculated using DETX and DETY for each event in the final _common_clean file
| Quadrant A | 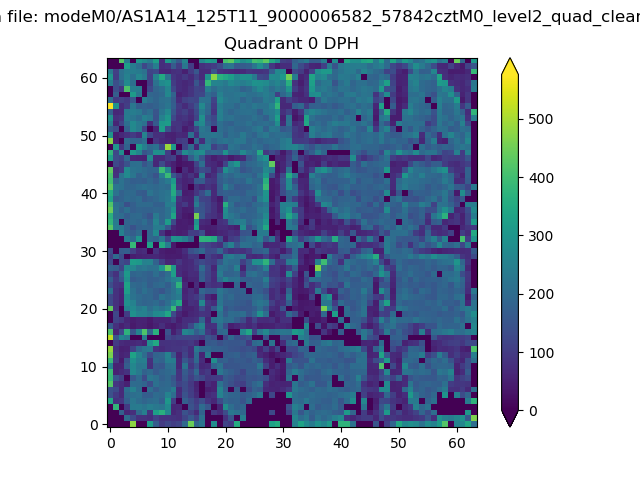 |
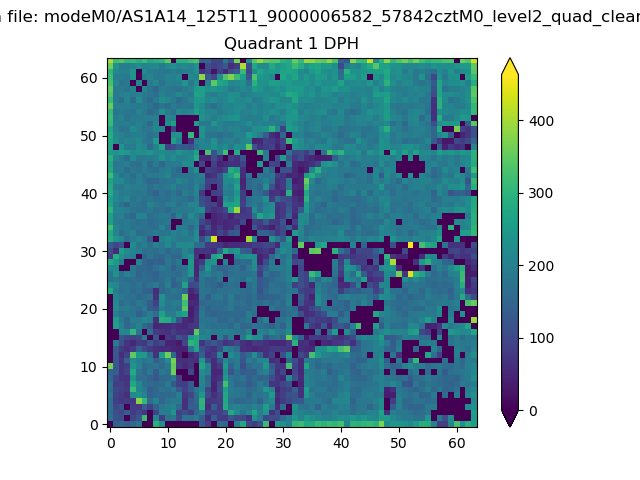 |
Quadrant B |
|---|---|---|---|
| Quadrant D | 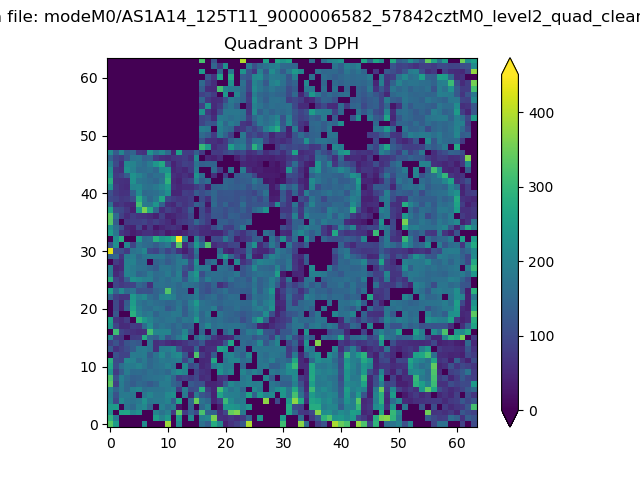 |
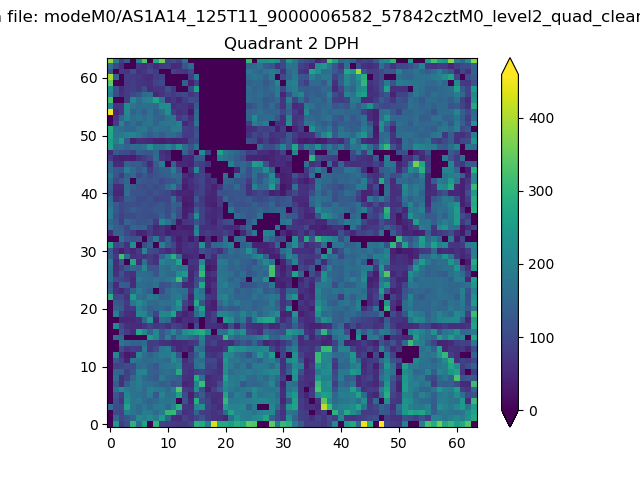 |
Quadrant C |
| Plot type | Count rate plots | Images |
|---|---|---|
| Comparison with Poisson distribution Blue bars denote a histogram of data divided into 1 sec bins. Red curve is a Poisson curve with rate = median count rate of data. |
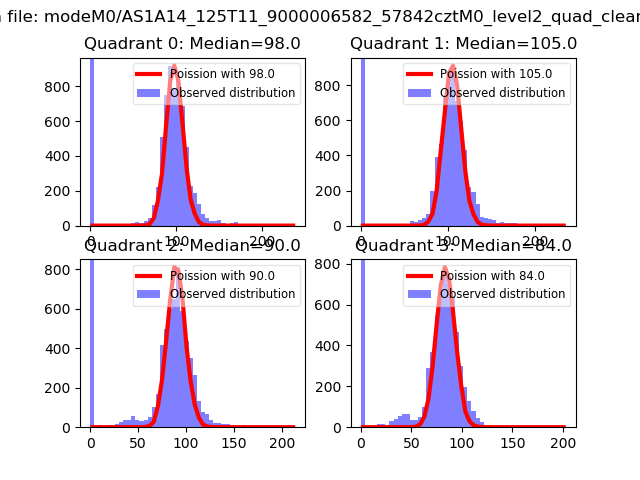 |
 |
| Quadrant-wise count rates Data is divided into 100 sec bins |
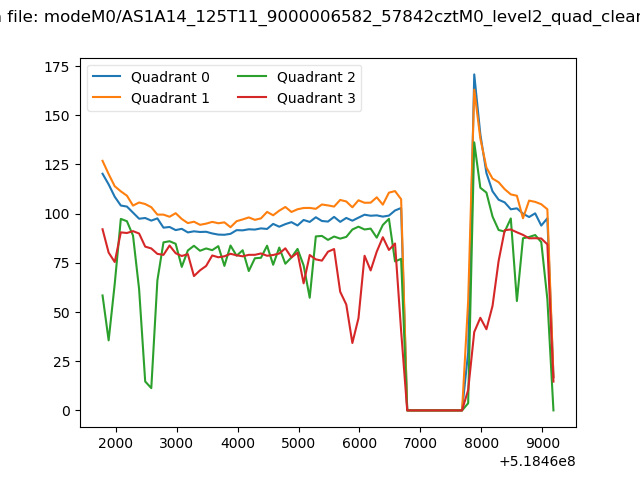 |
|
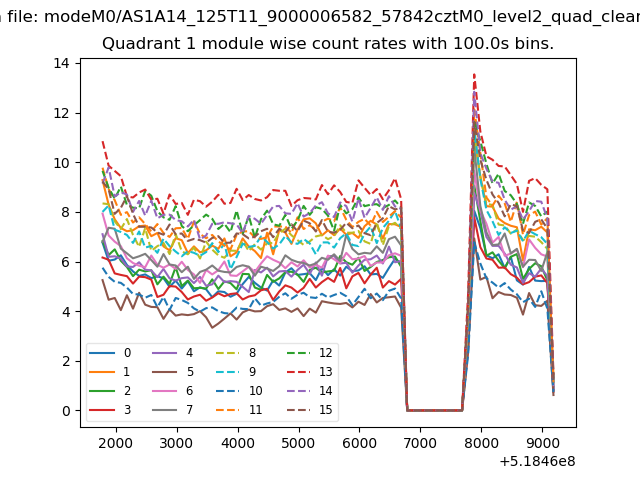
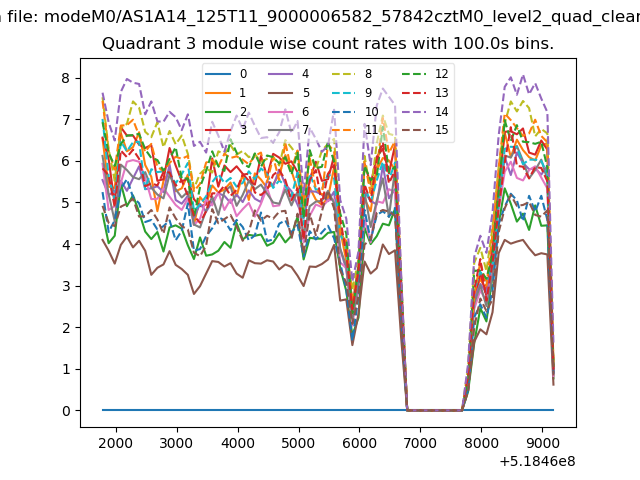
| Module-wise count rates for Quadrant A Data is divided into 100 sec bins |
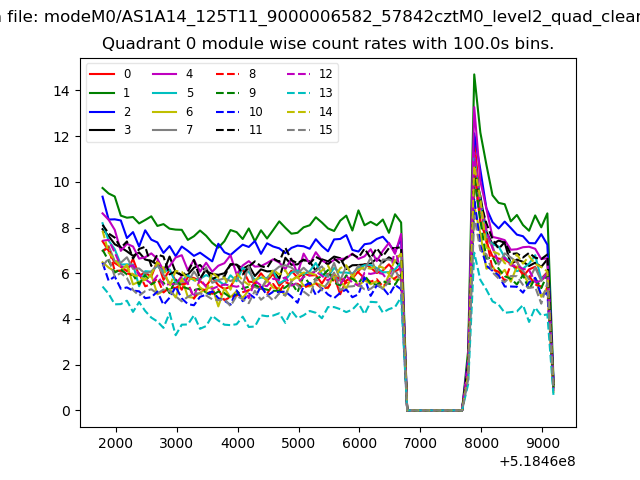 |
 |
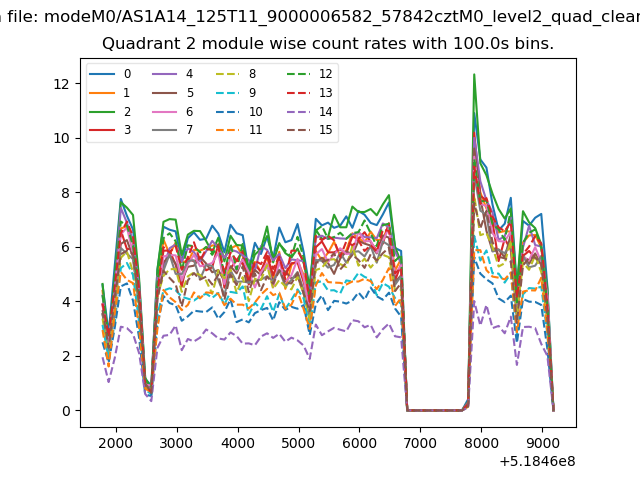
| Module-wise count rates for Quadrant B Data is divided into 100 sec bins |
 |
 |
| Module-wise count rates for Quadrant C Data is divided into 100 sec bins |
 |
 |
| Module-wise count rates for Quadrant D Data is divided into 100 sec bins |
 |
 |
| Parameter | Plot |
|---|---|
| CZT HV Monitor | 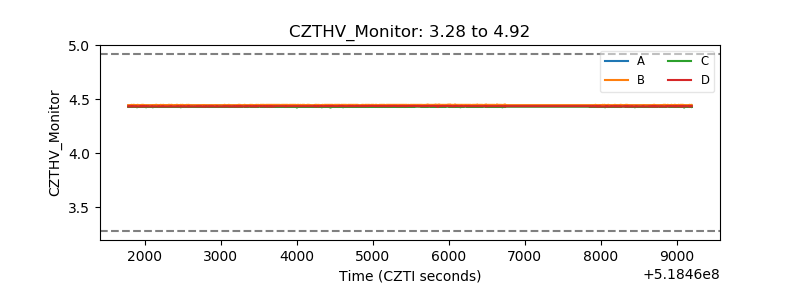 |
| D_VDD | 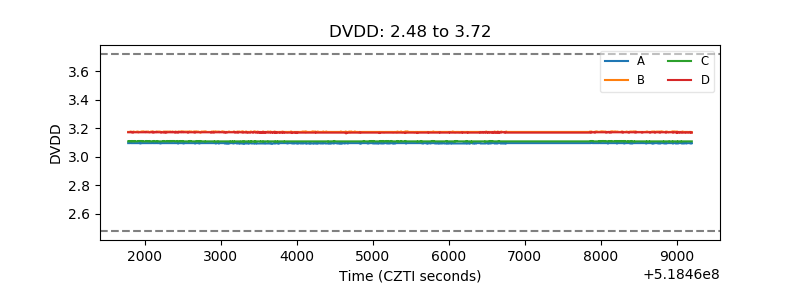 |
| Temperature 1 | 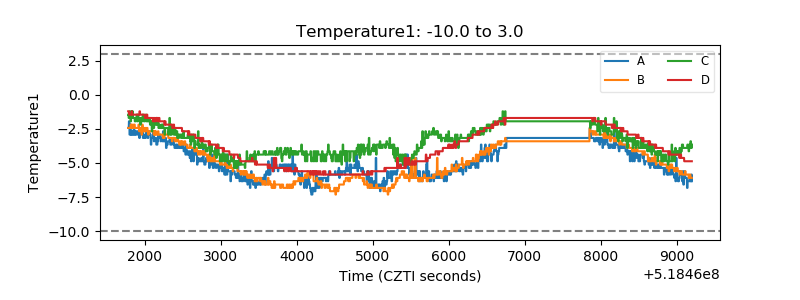 |
| Veto HV Monitor | 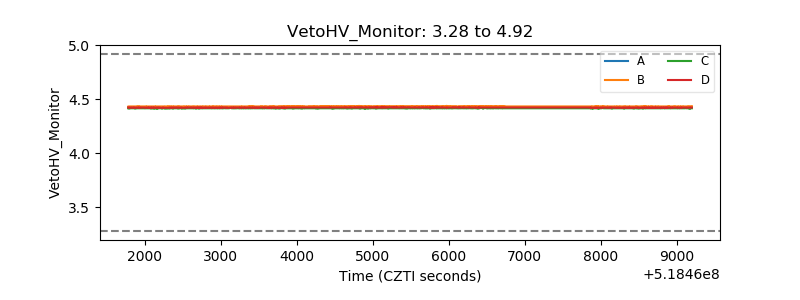 |
| Veto LLD | 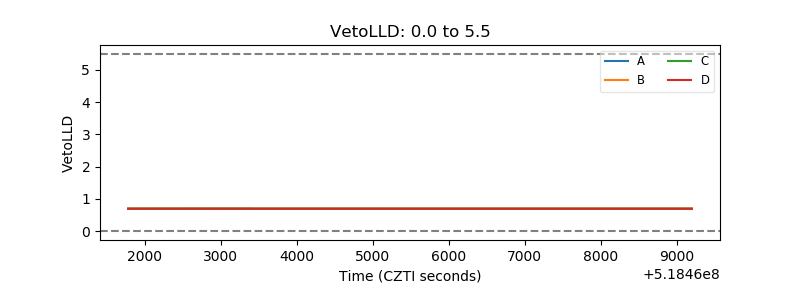 |
| Alpha Counter | 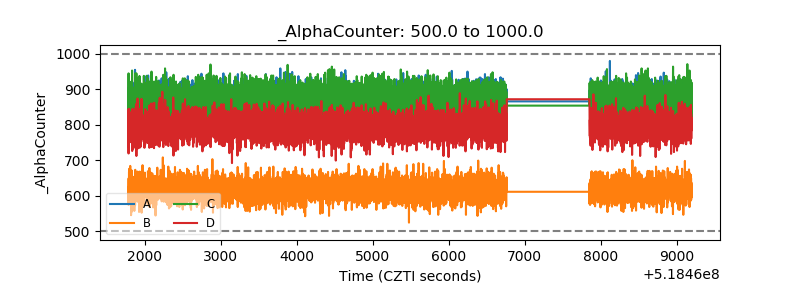 |
| _CPM_Rate | 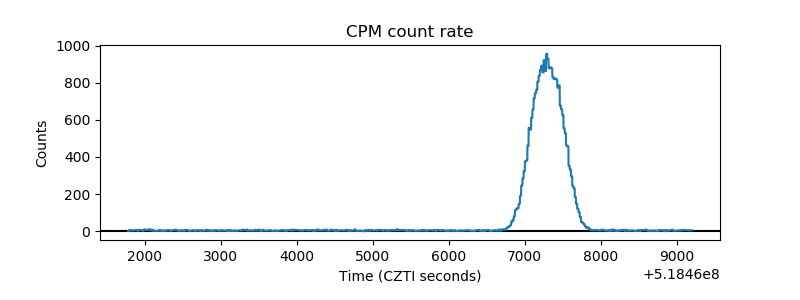 |
| CZT Counter | 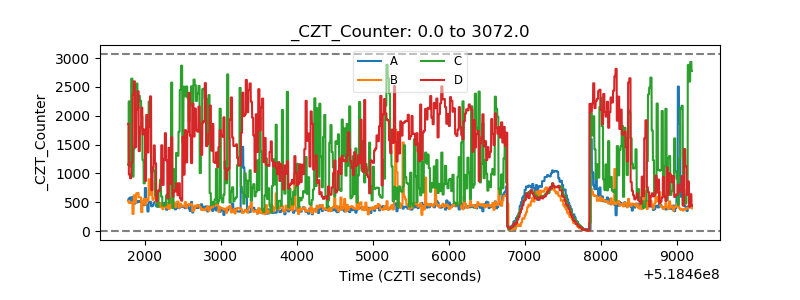 |
| +2.5 Volts monitor | 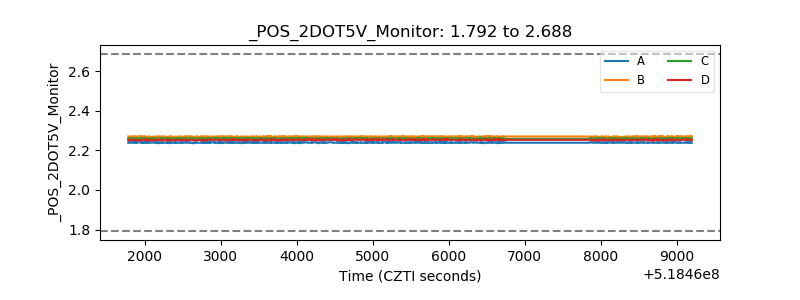 |
| +5 Volts monitor | 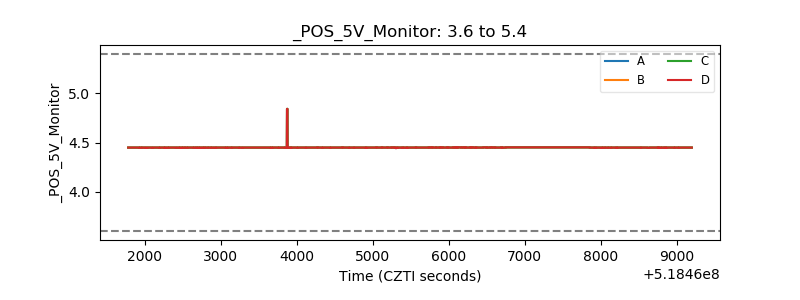 |
| _ROLL_ROT | 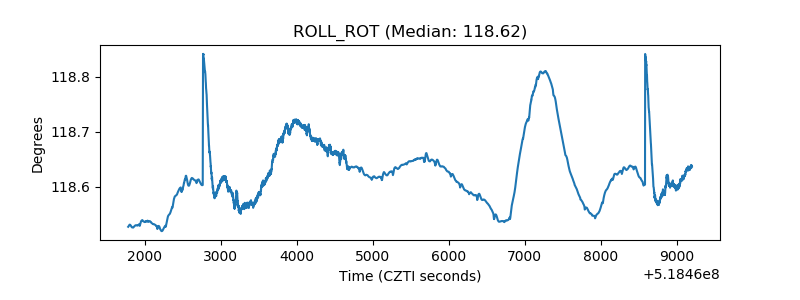 |
| _Roll_DEC | 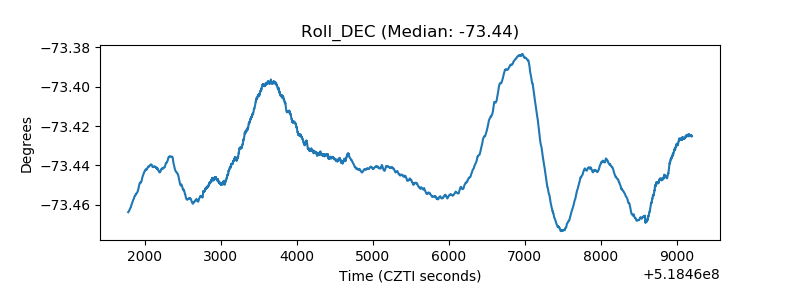 |
| _Roll_RA | 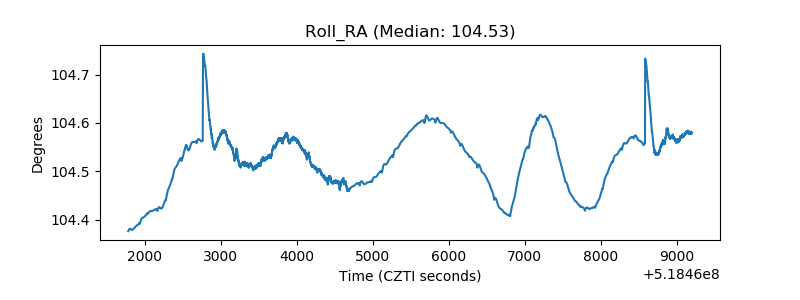 |
| Veto Counter | 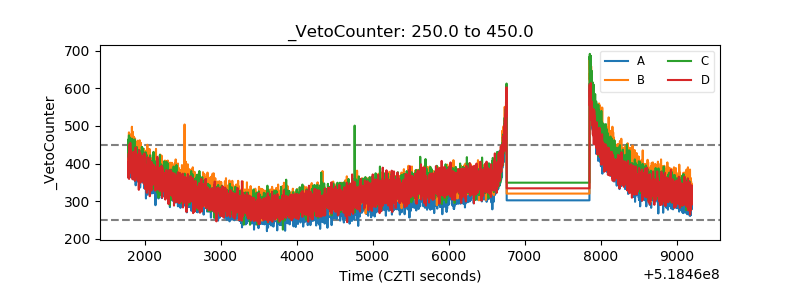 |