| Param | Original file | Final file |
|---|---|---|
| Filename | modeM0/AS1A14_125T11_9000006582_57843cztM0_level2.fits | modeM0/AS1A14_125T11_9000006582_57843cztM0_level2_quad_clean.evt |
| Size (bytes) | 477,224,640 | 91,414,080 |
| Size | 455.1 MB | 87.2 MB |
| Events in quadrant A | 2,784,271 | 630,915 |
| Events in quadrant B | 3,092,339 | 672,768 |
| Events in quadrant C | 7,036,504 | 512,504 |
| Events in quadrant D | 4,270,120 | 519,289 |
| Mode SS | |||
|---|---|---|---|
| Quadrant | BADHDUFLAG | Total packets | Discarded packets |
| A | 0 | 130 | 4 |
| B | 0 | 130 | 8 |
| C | 0 | 130 | 6 |
| D | 0 | 130 | 4 |
| Mode M0 | |||
|---|---|---|---|
| Quadrant | BADHDUFLAG | Total packets | Discarded packets |
| A | 0 | 13573 | 512 |
| B | 0 | 14338 | 566 |
| C | 0 | 26952 | 1814 |
| D | 0 | 18259 | 1235 |
| Mode M9 | |||
|---|---|---|---|
| Quadrant | BADHDUFLAG | Total packets | Discarded packets |
| A | 0 | 17 | 0 |
| B | 0 | 17 | 0 |
| C | 0 | 17 | 0 |
| D | 0 | 18 | 0 |
| Quadrant | Total seconds | Saturated seconds | Saturation percentage |
|---|---|---|---|
| A | 6253 | 38 | 0.607708% |
| B | 6248 | 95 | 1.520487% |
| C | 6112 | 878 | 14.365183% |
| D | 6170 | 334 | 5.413290% |
Noise dominated data is calculated using 1-second bins in cleaned event files. If a bin has >2000 counts, and if more than 50% of those come from <1% of pixels, then it is considered to be noise-dominated and hence unusable.
| Quadrant | # 1 sec bins | Bins with >0 counts | Bins with >2000 counts | High rate bins dominated by noise | Noise dominated (total time) | Noise dominated (detector-on time) | Marked lightcurve |
|---|---|---|---|---|---|---|---|
| A | 7626 | 6458 | 15 | 15 | 0.20% | 0.23% | 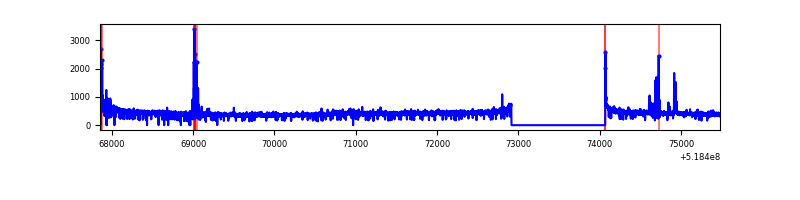 |
| B | 7625 | 6455 | 55 | 55 | 0.72% | 0.85% | 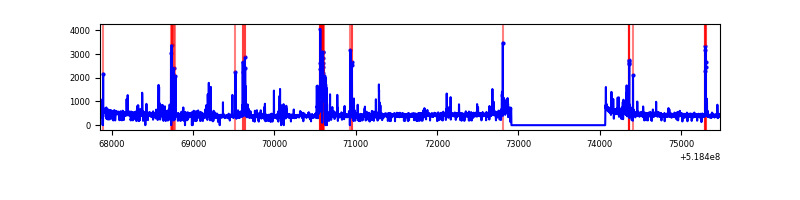 |
| C | 7625 | 6426 | 657 | 657 | 8.62% | 10.22% | 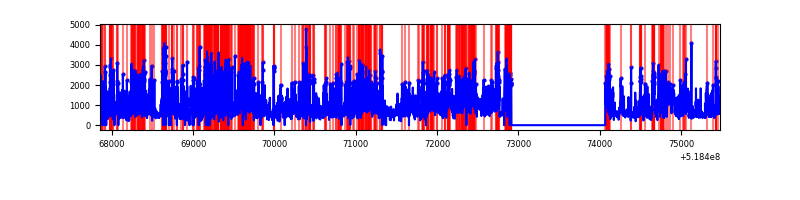 |
| D | 7625 | 6436 | 290 | 290 | 3.80% | 4.51% | 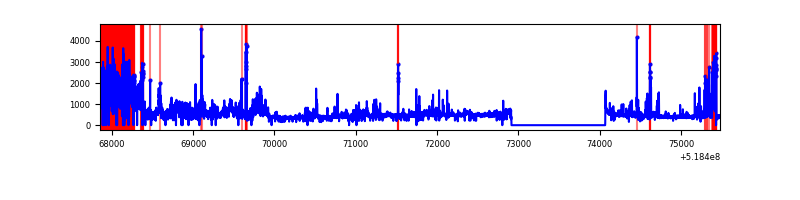 |
Top three noisy pixels from each quadrant. If the there are fewer than three noisy pixels in the level2.evt file, extra rows are filled as -1
| Pixel properties | Quadrant properties | ||||||
|---|---|---|---|---|---|---|---|
| Quadrant | DetID | PixID | Counts | Sigma | Mean | Median | Sigma |
| A | 3 | 245 | 103928 | 618.79 | 674 | 661 | 166.9 |
| A | 3 | 14 | 49805 | 294.48 | 674 | 661 | 166.9 |
| A | 3 | 128 | 9741 | 54.41 | 674 | 661 | 166.9 |
| B | 4 | 142 | 139872 | 990.92 | 664 | 639 | 140.5 |
| B | 5 | 185 | 127965 | 906.18 | 664 | 639 | 140.5 |
| B | 7 | 252 | 34796 | 243.09 | 664 | 639 | 140.5 |
| C | 9 | 38 | 3538503 | 21317.37 | 603 | 596 | 166.0 |
| C | 15 | 224 | 694068 | 4178.46 | 603 | 596 | 166.0 |
| C | 15 | 208 | 151765 | 910.86 | 603 | 596 | 166.0 |
| D | 12 | 110 | 1100392 | 6161.4 | 624 | 595 | 178.5 |
| D | 8 | 160 | 369007 | 2063.96 | 624 | 595 | 178.5 |
| D | 2 | 153 | 161309 | 900.37 | 624 | 595 | 178.5 |
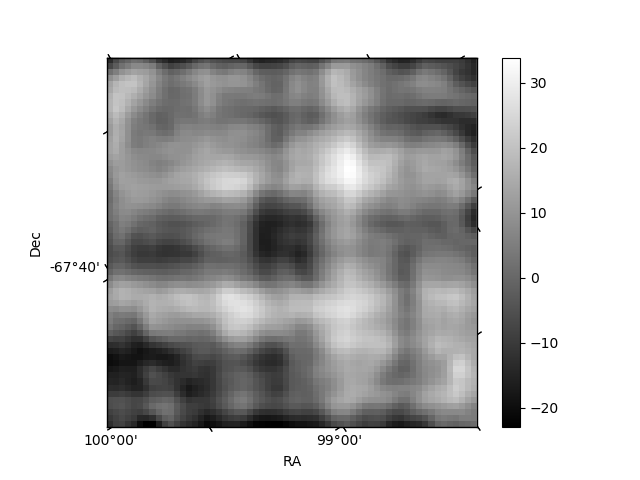
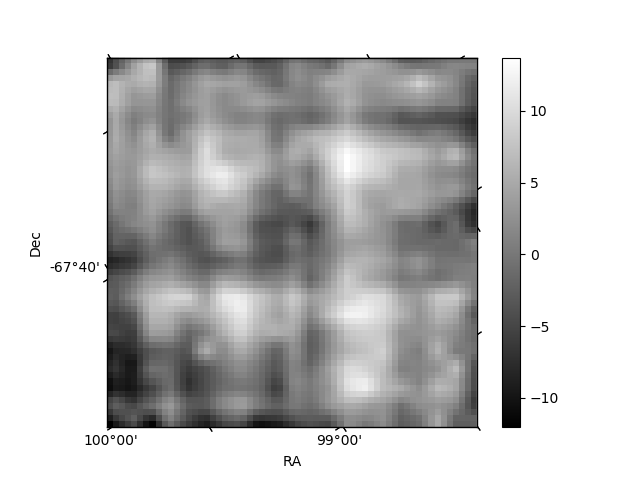
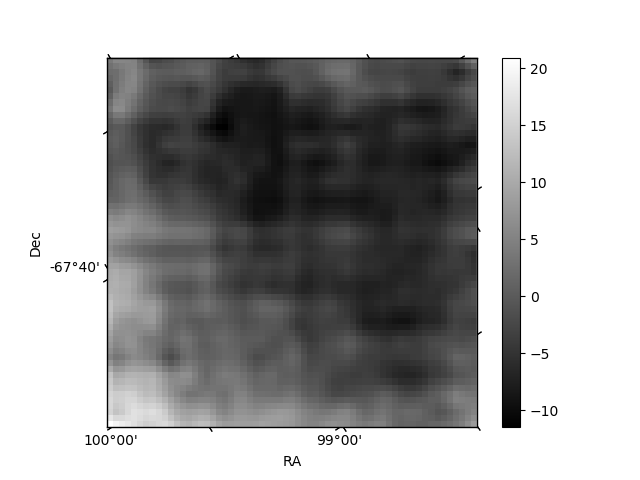
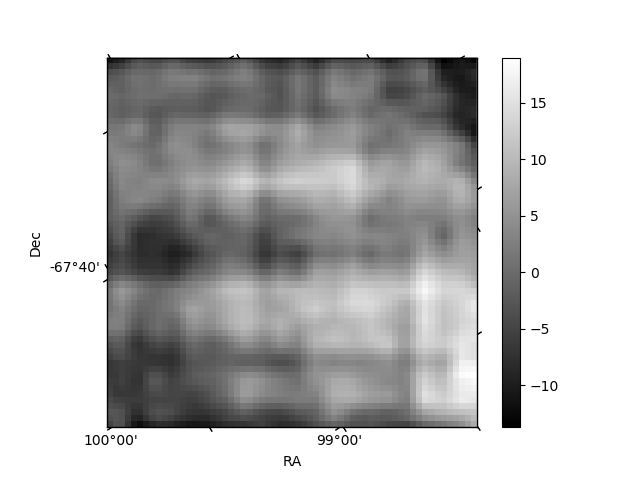
Histogram calculated using DETX and DETY for each event in the final _common_clean file
| Quadrant A | 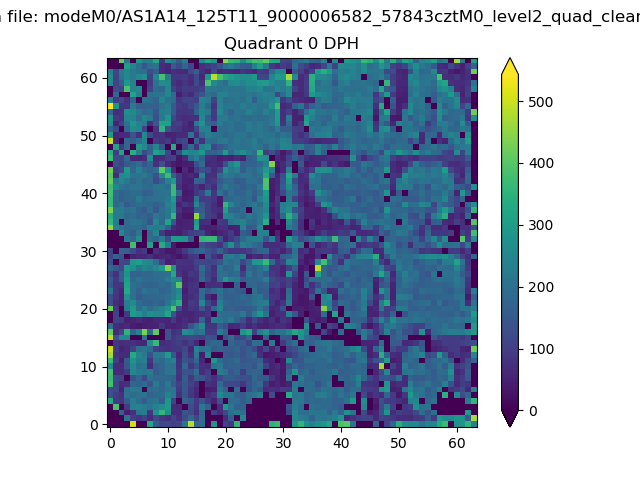 |
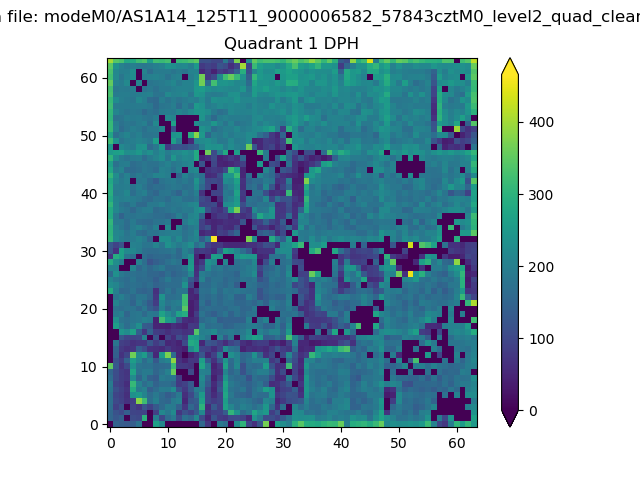 |
Quadrant B |
|---|---|---|---|
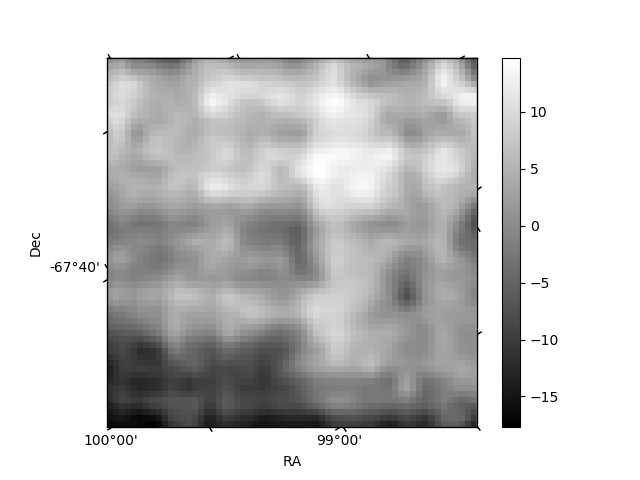
| Quadrant D | 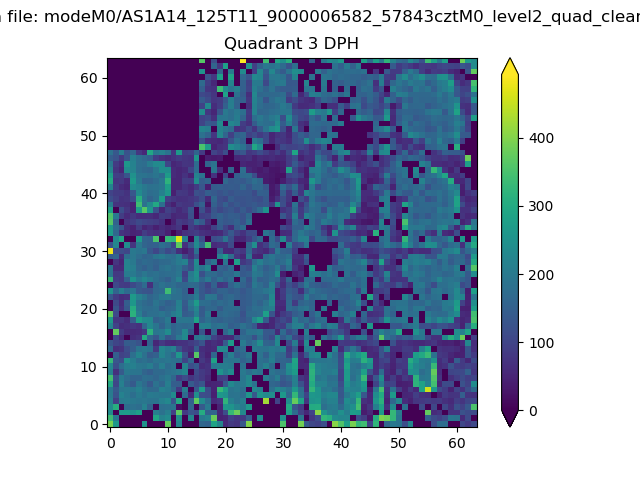 |
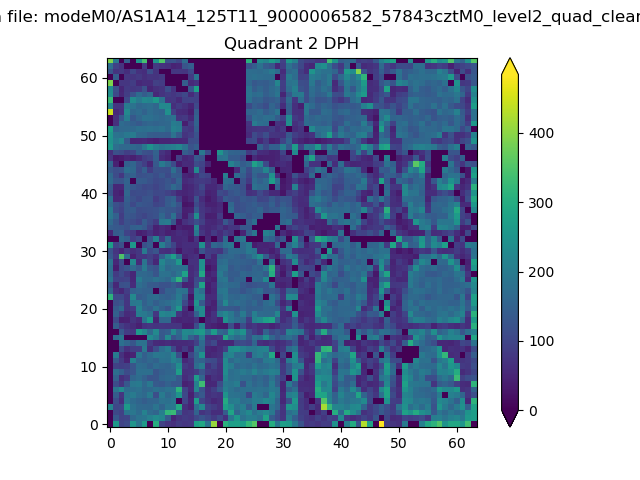 |
Quadrant C |
| Plot type | Count rate plots | Images |
|---|---|---|
| Comparison with Poisson distribution Blue bars denote a histogram of data divided into 1 sec bins. Red curve is a Poisson curve with rate = median count rate of data. |
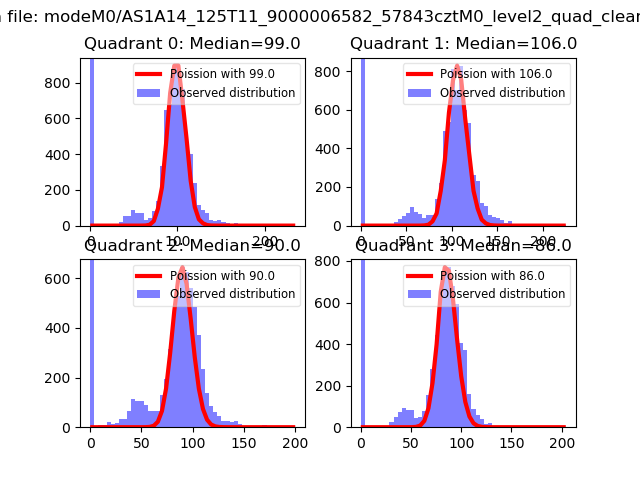 |
 |
| Quadrant-wise count rates Data is divided into 100 sec bins |
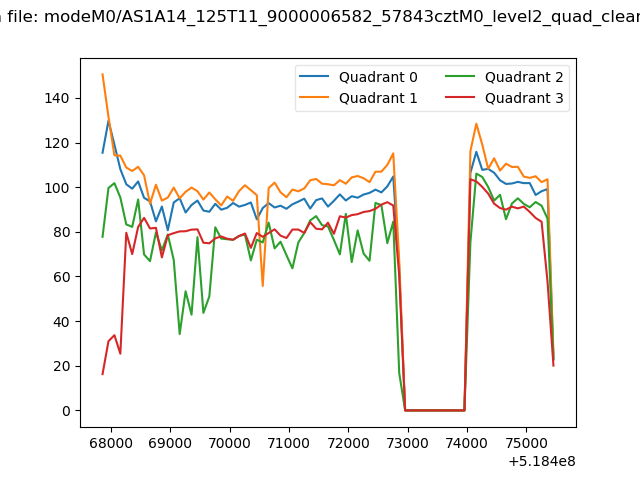 |
|
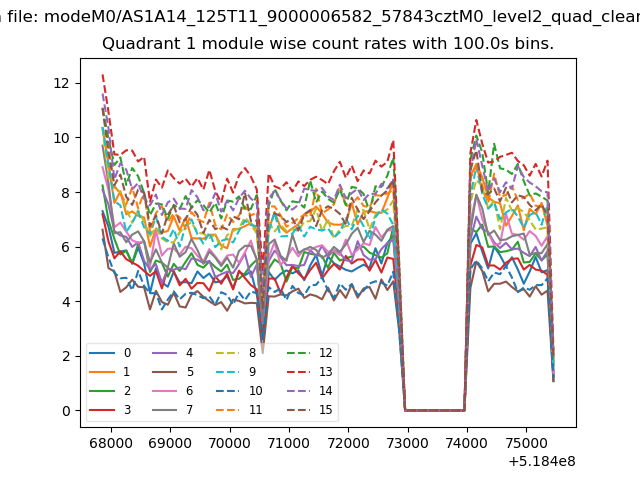
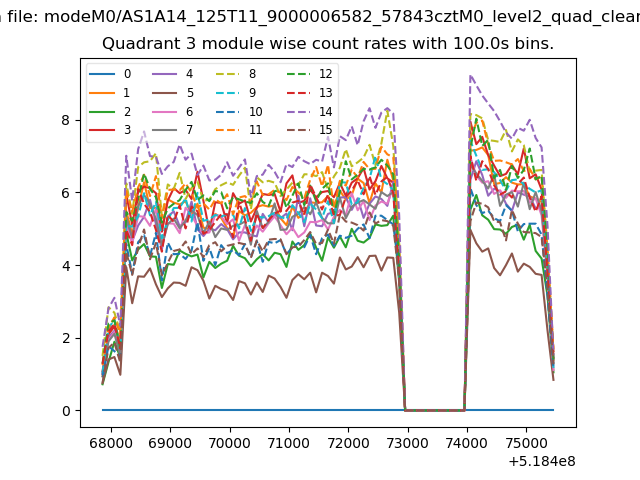
| Module-wise count rates for Quadrant A Data is divided into 100 sec bins |
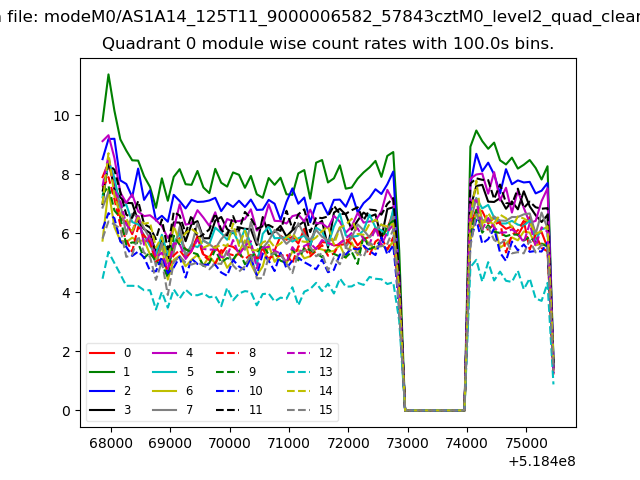 |
 |
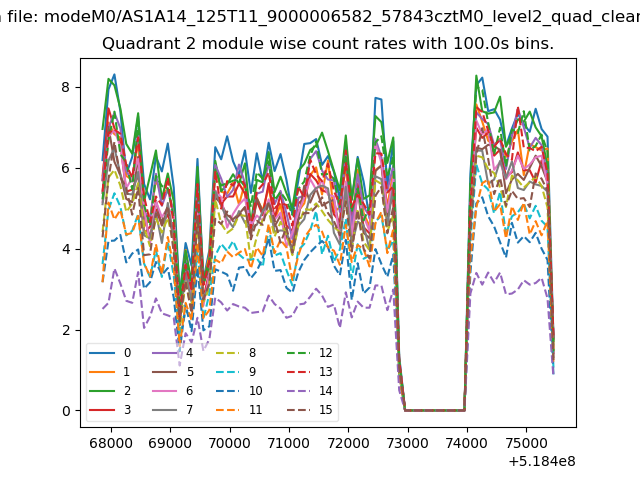
| Module-wise count rates for Quadrant B Data is divided into 100 sec bins |
 |
 |
| Module-wise count rates for Quadrant C Data is divided into 100 sec bins |
 |
 |
| Module-wise count rates for Quadrant D Data is divided into 100 sec bins |
 |
 |
| Parameter | Plot |
|---|---|
| CZT HV Monitor | 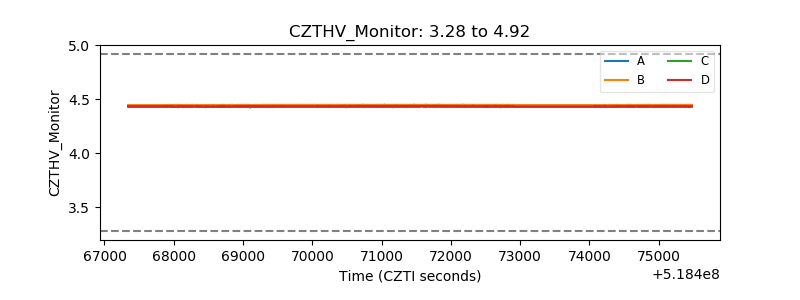 |
| D_VDD | 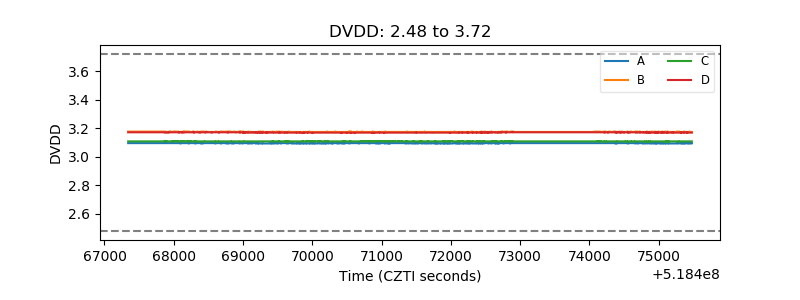 |
| Temperature 1 | 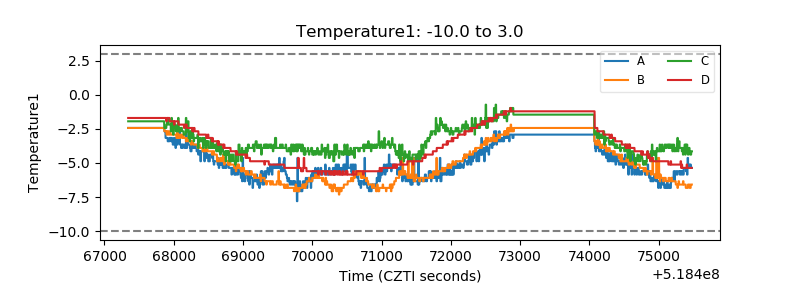 |
| Veto HV Monitor | 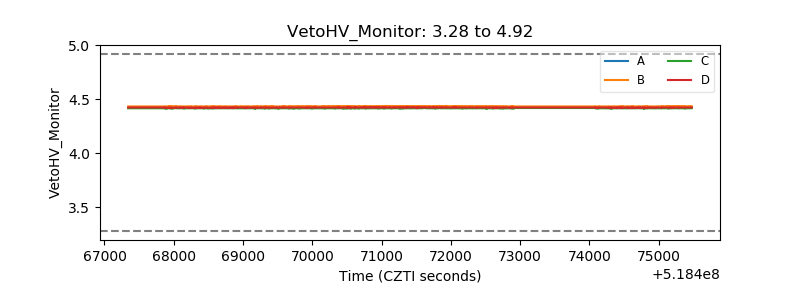 |
| Veto LLD | 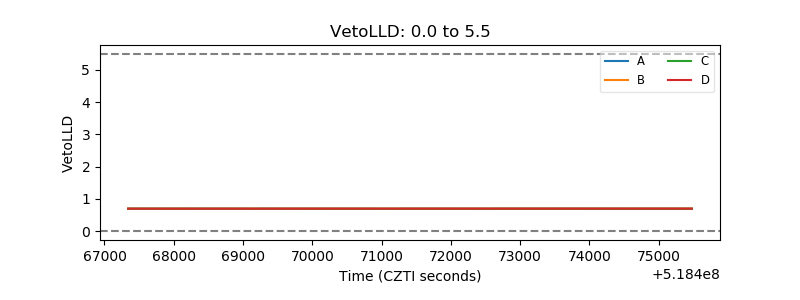 |
| Alpha Counter | 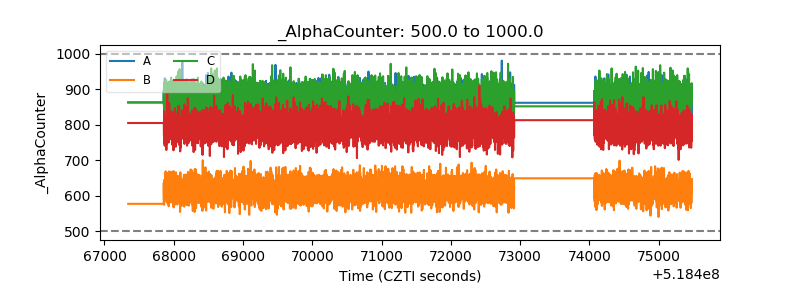 |
| _CPM_Rate | 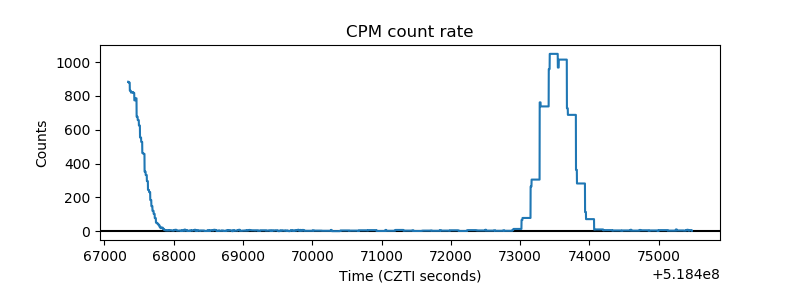 |
| CZT Counter | 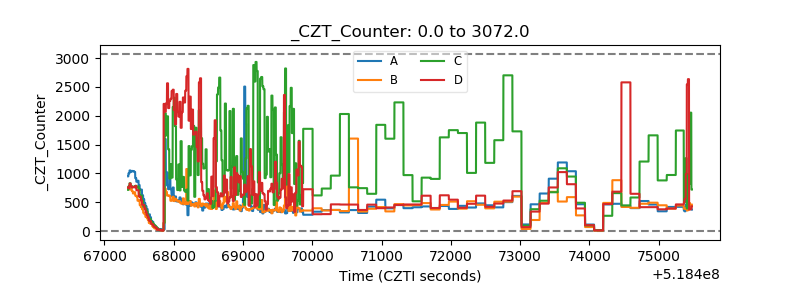 |
| +2.5 Volts monitor | 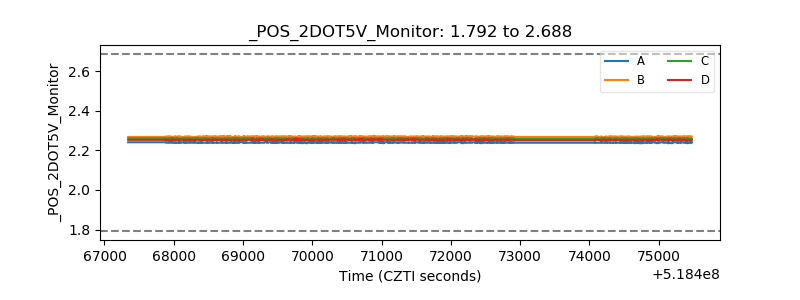 |
| +5 Volts monitor | 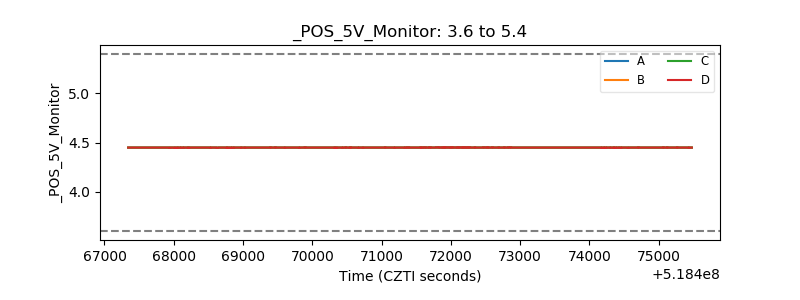 |
| _ROLL_ROT | 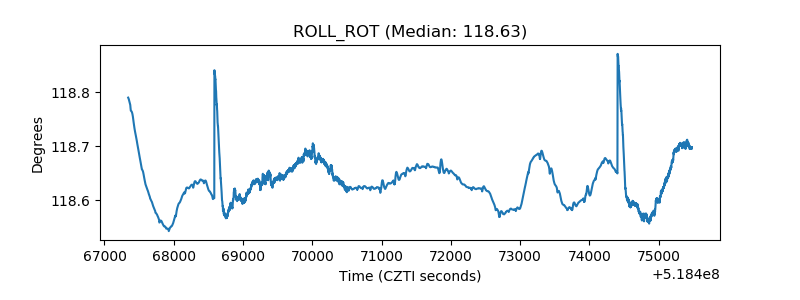 |
| _Roll_DEC | 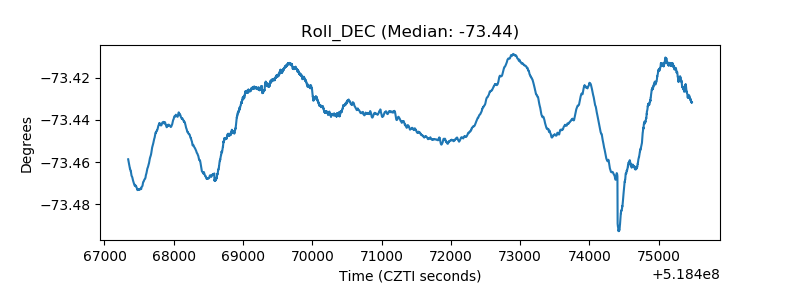 |
| _Roll_RA | 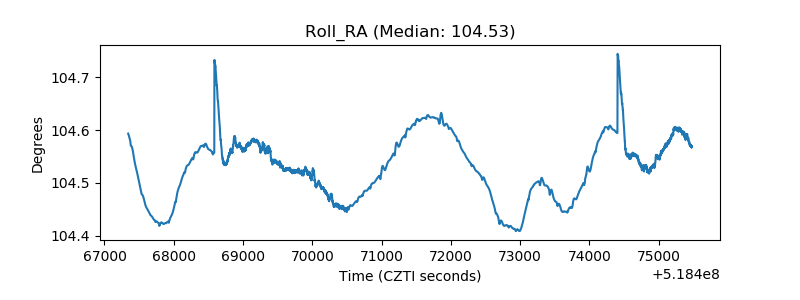 |
| Veto Counter | 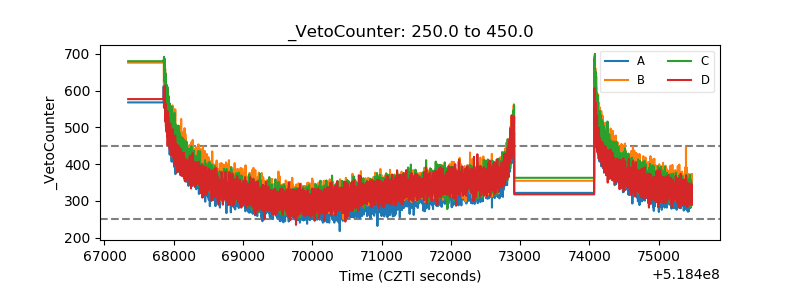 |