| Param | Original file | Final file |
|---|---|---|
| Filename | modeM0/AS1A14_125T11_9000006582_57845cztM0_level2.fits | modeM0/AS1A14_125T11_9000006582_57845cztM0_level2_quad_clean.evt |
| Size (bytes) | 514,877,760 | 84,801,600 |
| Size | 491.0 MB | 80.9 MB |
| Events in quadrant A | 2,673,223 | 576,899 |
| Events in quadrant B | 3,819,526 | 604,037 |
| Events in quadrant C | 8,798,509 | 448,681 |
| Events in quadrant D | 3,276,071 | 496,049 |
| Mode SS | |||
|---|---|---|---|
| Quadrant | BADHDUFLAG | Total packets | Discarded packets |
| A | 0 | 130 | 0 |
| B | 0 | 130 | 0 |
| C | 0 | 130 | 0 |
| D | 0 | 130 | 0 |
| Mode M0 | |||
|---|---|---|---|
| Quadrant | BADHDUFLAG | Total packets | Discarded packets |
| A | 0 | 12915 | 2 |
| B | 0 | 15992 | 2 |
| C | 0 | 30574 | 2 |
| D | 0 | 14239 | 3 |
| Mode M9 | |||
|---|---|---|---|
| Quadrant | BADHDUFLAG | Total packets | Discarded packets |
| A | 0 | 14 | 0 |
| B | 0 | 15 | 0 |
| C | 0 | 15 | 0 |
| D | 0 | 15 | 0 |
| Quadrant | Total seconds | Saturated seconds | Saturation percentage |
|---|---|---|---|
| A | 6327 | 19 | 0.300300% |
| B | 6327 | 370 | 5.847953% |
| C | 6327 | 1580 | 24.972341% |
| D | 6326 | 25 | 0.395194% |
Noise dominated data is calculated using 1-second bins in cleaned event files. If a bin has >2000 counts, and if more than 50% of those come from <1% of pixels, then it is considered to be noise-dominated and hence unusable.
| Quadrant | # 1 sec bins | Bins with >0 counts | Bins with >2000 counts | High rate bins dominated by noise | Noise dominated (total time) | Noise dominated (detector-on time) | Marked lightcurve |
|---|---|---|---|---|---|---|---|
| A | 7766 | 6602 | 2 | 2 | 0.03% | 0.03% | 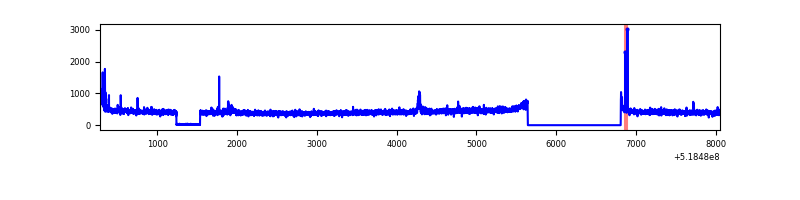 |
| B | 7766 | 6602 | 229 | 229 | 2.95% | 3.47% | 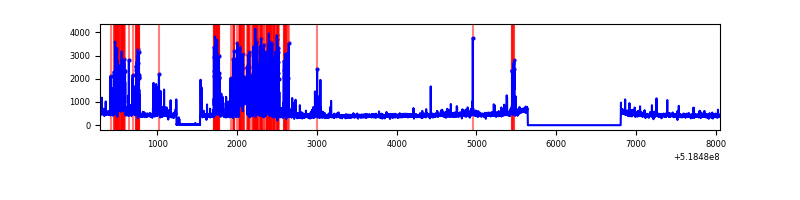 |
| C | 7766 | 6602 | 1313 | 1313 | 16.91% | 19.89% | 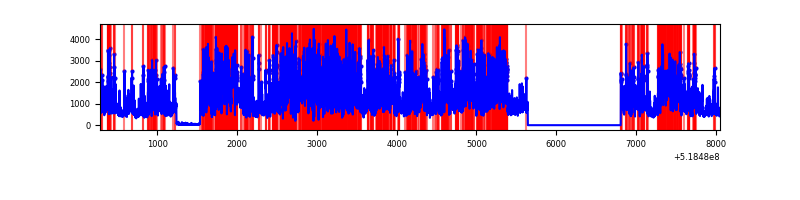 |
| D | 7765 | 6601 | 15 | 15 | 0.19% | 0.23% | 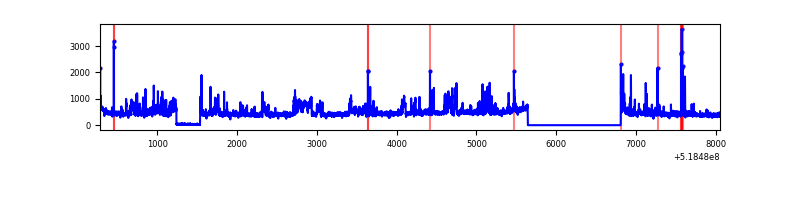 |
Top three noisy pixels from each quadrant. If the there are fewer than three noisy pixels in the level2.evt file, extra rows are filled as -1
| Pixel properties | Quadrant properties | ||||||
|---|---|---|---|---|---|---|---|
| Quadrant | DetID | PixID | Counts | Sigma | Mean | Median | Sigma |
| A | 5 | 168 | 19251 | 112.91 | 673 | 655 | 164.7 |
| A | 3 | 245 | 18389 | 107.68 | 673 | 655 | 164.7 |
| A | 3 | 14 | 13639 | 78.84 | 673 | 655 | 164.7 |
| B | 5 | 185 | 1081396 | 7801.15 | 657 | 632 | 138.5 |
| B | 2 | 249 | 28220 | 199.14 | 657 | 632 | 138.5 |
| B | 10 | 247 | 22230 | 155.9 | 657 | 632 | 138.5 |
| C | 9 | 38 | 5391560 | 33188.2 | 596 | 589 | 162.4 |
| C | 15 | 224 | 827730 | 5092.09 | 596 | 589 | 162.4 |
| C | 12 | 252 | 117642 | 720.61 | 596 | 589 | 162.4 |
| D | 12 | 110 | 464149 | 2568.53 | 647 | 619 | 180.5 |
| D | 8 | 160 | 56863 | 311.66 | 647 | 619 | 180.5 |
| D | 5 | 173 | 41455 | 226.28 | 647 | 619 | 180.5 |
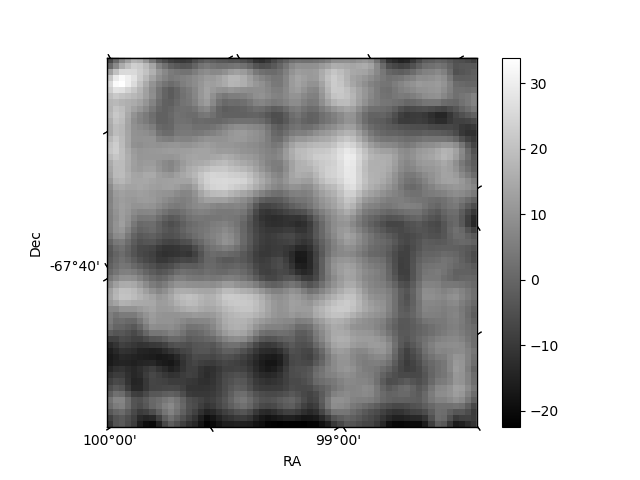
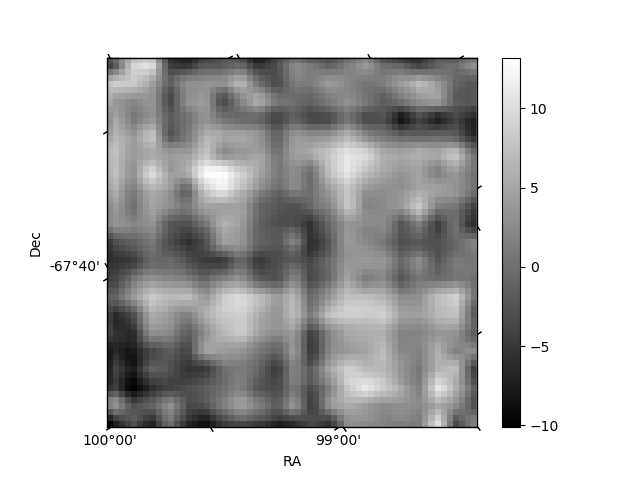
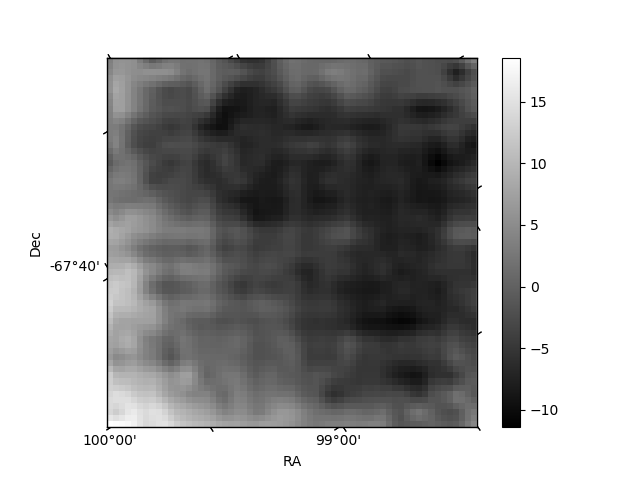
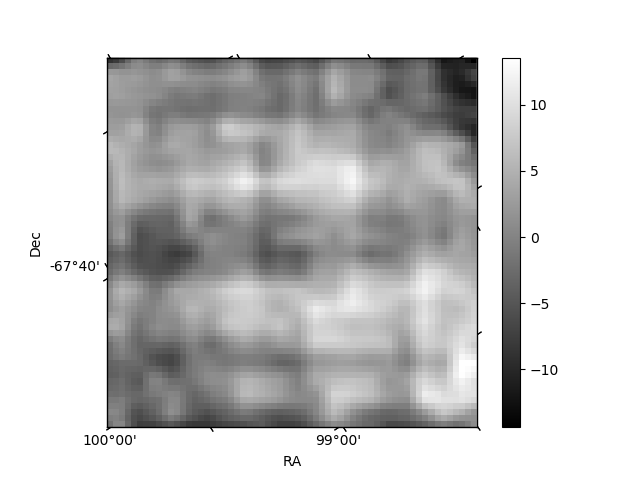
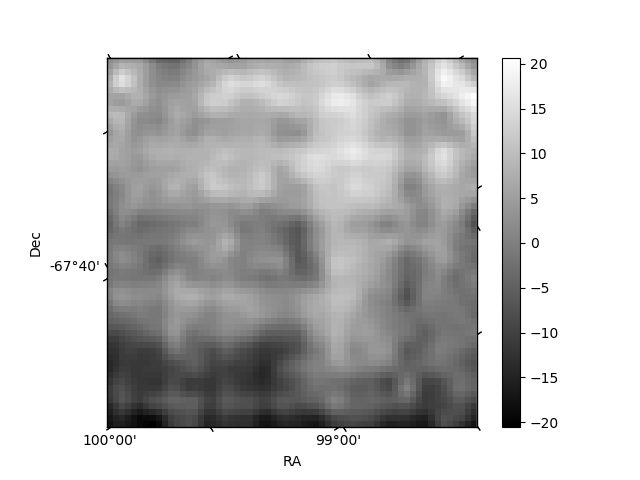
Histogram calculated using DETX and DETY for each event in the final _common_clean file
| Quadrant A | 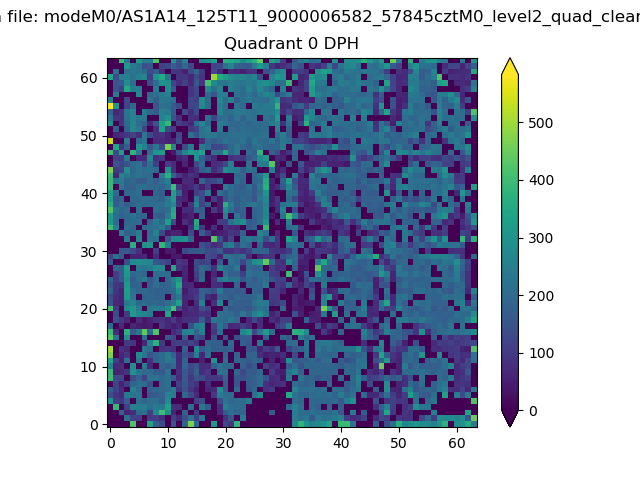 |
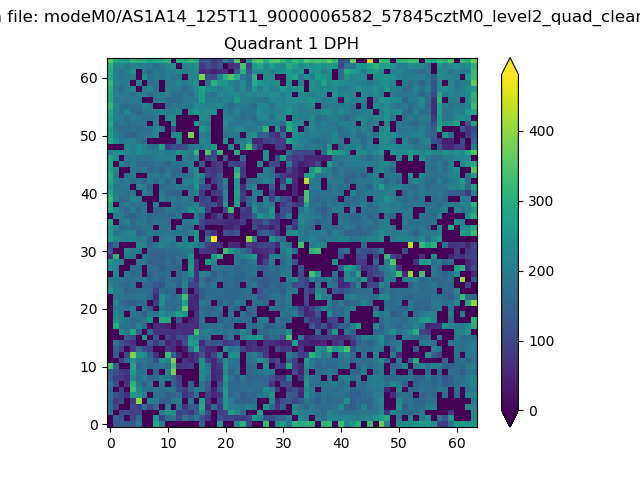 |
Quadrant B |
|---|---|---|---|
| Quadrant D | 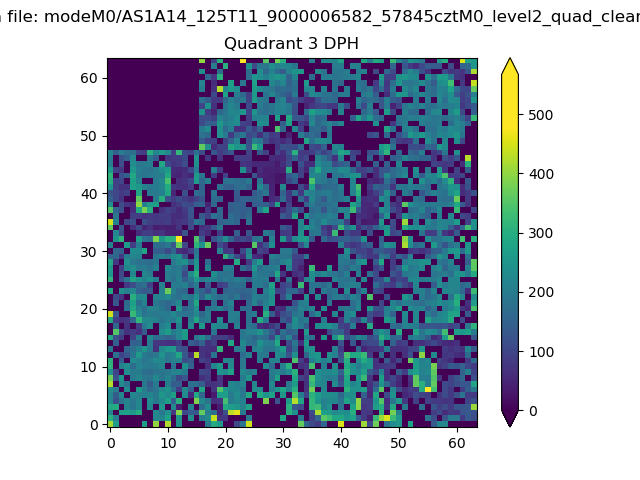 |
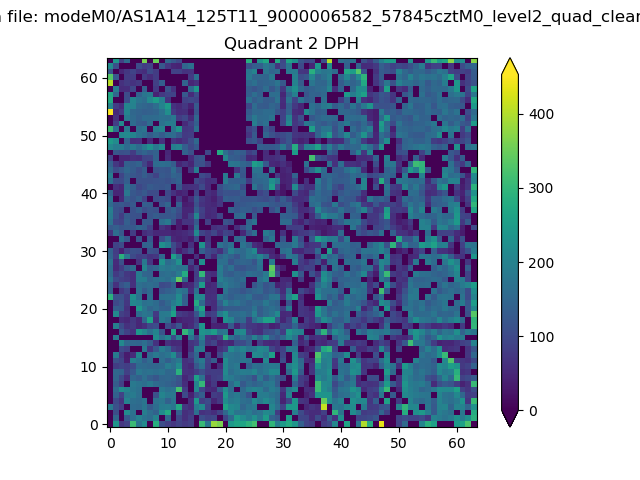 |
Quadrant C |
| Plot type | Count rate plots | Images |
|---|---|---|
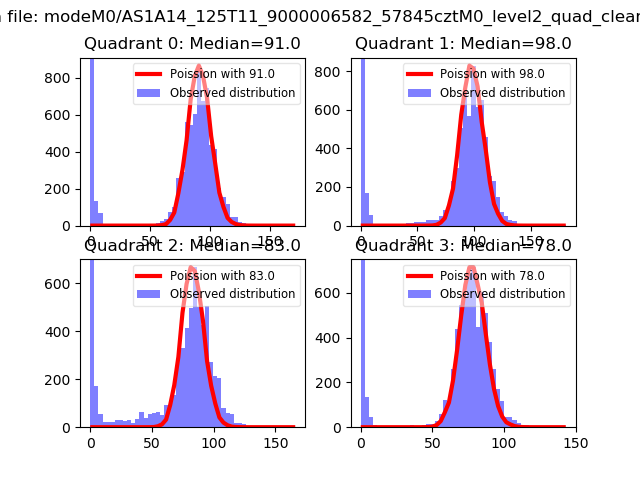
| Comparison with Poisson distribution Blue bars denote a histogram of data divided into 1 sec bins. Red curve is a Poisson curve with rate = median count rate of data. |
 |
 |
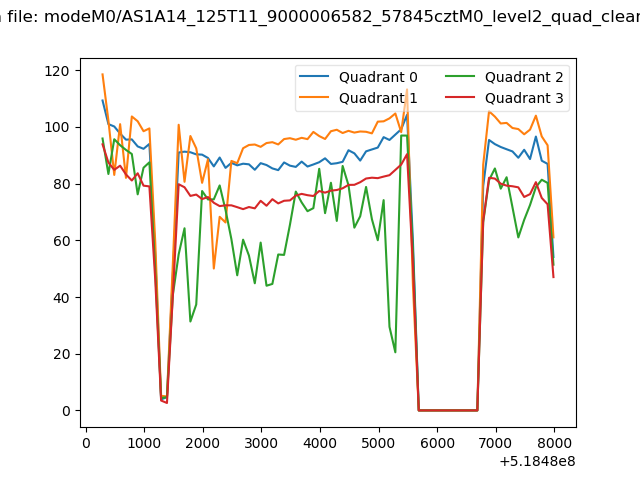
| Quadrant-wise count rates Data is divided into 100 sec bins |
 |
|
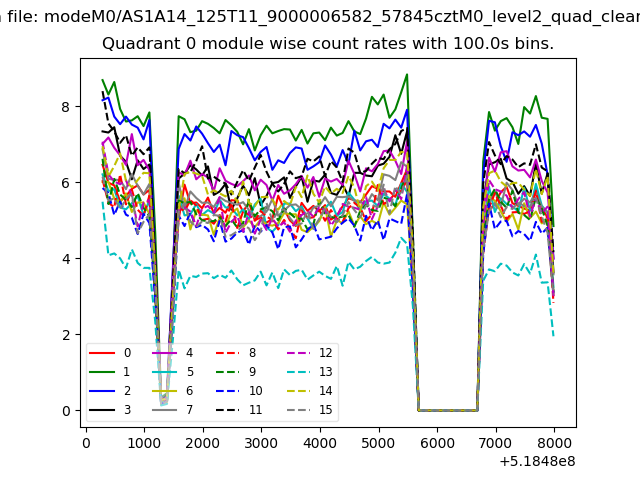
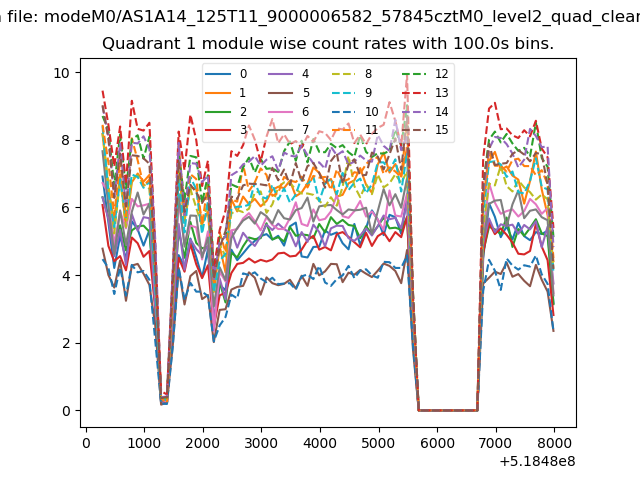
| Module-wise count rates for Quadrant A Data is divided into 100 sec bins |
 |
 |
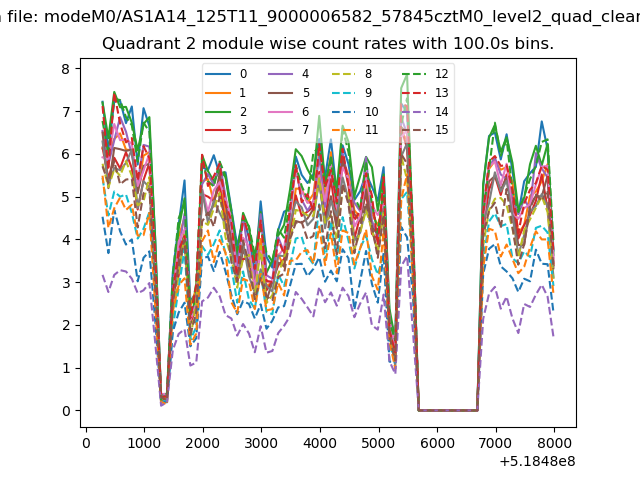
| Module-wise count rates for Quadrant B Data is divided into 100 sec bins |
 |
 |
| Module-wise count rates for Quadrant C Data is divided into 100 sec bins |
 |
 |
| Module-wise count rates for Quadrant D Data is divided into 100 sec bins |
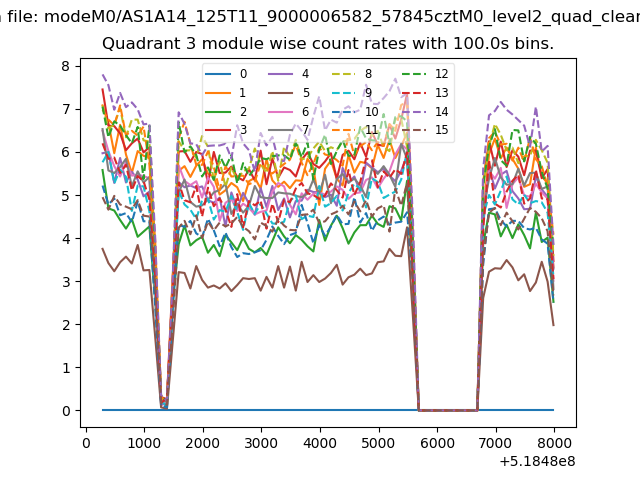 |
 |
| Parameter | Plot |
|---|---|
| CZT HV Monitor | 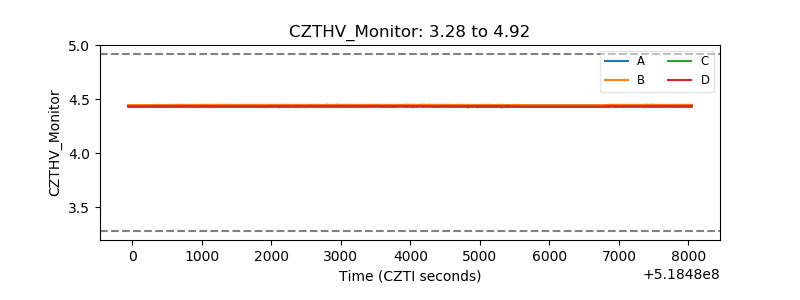 |
| D_VDD | 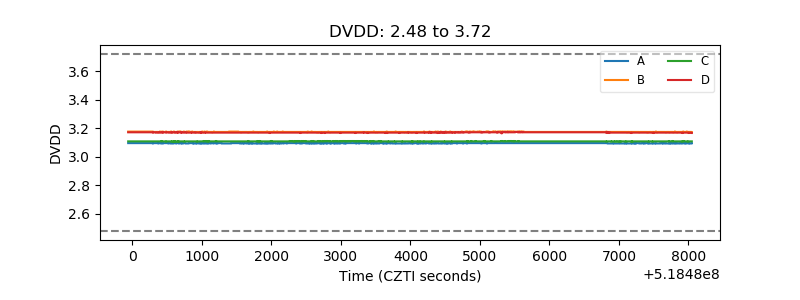 |
| Temperature 1 | 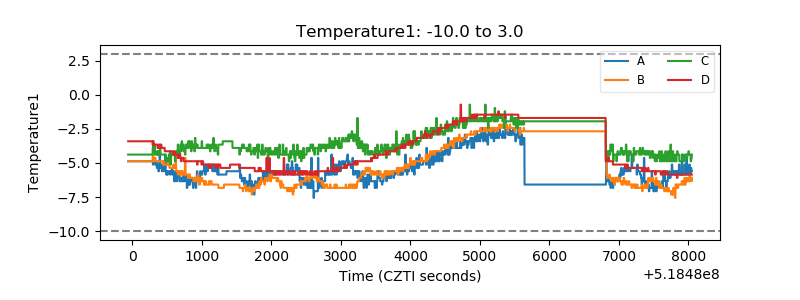 |
| Veto HV Monitor | 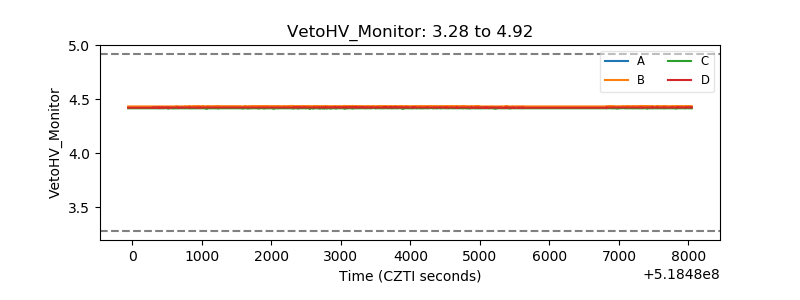 |
| Veto LLD | 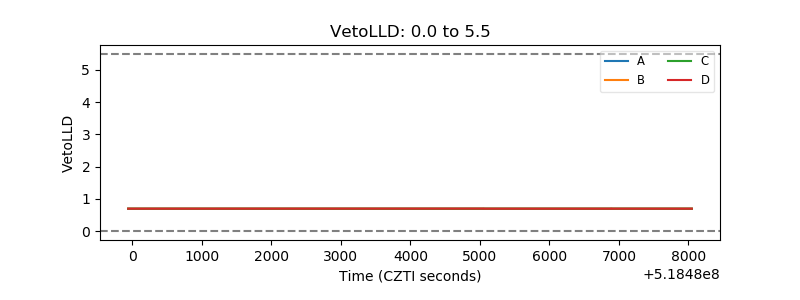 |
| Alpha Counter | 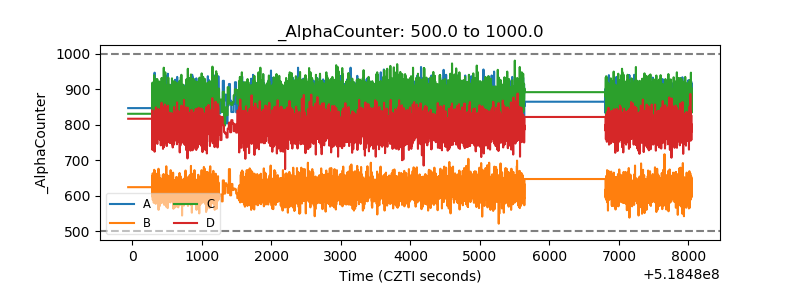 |
| _CPM_Rate | 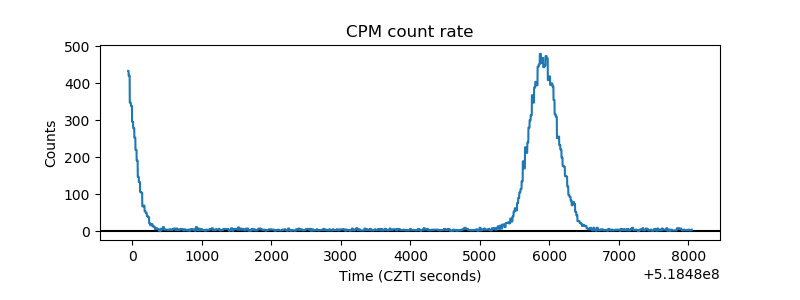 |
| CZT Counter | 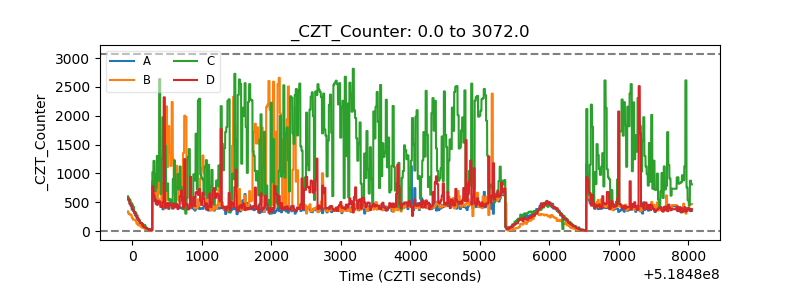 |
| +2.5 Volts monitor |  |
| +5 Volts monitor | 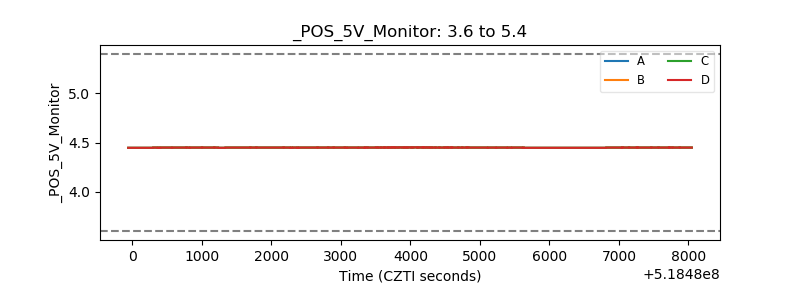 |
| _ROLL_ROT | 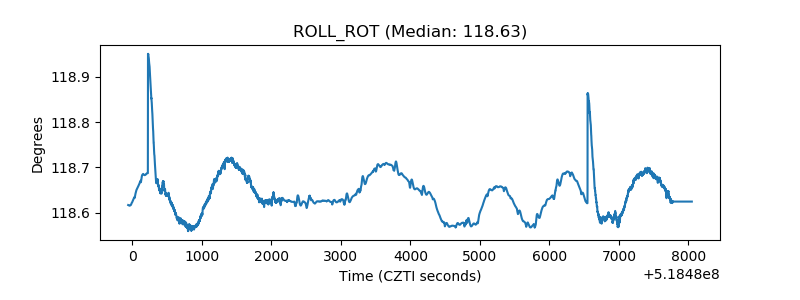 |
| _Roll_DEC | 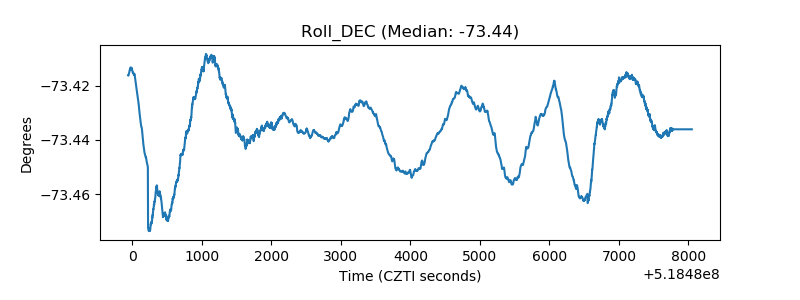 |
| _Roll_RA | 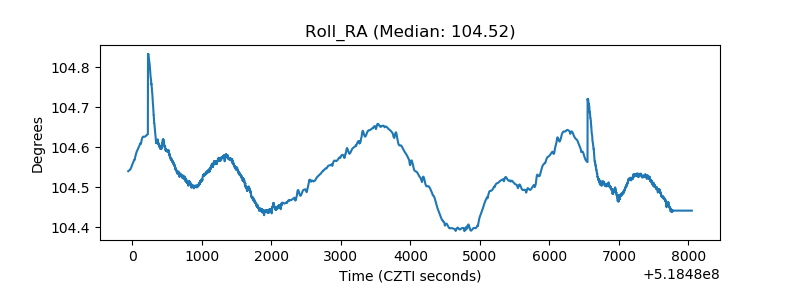 |
| Veto Counter | 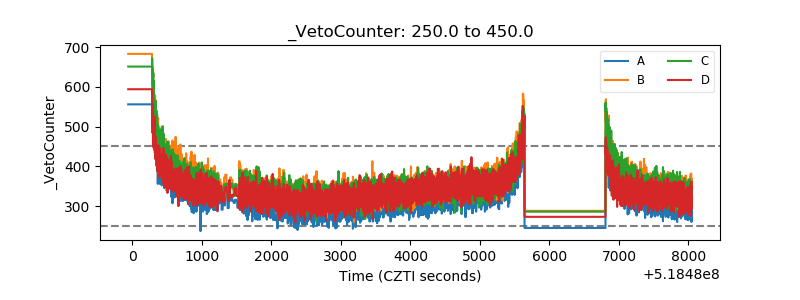 |