| Param | Original file | Final file |
|---|---|---|
| Filename | modeM0/AS1T01_072T02_9000000336_02134cztM0_level2.evt | modeM0/AS1T01_072T02_9000000336_02134cztM0_level2_quad_clean.evt |
| Size (bytes) | 158,546,880 | 17,141,760 |
| Size | 151.2 MB | 16.3 MB |
| Events in quadrant A | 1,045,835 | 87,399 |
| Events in quadrant B | 1,084,001 | 90,414 |
| Events in quadrant C | 1,081,106 | 89,567 |
| Events in quadrant D | 1,425,013 | 78,296 |
| Mode M0 | |||
|---|---|---|---|
| Quadrant | BADHDUFLAG | Total packets | Discarded packets |
| A | 0 | 4922 | 1 |
| B | 0 | 4935 | 1 |
| C | 0 | 4982 | 1 |
| D | 0 | 6174 | 19 |
| Mode SS | |||
|---|---|---|---|
| Quadrant | BADHDUFLAG | Total packets | Discarded packets |
| A | 0 | 48 | 0 |
| B | 0 | 48 | 0 |
| C | 0 | 48 | 0 |
| D | 0 | 48 | 0 |
| Mode M9 | |||
|---|---|---|---|
| Quadrant | BADHDUFLAG | Total packets | Discarded packets |
| A | 0 | 1 | 0 |
| B | 1 | 1 | 0 |
| C | 1 | -1 | -1 |
| D | 1 | -1 | -1 |
| Quadrant | Total seconds | Saturated seconds | Saturation percentage |
|---|---|---|---|
| A | 2398 | 71 | 2.960801% |
| B | 2398 | 55 | 2.293578% |
| C | 2398 | 36 | 1.501251% |
| D | 2396 | 183 | 7.637730% |
Noise dominated data is calculated using 1-second bins in cleaned event files. If a bin has >2000 counts, and if more than 50% of those come from <1% of pixels, then it is considered to be noise-dominated and hence unusable.
| Quadrant | # 1 sec bins | Bins with >0 counts | Bins with >2000 counts | High rate bins dominated by noise | Noise dominated (total time) | Noise dominated (detector-on time) | Marked lightcurve |
|---|---|---|---|---|---|---|---|
| A | 2793 | 2399 | 0 | 0 | 0.00% | 0.00% | 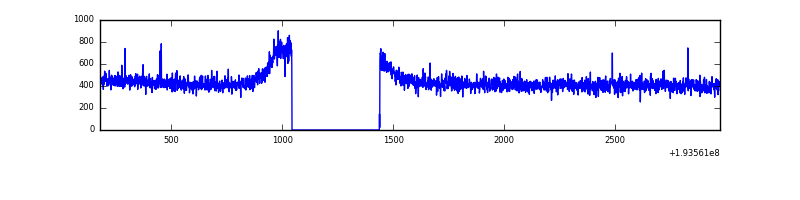 |
| B | 2793 | 2399 | 0 | 0 | 0.00% | 0.00% | 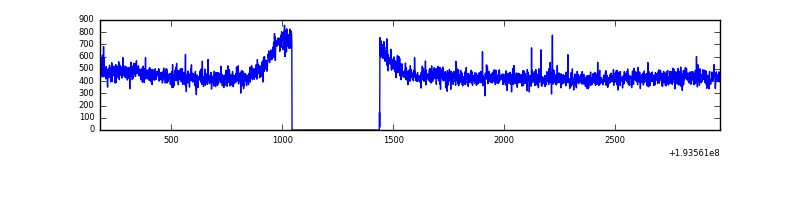 |
| C | 2793 | 2399 | 0 | 0 | 0.00% | 0.00% | 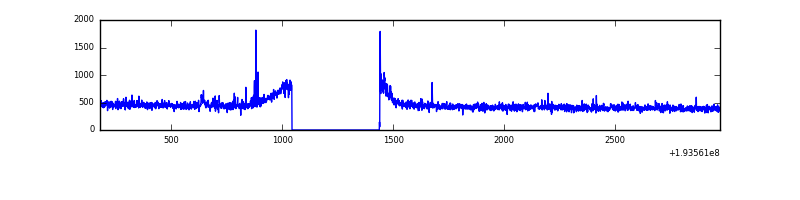 |
| D | 2793 | 2398 | 157 | 157 | 5.62% | 6.55% | 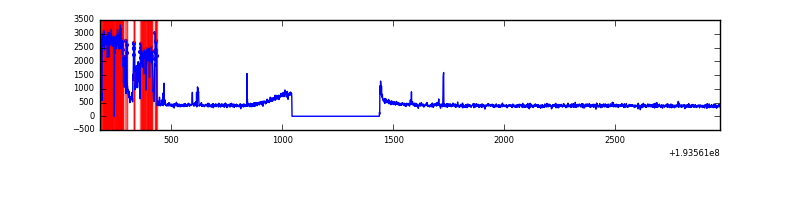 |
Top three noisy pixels from each quadrant. If the there are fewer than three noisy pixels in the level2.evt file, extra rows are filled as -1
| Pixel properties | Quadrant properties | ||||||
|---|---|---|---|---|---|---|---|
| Quadrant | DetID | PixID | Counts | Sigma | Mean | Median | Sigma |
| A | 13 | 9 | 937 | 11.92 | 272 | 266 | 56.3 |
| A | 15 | 171 | 683 | 7.41 | 272 | 266 | 56.3 |
| A | 0 | 1 | 674 | 7.25 | 272 | 266 | 56.3 |
| B | 0 | 198 | 8442 | 150.52 | 281 | 274 | 54.3 |
| B | 5 | 189 | 2801 | 46.57 | 281 | 274 | 54.3 |
| B | 0 | 234 | 1645 | 25.27 | 281 | 274 | 54.3 |
| C | 10 | 82 | 9051 | 143.91 | 268 | 269 | 61.0 |
| C | 9 | 191 | 6181 | 96.88 | 268 | 269 | 61.0 |
| C | 9 | 236 | 5157 | 80.1 | 268 | 269 | 61.0 |
| D | 2 | 31 | 309748 | 5192.19 | 253 | 247 | 59.6 |
| D | 10 | 215 | 141656 | 2372.28 | 253 | 247 | 59.6 |
| D | 2 | 14 | 6781 | 109.61 | 253 | 247 | 59.6 |
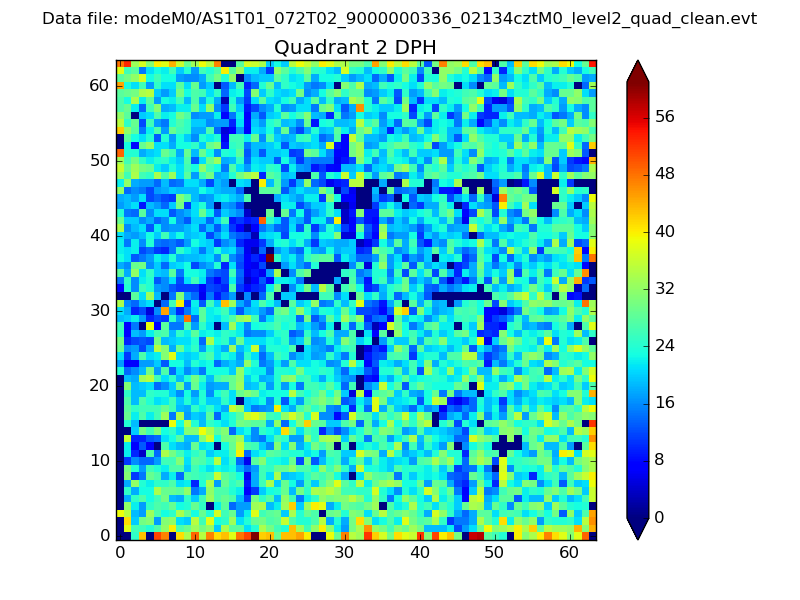
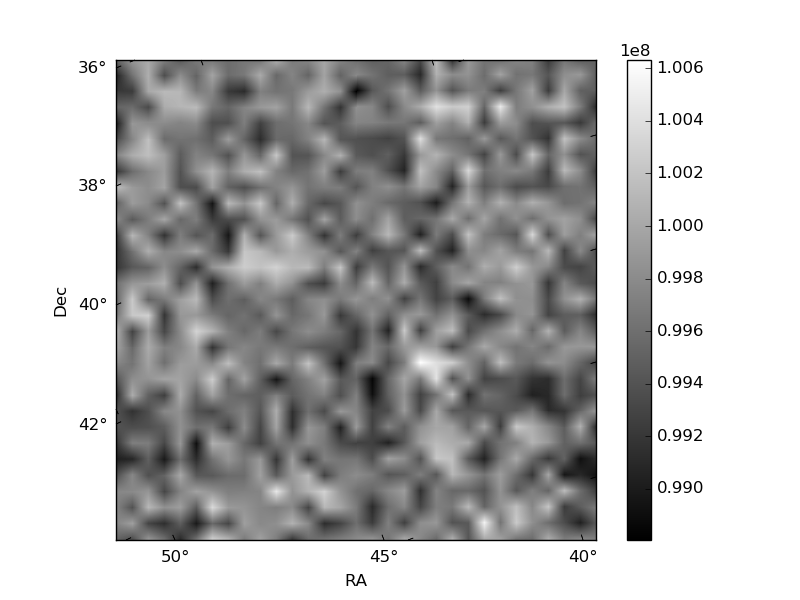
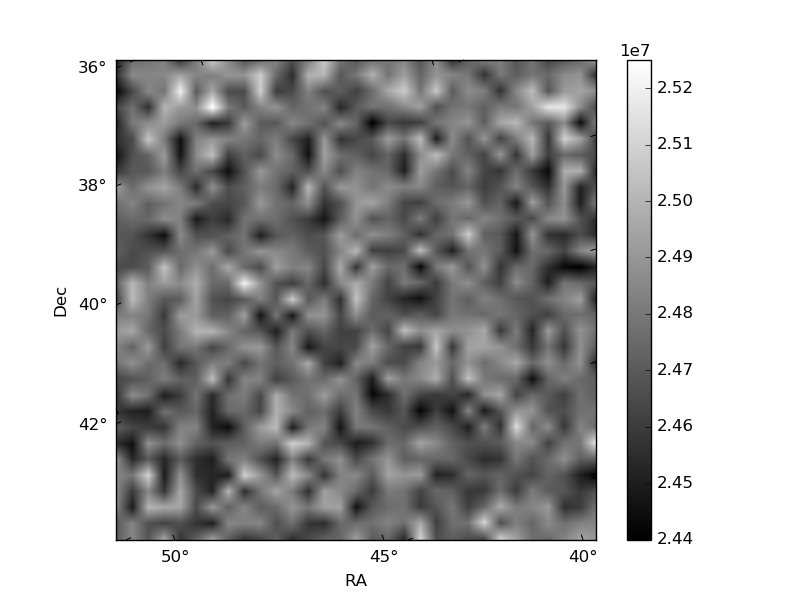
Histogram calculated using DETX and DETY for each event in the final _common_clean file
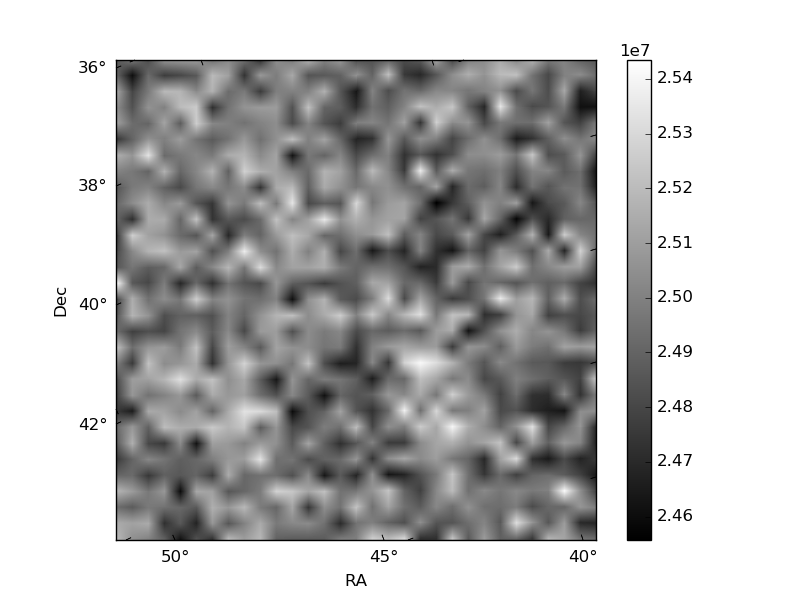
| Quadrant A | 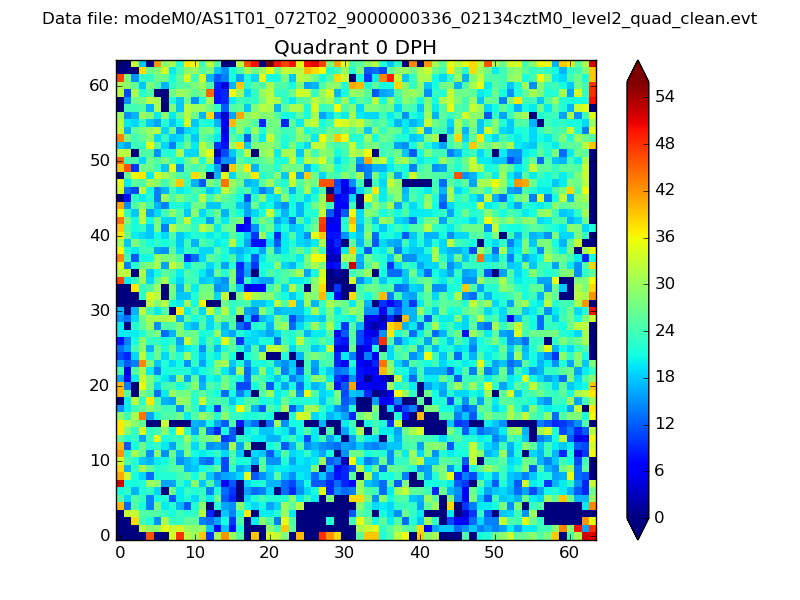 |
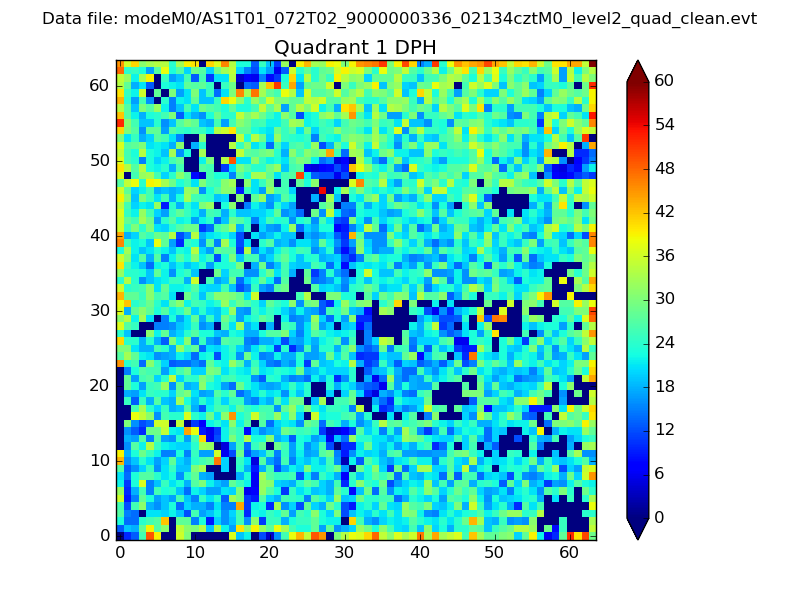 |
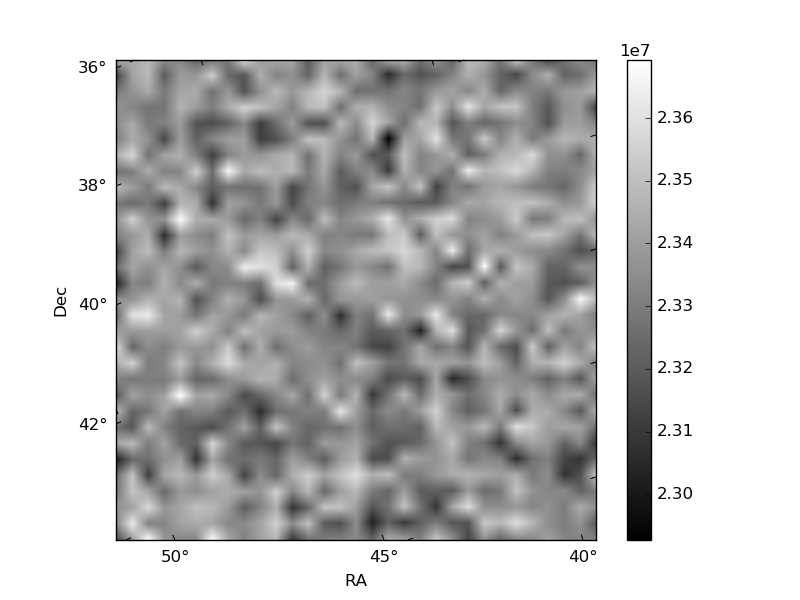
Quadrant B |
|---|---|---|---|
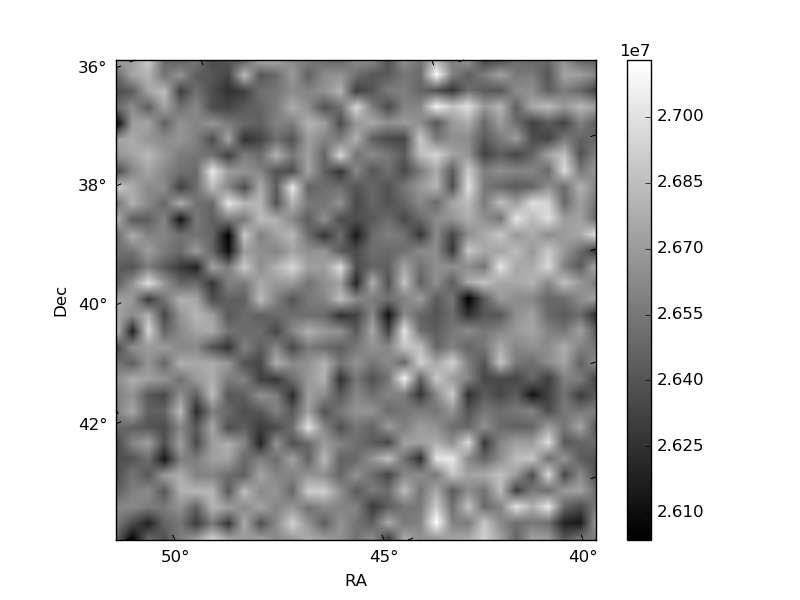
| Quadrant D | 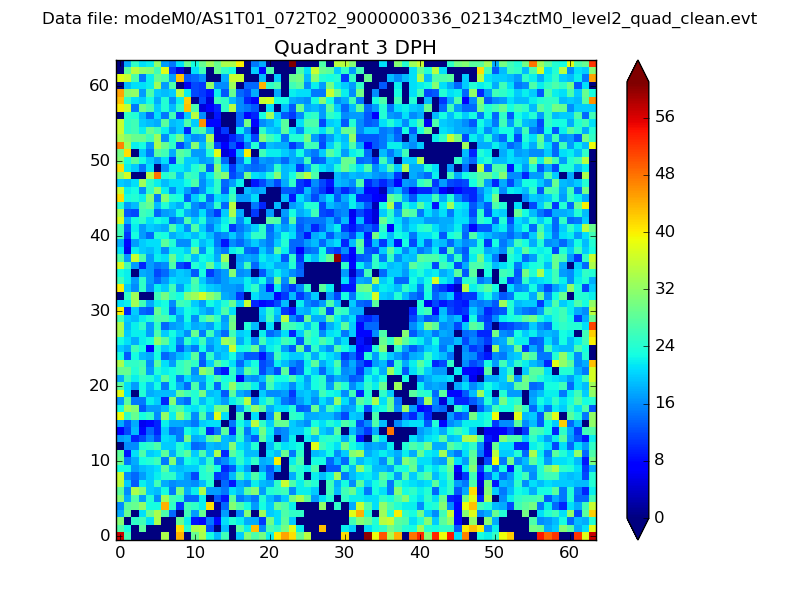 |
 |
Quadrant C |
| Plot type | Count rate plots | Images |
|---|---|---|
| Comparison with Poisson distribution Blue bars denote a histogram of data divided into 1 sec bins. Red curve is a Poisson curve with rate = median count rate of data. |
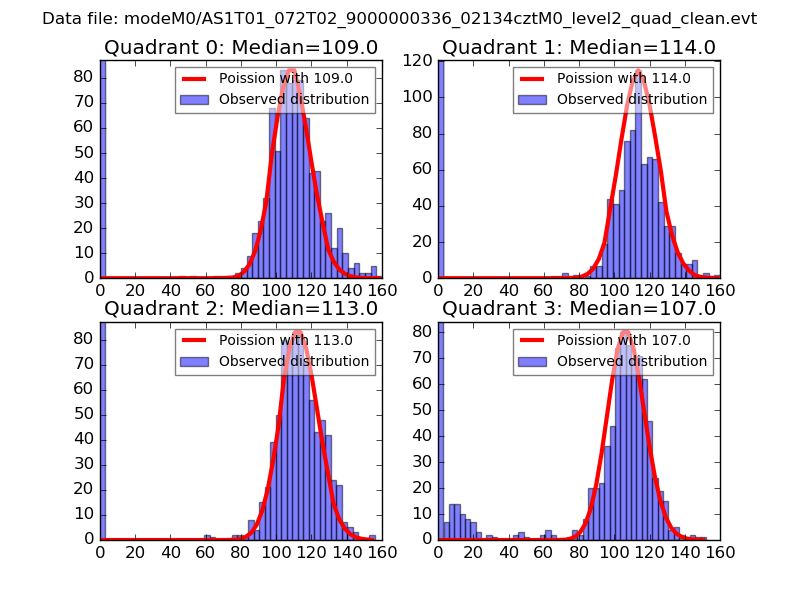 |
 |
| Quadrant-wise count rates Data is divided into 100 sec bins |
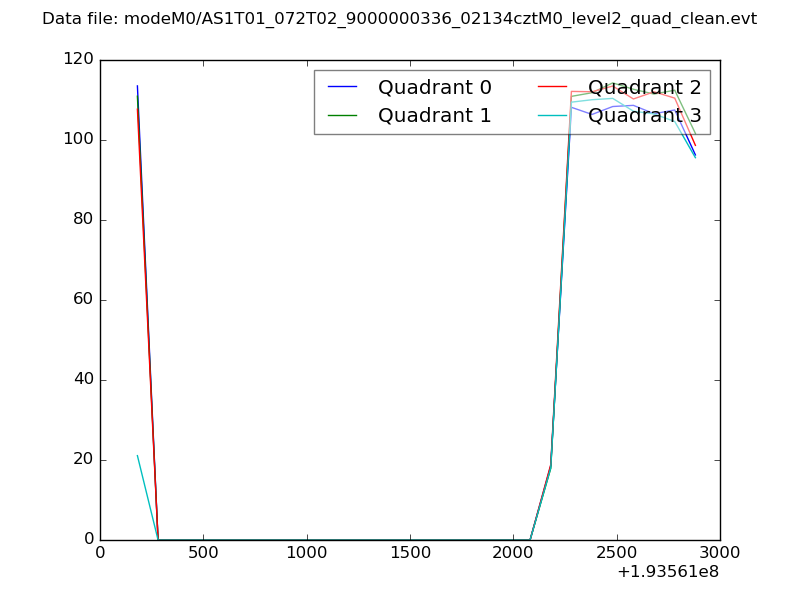 |
|
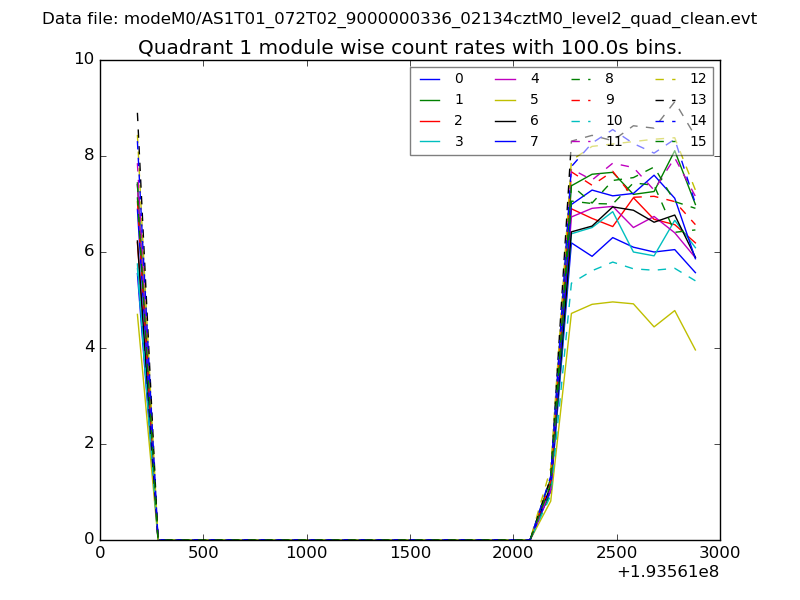
| Module-wise count rates for Quadrant A Data is divided into 100 sec bins |
 |
 |
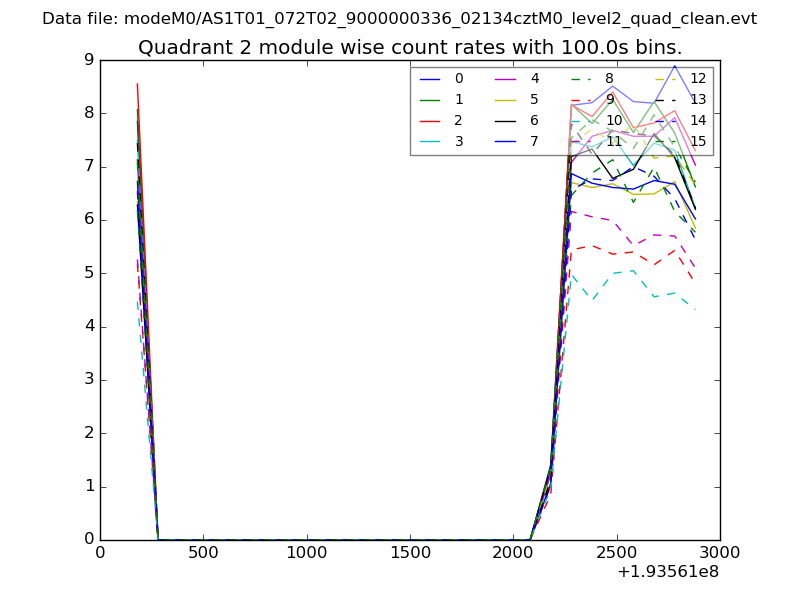
| Module-wise count rates for Quadrant B Data is divided into 100 sec bins |
 |
 |
| Module-wise count rates for Quadrant C Data is divided into 100 sec bins |
 |
 |
| Module-wise count rates for Quadrant D Data is divided into 100 sec bins |
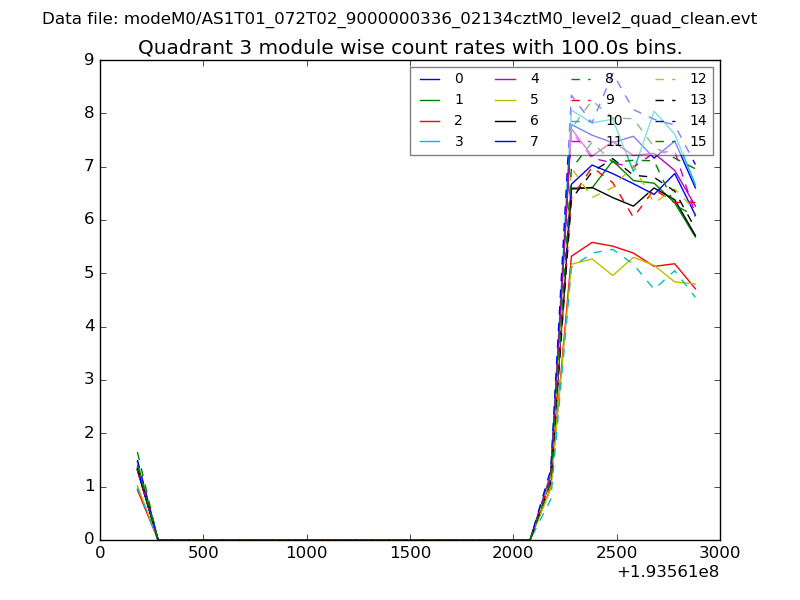 |
 |
| Parameter | Plot |
|---|---|
| CZT HV Monitor | 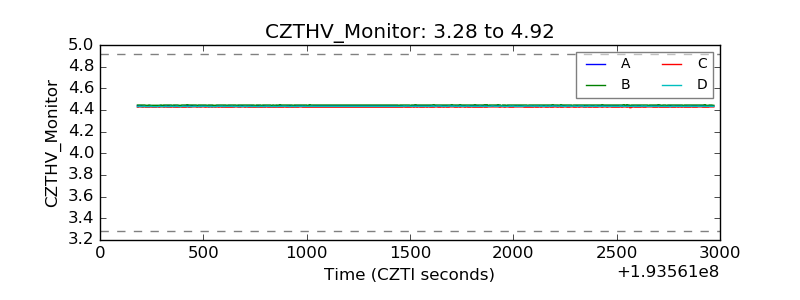 |
| D_VDD | 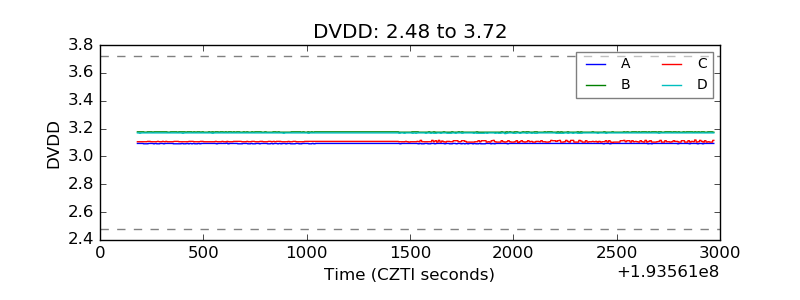 |
| Temperature 1 | 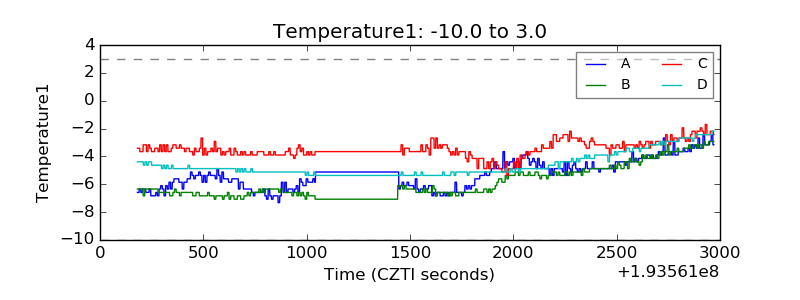 |
| Veto HV Monitor | 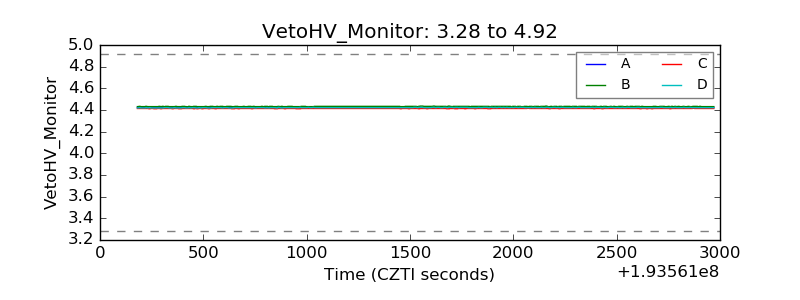 |
| Veto LLD | 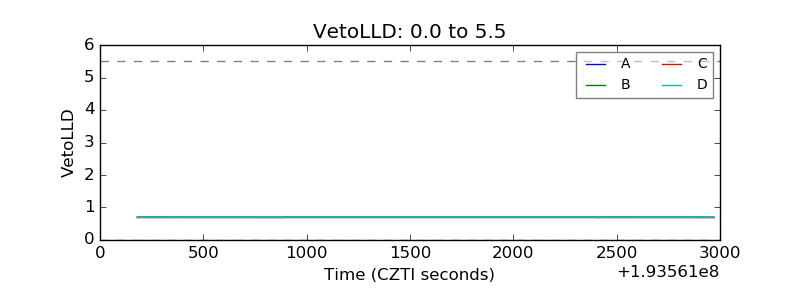 |
| Alpha Counter | 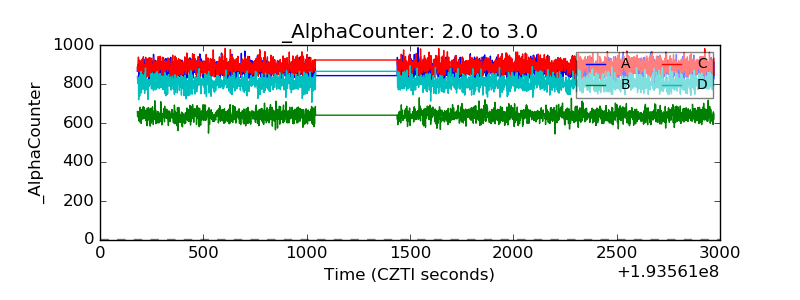 |
| _CPM_Rate | 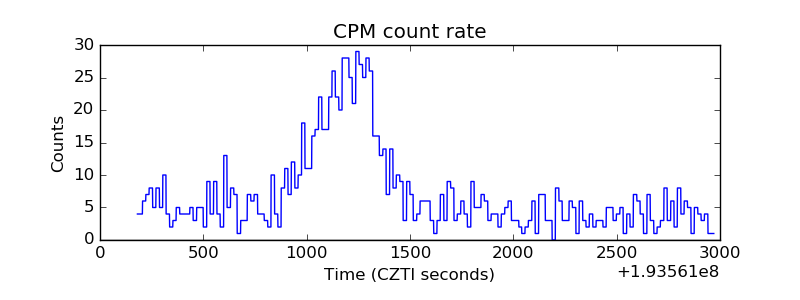 |
| CZT Counter | 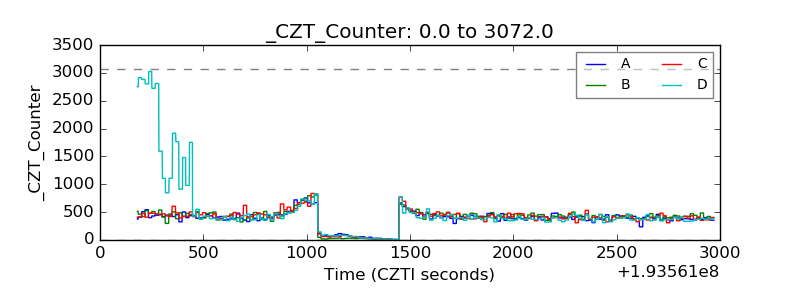 |
| +2.5 Volts monitor |  |
| +5 Volts monitor | 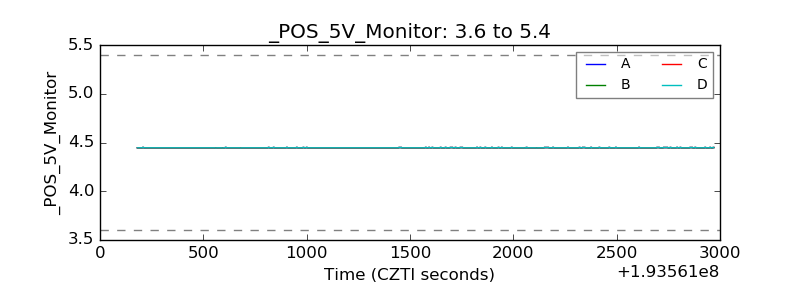 |
| _ROLL_ROT | 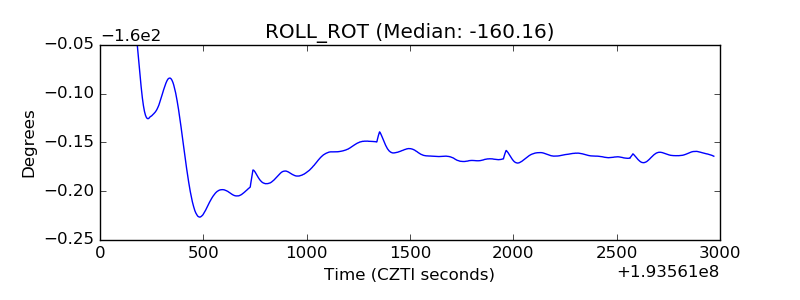 |
| _Roll_DEC | 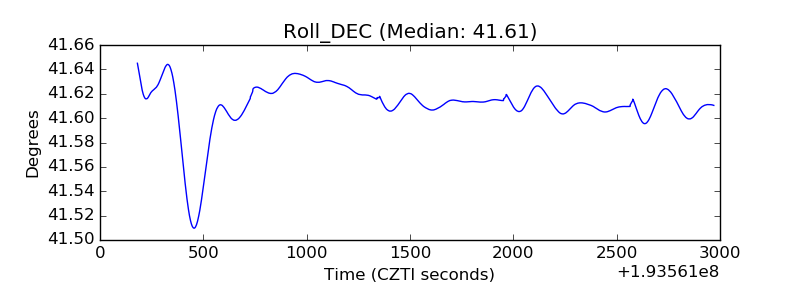 |
| _Roll_RA | 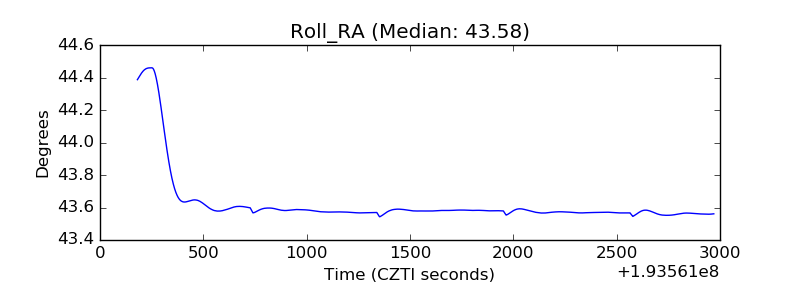 |
| Veto Counter | 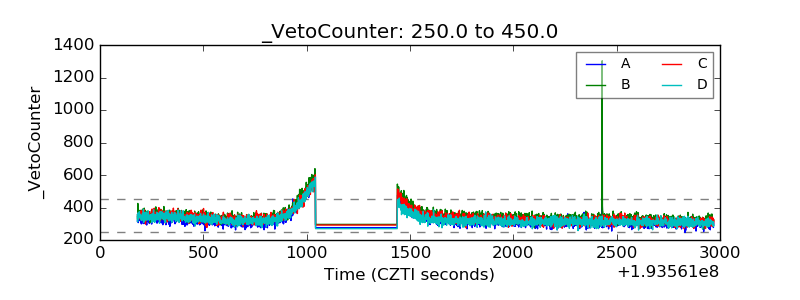 |