| Param | Original file | Final file |
|---|---|---|
| Filename | modeM0/AS1SLEW_01234_9000000407_02787cztM0_level2.evt | modeM0/AS1SLEW_01234_9000000407_02787cztM0_level2_quad_clean.evt |
| Size (bytes) | 33,696,000 | 8,464,320 |
| Size | 32.1 MB | 8.1 MB |
| Events in quadrant A | 221,976 | 52,665 |
| Events in quadrant B | 264,470 | 54,378 |
| Events in quadrant C | 268,056 | 53,955 |
| Events in quadrant D | 228,219 | 51,670 |
| Mode M0 | |||
|---|---|---|---|
| Quadrant | BADHDUFLAG | Total packets | Discarded packets |
| A | 0 | 1007 | 0 |
| B | 0 | 1116 | 0 |
| C | 0 | 1070 | 0 |
| D | 0 | 1026 | 0 |
| Mode SS | |||
|---|---|---|---|
| Quadrant | BADHDUFLAG | Total packets | Discarded packets |
| A | 0 | 10 | 0 |
| B | 0 | 10 | 0 |
| C | 0 | 10 | 0 |
| D | 0 | 10 | 0 |
| Quadrant | Total seconds | Saturated seconds | Saturation percentage |
|---|---|---|---|
| A | 502 | 0 | 0.000000% |
| B | 502 | 5 | 0.996016% |
| C | 502 | 0 | 0.000000% |
| D | 502 | 0 | 0.000000% |
Noise dominated data is calculated using 1-second bins in cleaned event files. If a bin has >2000 counts, and if more than 50% of those come from <1% of pixels, then it is considered to be noise-dominated and hence unusable.
| Quadrant | # 1 sec bins | Bins with >0 counts | Bins with >2000 counts | High rate bins dominated by noise | Noise dominated (total time) | Noise dominated (detector-on time) | Marked lightcurve |
|---|---|---|---|---|---|---|---|
| A | 502 | 502 | 0 | 0 | 0.00% | 0.00% | 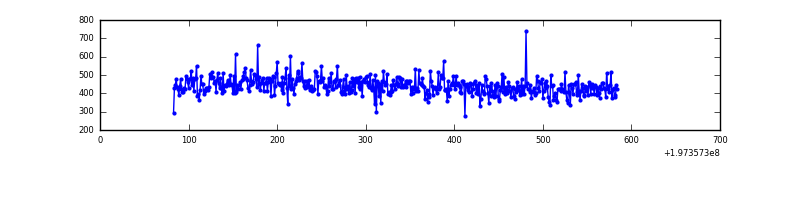 |
| B | 502 | 502 | 2 | 2 | 0.40% | 0.40% | 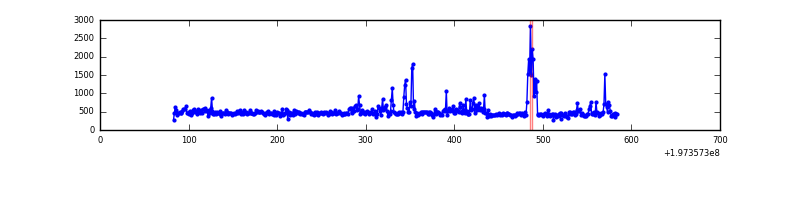 |
| C | 502 | 502 | 0 | 0 | 0.00% | 0.00% | 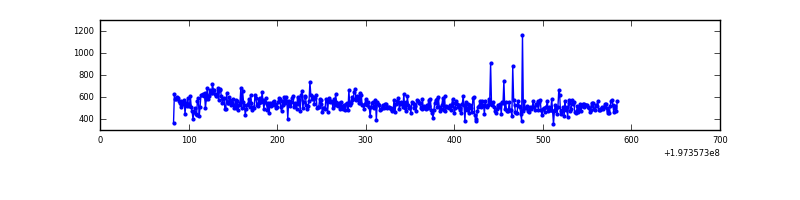 |
| D | 502 | 502 | 0 | 0 | 0.00% | 0.00% | 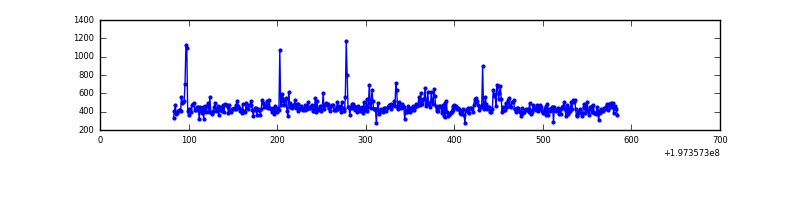 |
Top three noisy pixels from each quadrant. If the there are fewer than three noisy pixels in the level2.evt file, extra rows are filled as -1
| Pixel properties | Quadrant properties | ||||||
|---|---|---|---|---|---|---|---|
| Quadrant | DetID | PixID | Counts | Sigma | Mean | Median | Sigma |
| A | 12 | 194 | 623 | 39.91 | 57 | 56 | 14.2 |
| A | 0 | 226 | 608 | 38.85 | 57 | 56 | 14.2 |
| A | 8 | 15 | 603 | 38.5 | 57 | 56 | 14.2 |
| B | 14 | 167 | 35305 | 2607.83 | 57 | 56 | 13.5 |
| B | 0 | 189 | 5762 | 422.15 | 57 | 56 | 13.5 |
| B | 5 | 175 | 1817 | 130.28 | 57 | 56 | 13.5 |
| C | 0 | 64 | 42721 | 2921.75 | 54 | 55 | 14.6 |
| C | 14 | 67 | 8244 | 560.78 | 54 | 55 | 14.6 |
| C | 14 | 223 | 2165 | 144.49 | 54 | 55 | 14.6 |
| D | 5 | 172 | 4000 | 264.61 | 54 | 53 | 14.9 |
| D | 12 | 126 | 3986 | 263.67 | 54 | 53 | 14.9 |
| D | 1 | 255 | 3720 | 245.84 | 54 | 53 | 14.9 |
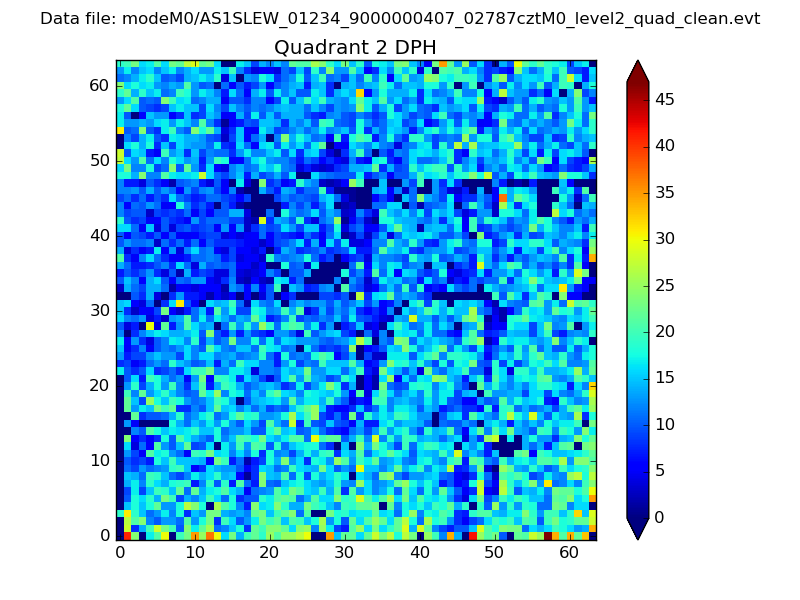
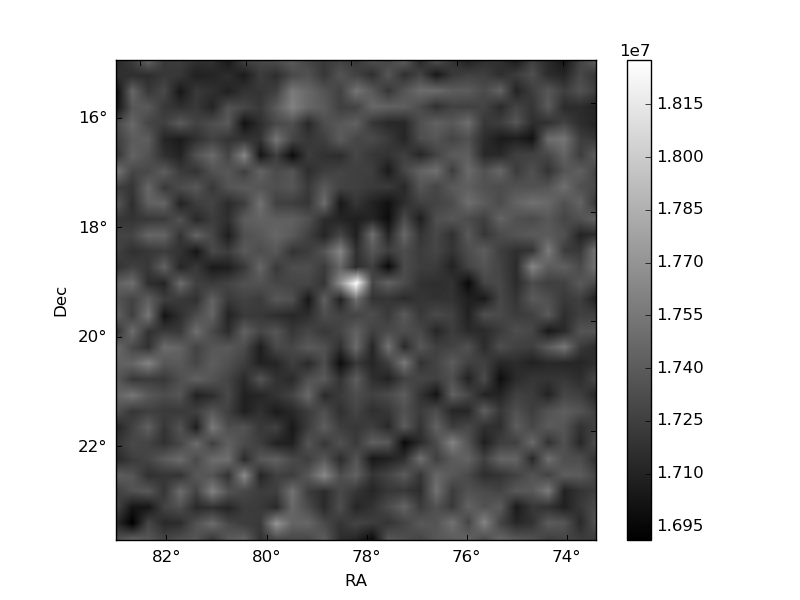
Histogram calculated using DETX and DETY for each event in the final _common_clean file
| Quadrant A | 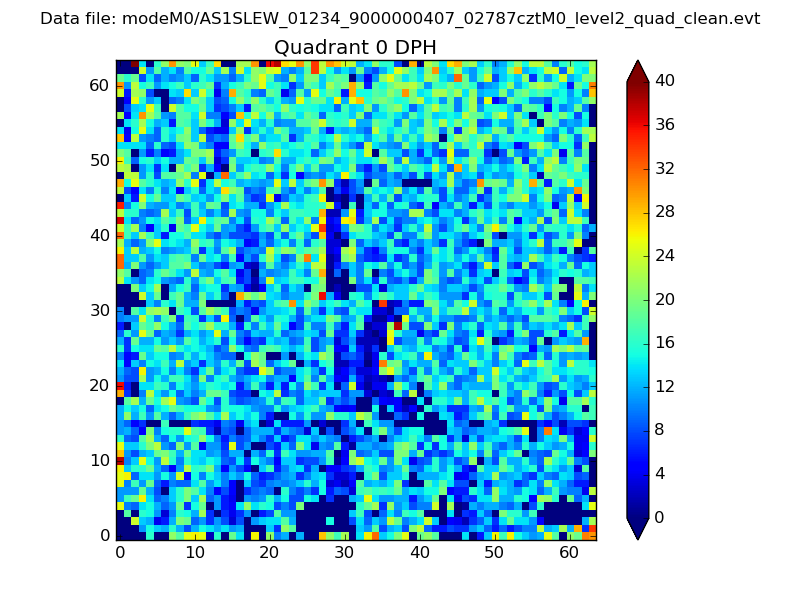 |
 |
Quadrant B |
|---|---|---|---|
| Quadrant D |  |
 |
Quadrant C |
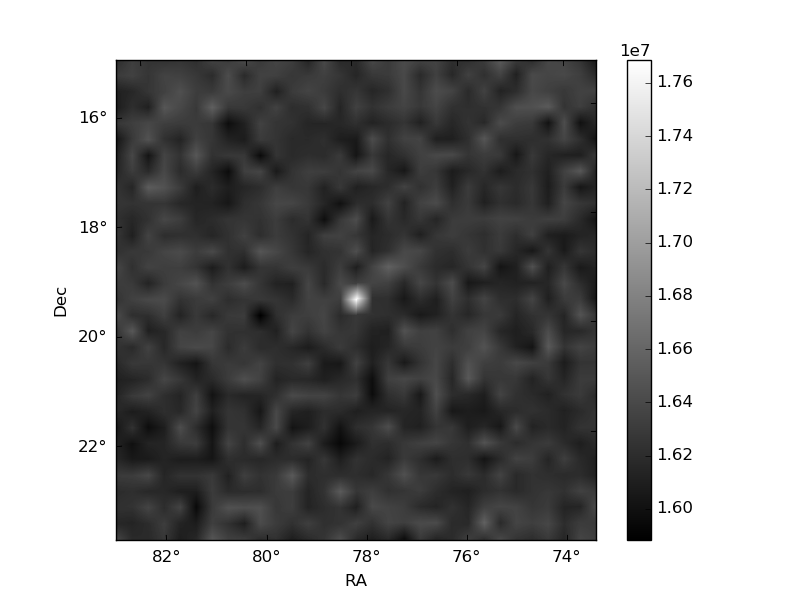
| Plot type | Count rate plots | Images |
|---|---|---|
| Comparison with Poisson distribution Blue bars denote a histogram of data divided into 1 sec bins. Red curve is a Poisson curve with rate = median count rate of data. |
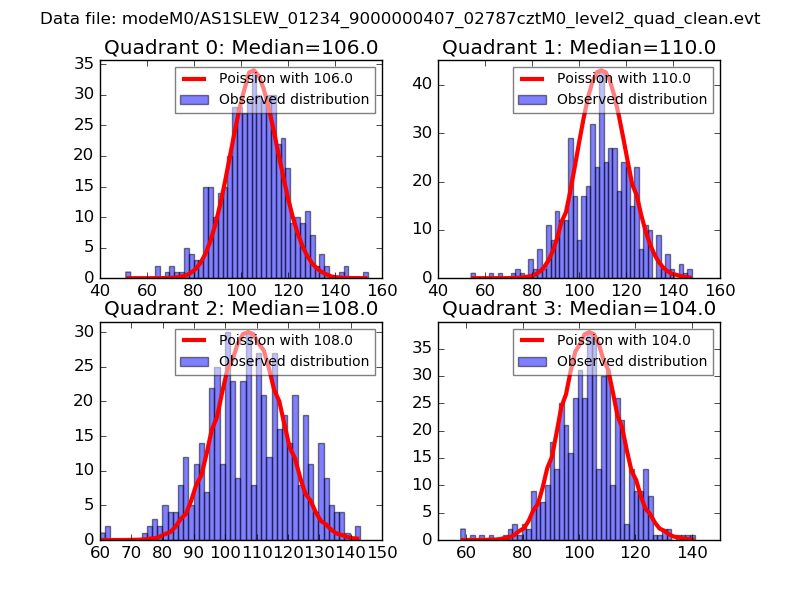 |
 |
| Quadrant-wise count rates Data is divided into 100 sec bins |
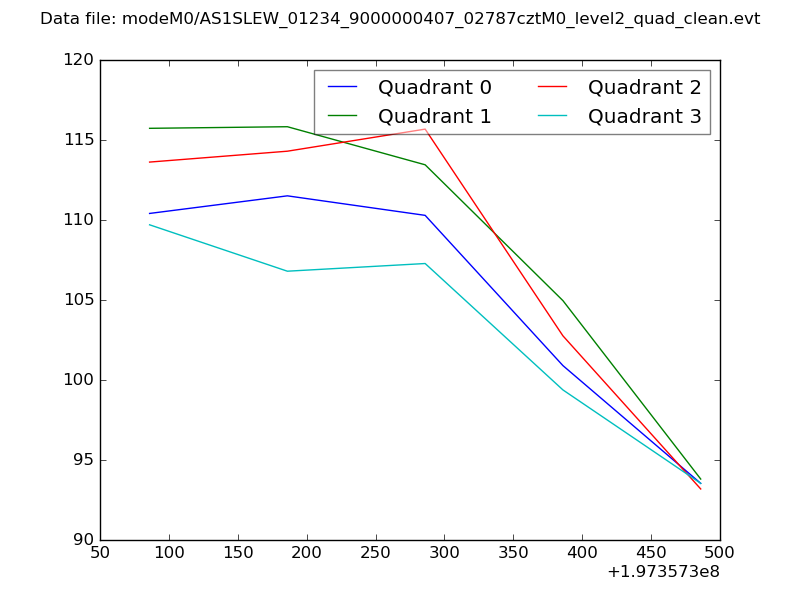 |
|
| Module-wise count rates for Quadrant A Data is divided into 100 sec bins |
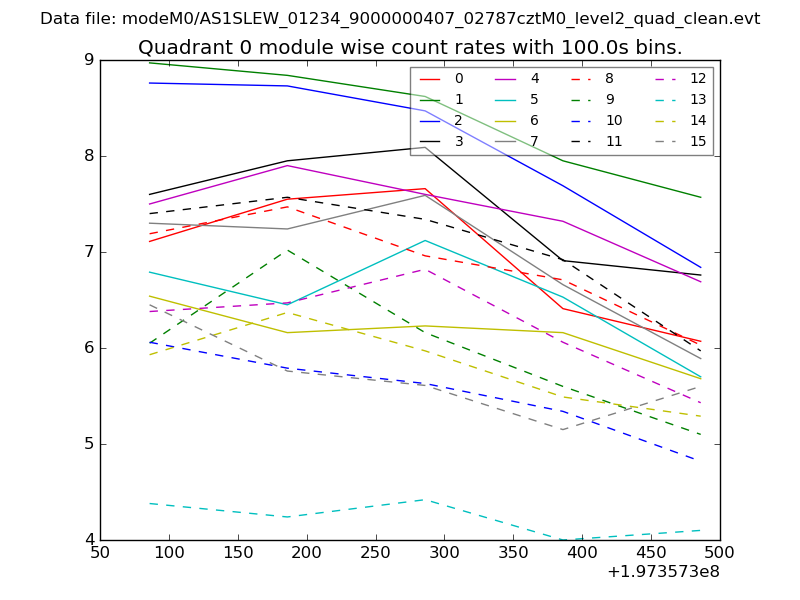 |
 |
| Module-wise count rates for Quadrant B Data is divided into 100 sec bins |
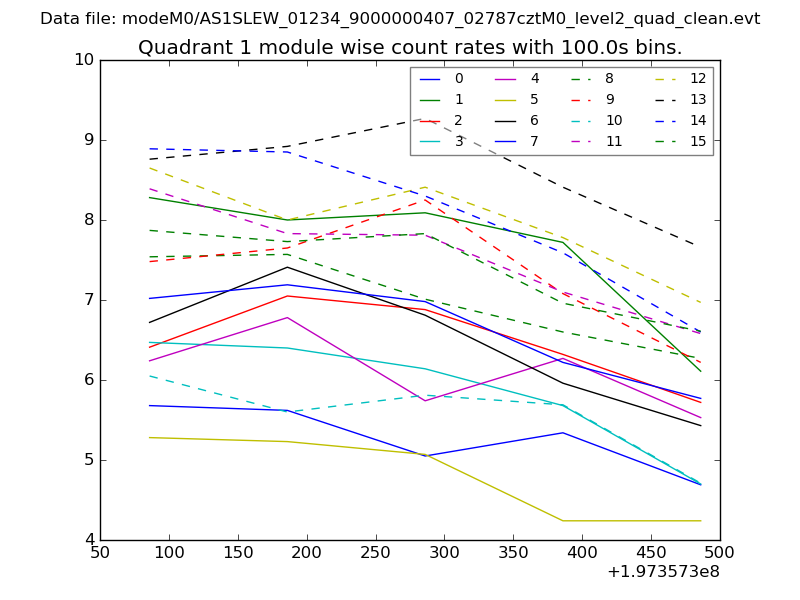 |
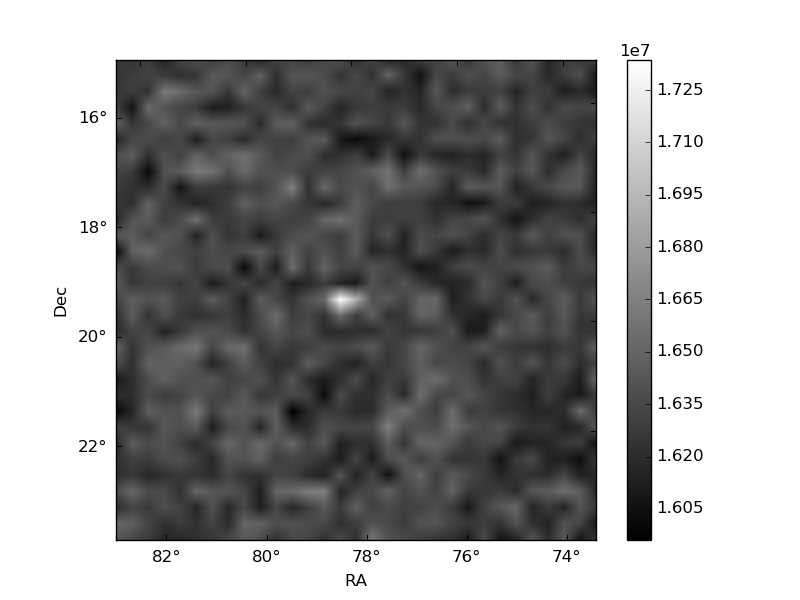 |
| Module-wise count rates for Quadrant C Data is divided into 100 sec bins |
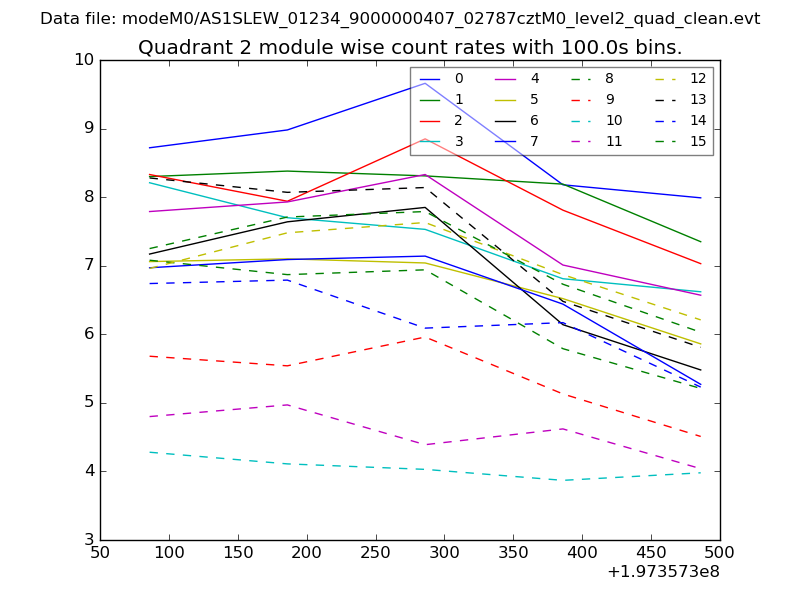 |
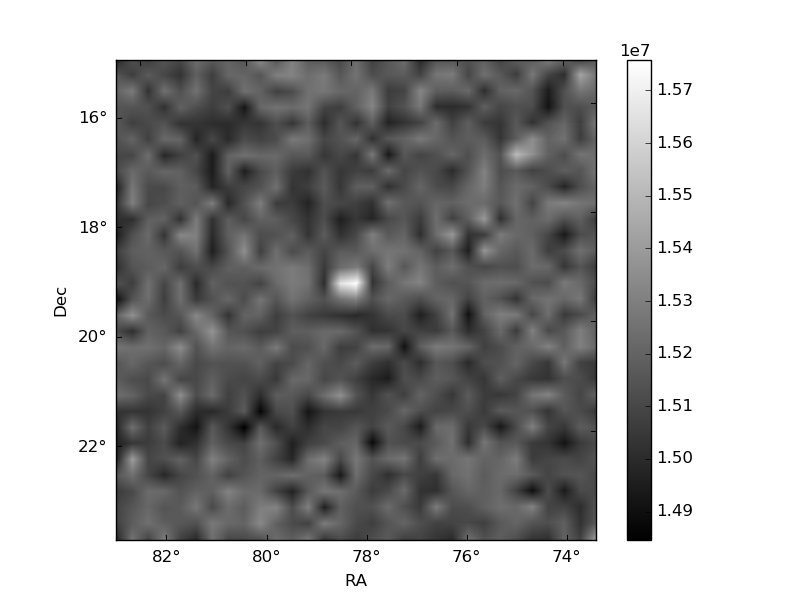 |
| Module-wise count rates for Quadrant D Data is divided into 100 sec bins |
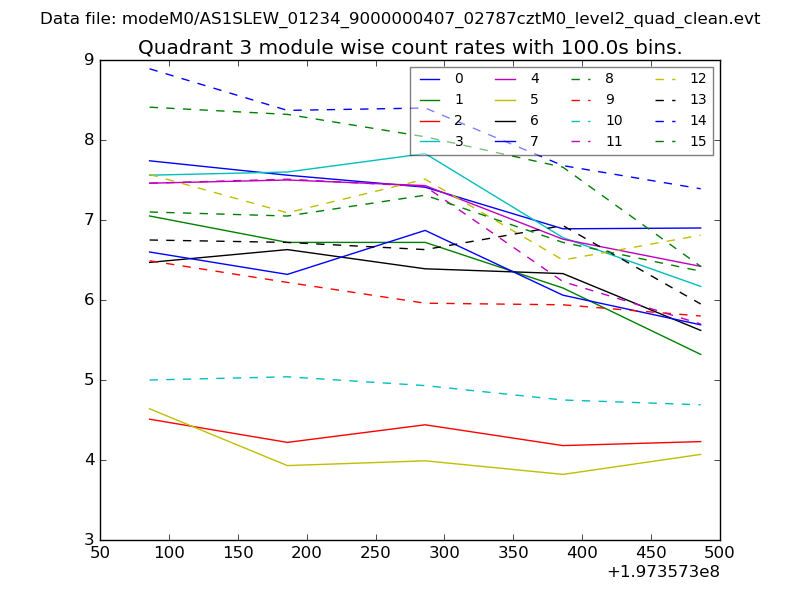 |
 |
| Parameter | Plot |
|---|---|
| CZT HV Monitor | 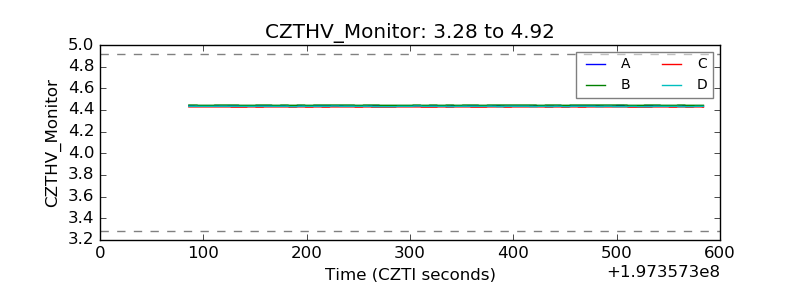 |
| D_VDD | 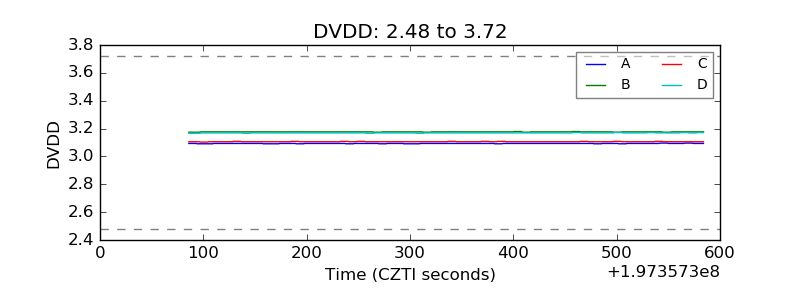 |
| Temperature 1 | 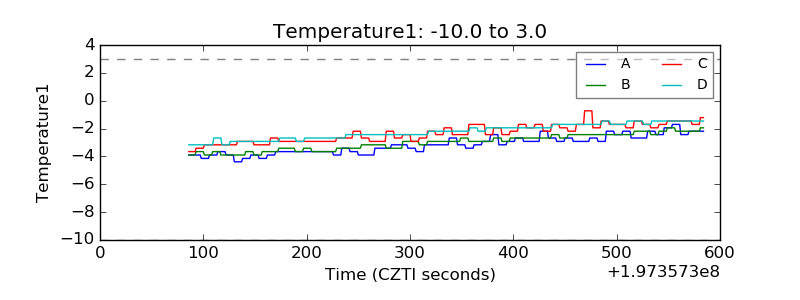 |
| Veto HV Monitor | 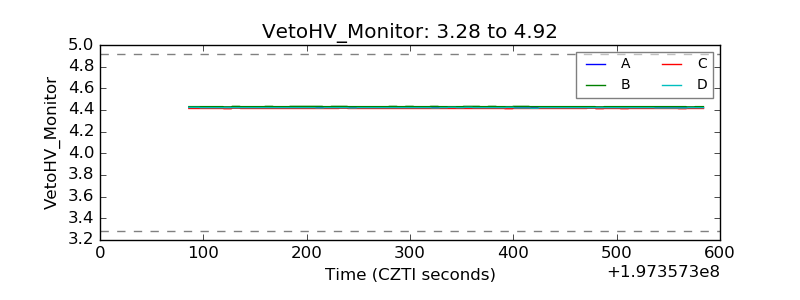 |
| Veto LLD | 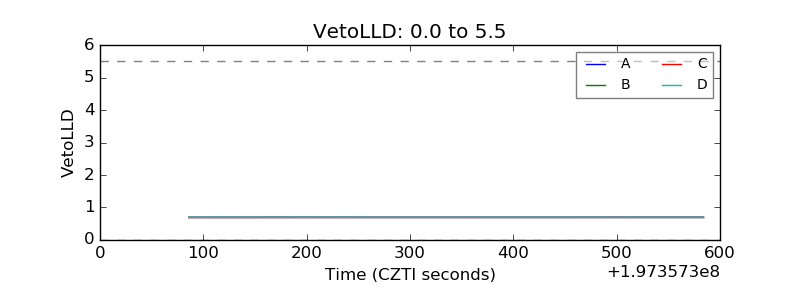 |
| Alpha Counter | 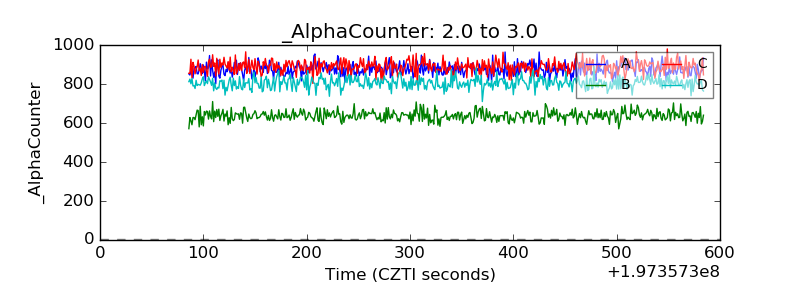 |
| _CPM_Rate | 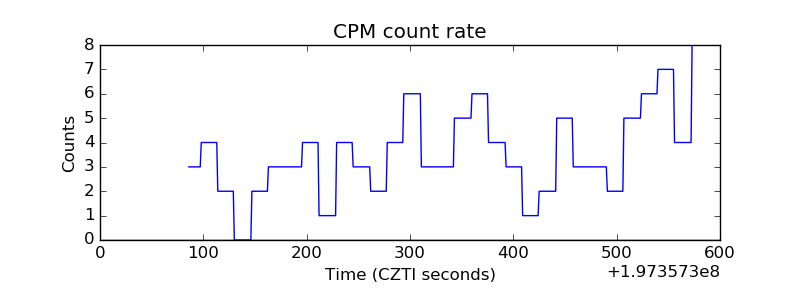 |
| CZT Counter |  |
| +2.5 Volts monitor |  |
| +5 Volts monitor |  |
| Veto Counter | 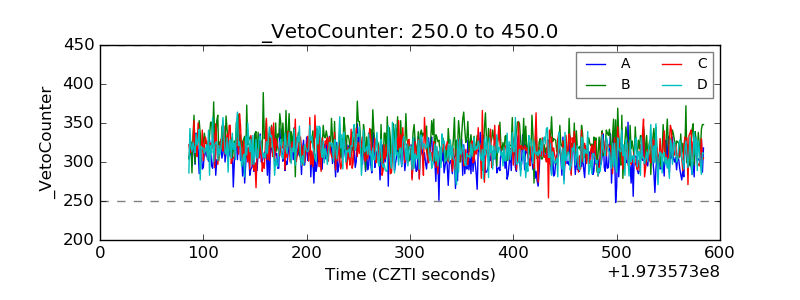 |