| Param | Original file | Final file |
|---|---|---|
| Filename | modeM0/AS1G05_002T02_9000000444_03283cztM0_level2.evt | modeM0/AS1G05_002T02_9000000444_03283cztM0_level2_quad_clean.evt |
| Size (bytes) | 36,498,240 | 7,873,920 |
| Size | 34.8 MB | 7.5 MB |
| Events in quadrant A | 230,781 | 50,982 |
| Events in quadrant B | 407,230 | 50,533 |
| Events in quadrant C | 225,428 | 49,784 |
| Events in quadrant D | 209,673 | 49,001 |
| Mode M0 | |||
|---|---|---|---|
| Quadrant | BADHDUFLAG | Total packets | Discarded packets |
| A | 0 | 934 | 1 |
| B | 0 | 1510 | 1 |
| C | 0 | 919 | 1 |
| D | 0 | 887 | 1 |
| Mode M9 | |||
|---|---|---|---|
| Quadrant | BADHDUFLAG | Total packets | Discarded packets |
| A | 0 | 6 | 0 |
| B | 0 | 6 | 0 |
| C | 0 | 6 | 0 |
| D | 0 | 7 | 0 |
| Mode SS | |||
|---|---|---|---|
| Quadrant | BADHDUFLAG | Total packets | Discarded packets |
| A | 0 | 8 | 0 |
| B | 0 | 8 | 0 |
| C | 0 | 8 | 0 |
| D | 0 | 8 | 0 |
| Quadrant | Total seconds | Saturated seconds | Saturation percentage |
|---|---|---|---|
| A | 423 | 4 | 0.945626% |
| B | 423 | 31 | 7.328605% |
| C | 423 | 2 | 0.472813% |
| D | 423 | 1 | 0.236407% |
Noise dominated data is calculated using 1-second bins in cleaned event files. If a bin has >2000 counts, and if more than 50% of those come from <1% of pixels, then it is considered to be noise-dominated and hence unusable.
| Quadrant | # 1 sec bins | Bins with >0 counts | Bins with >2000 counts | High rate bins dominated by noise | Noise dominated (total time) | Noise dominated (detector-on time) | Marked lightcurve |
|---|---|---|---|---|---|---|---|
| A | 423 | 423 | 0 | 0 | 0.00% | 0.00% | 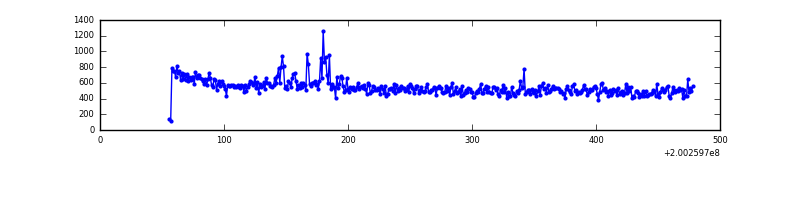 |
| B | 423 | 423 | 4 | 4 | 0.95% | 0.95% | 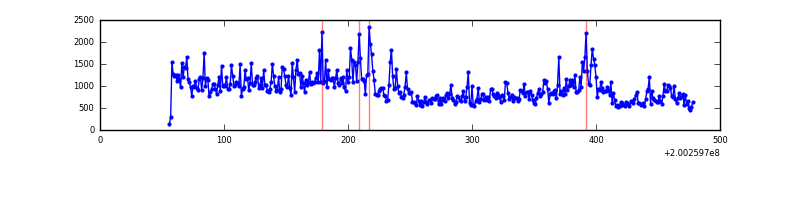 |
| C | 423 | 423 | 0 | 0 | 0.00% | 0.00% | 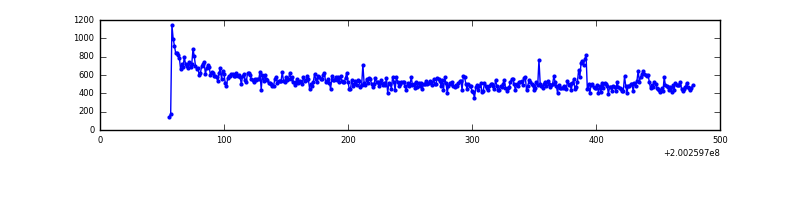 |
| D | 423 | 423 | 0 | 0 | 0.00% | 0.00% | 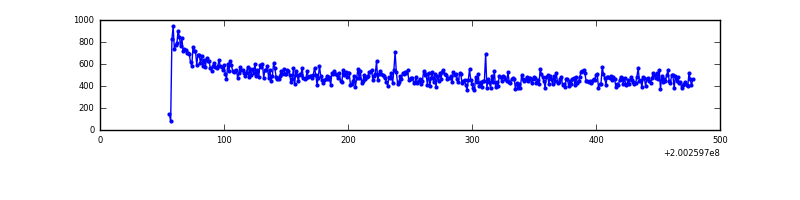 |
Top three noisy pixels from each quadrant. If the there are fewer than three noisy pixels in the level2.evt file, extra rows are filled as -1
| Pixel properties | Quadrant properties | ||||||
|---|---|---|---|---|---|---|---|
| Quadrant | DetID | PixID | Counts | Sigma | Mean | Median | Sigma |
| A | 0 | 118 | 6412 | 445.27 | 57 | 56 | 14.3 |
| A | 0 | 226 | 1217 | 81.33 | 57 | 56 | 14.3 |
| A | 12 | 194 | 686 | 44.13 | 57 | 56 | 14.3 |
| B | 15 | 204 | 119558 | 8902.9 | 57 | 56 | 13.4 |
| B | 5 | 200 | 26812 | 1993.32 | 57 | 56 | 13.4 |
| B | 4 | 81 | 26001 | 1932.9 | 57 | 56 | 13.4 |
| C | 1 | 16 | 8781 | 604.62 | 53 | 53 | 14.4 |
| C | 14 | 223 | 2325 | 157.39 | 53 | 53 | 14.4 |
| C | 12 | 175 | 2068 | 139.59 | 53 | 53 | 14.4 |
| D | 1 | 193 | 1240 | 76.78 | 54 | 52 | 15.5 |
| D | 9 | 65 | 961 | 58.75 | 54 | 52 | 15.5 |
| D | 3 | 254 | 854 | 51.83 | 54 | 52 | 15.5 |
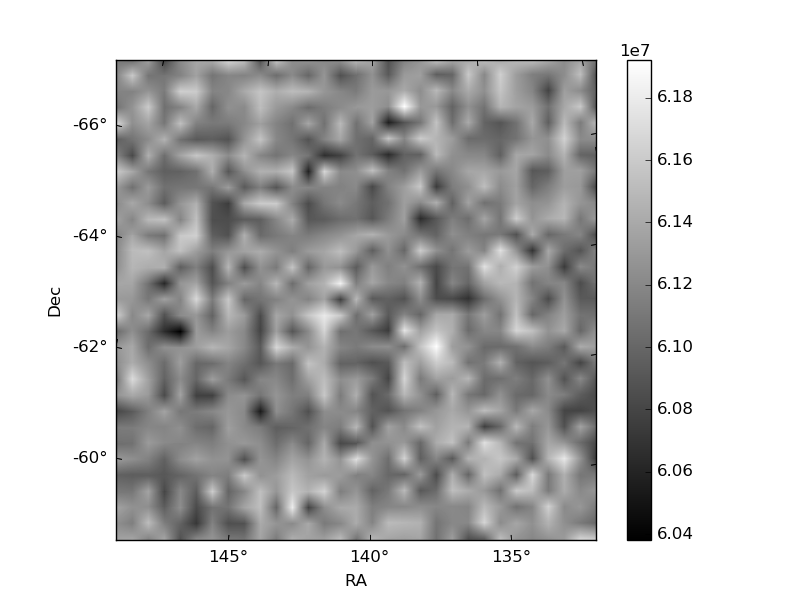
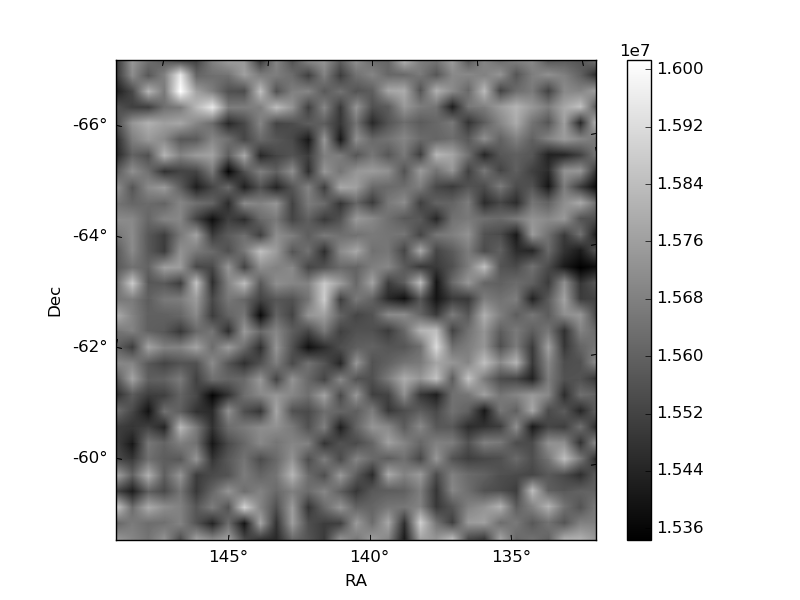
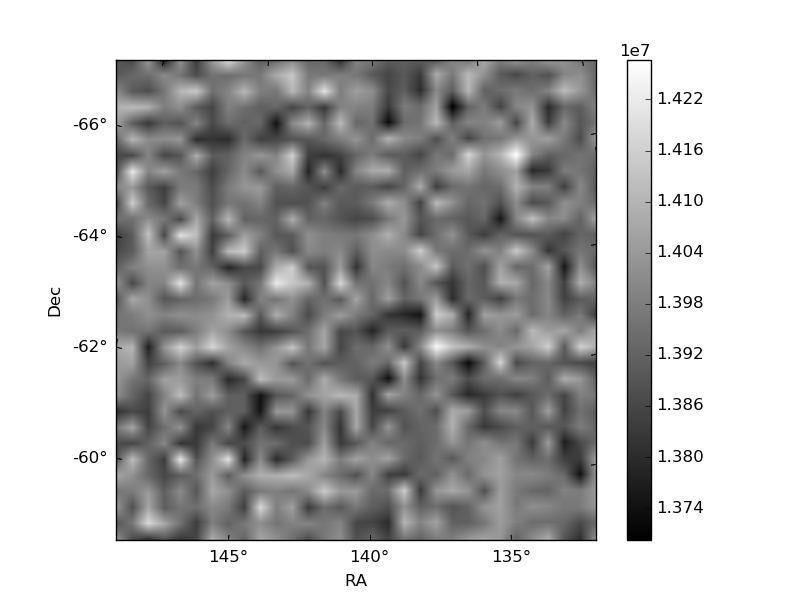
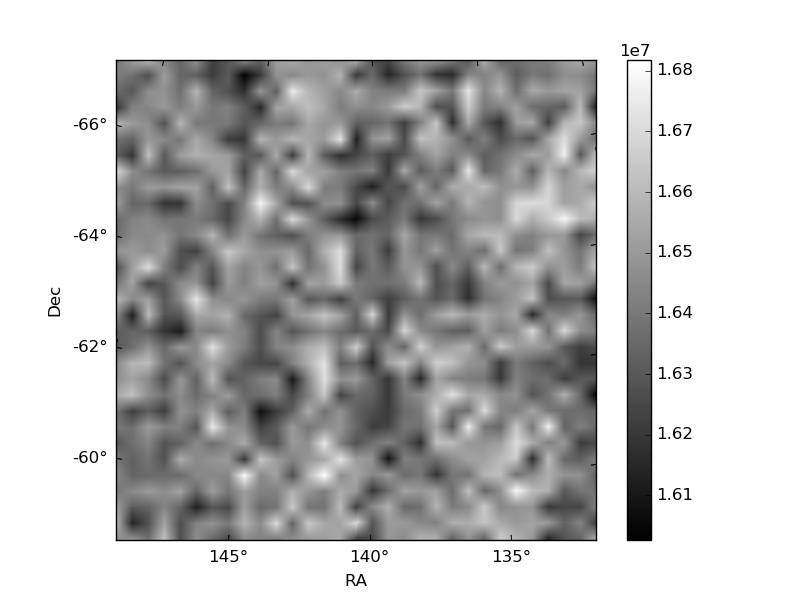
Histogram calculated using DETX and DETY for each event in the final _common_clean file
| Quadrant A | 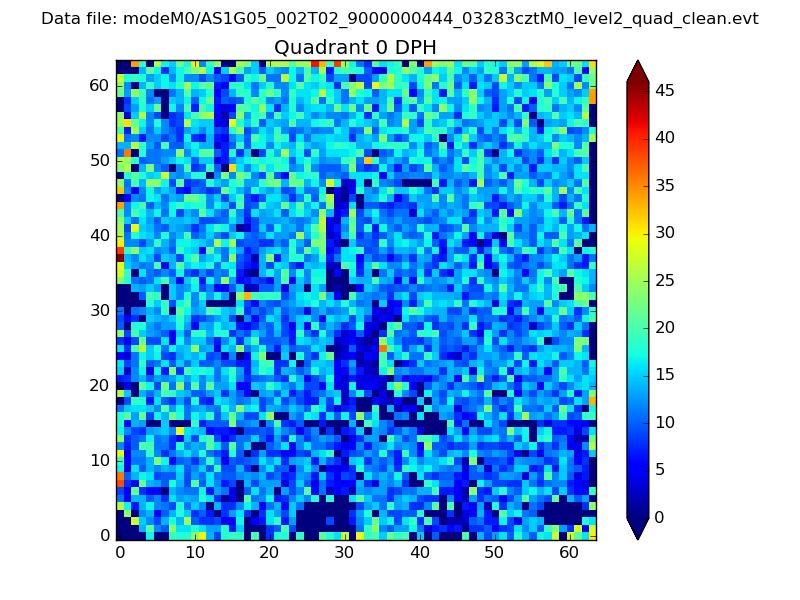 |
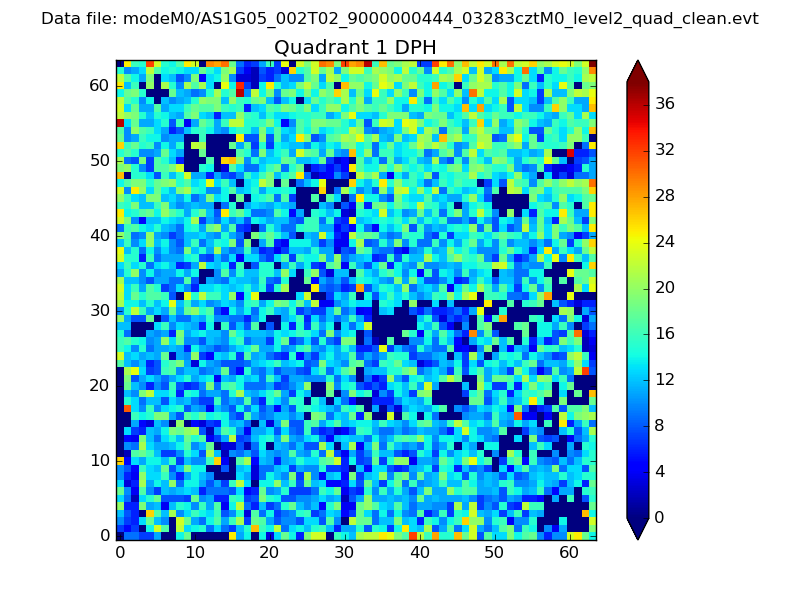 |
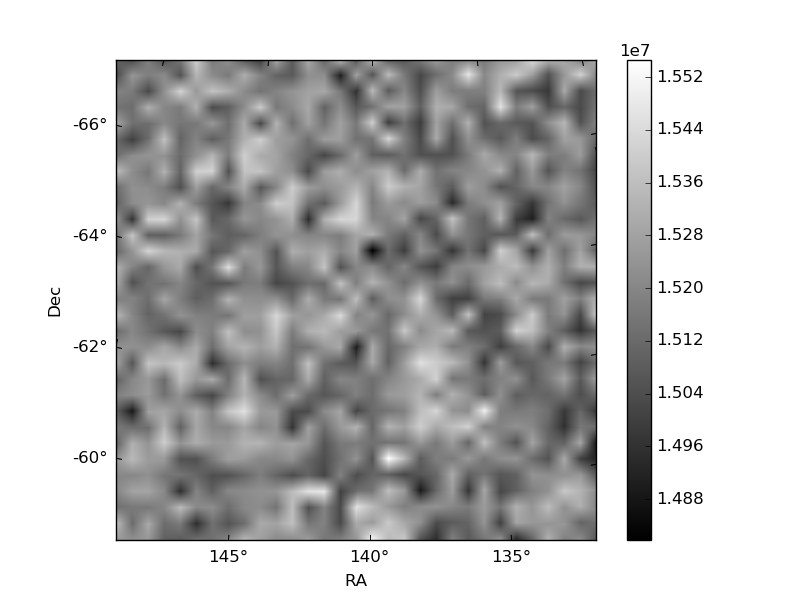
Quadrant B |
|---|---|---|---|
| Quadrant D | 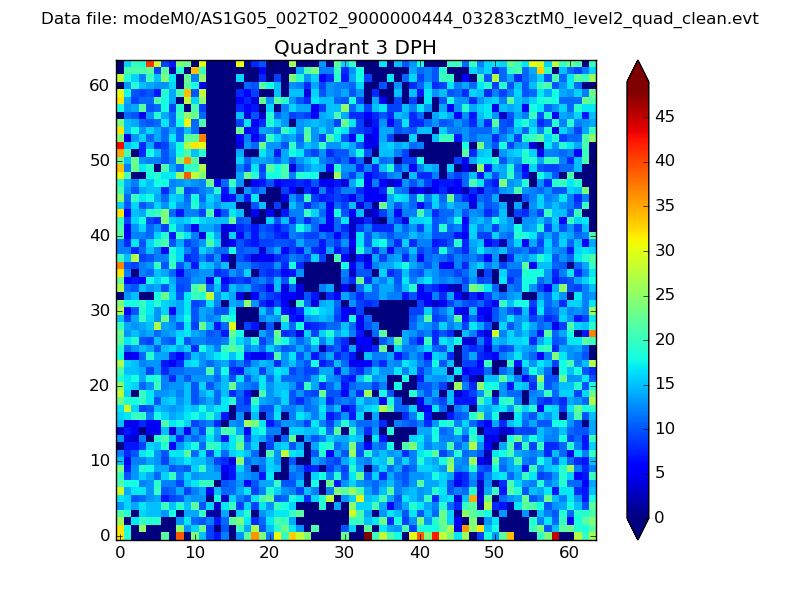 |
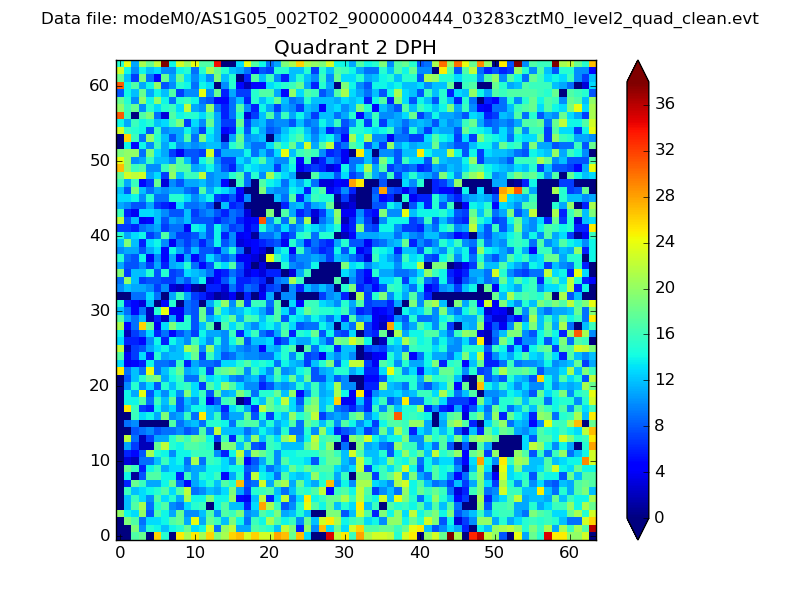 |
Quadrant C |
| Plot type | Count rate plots | Images |
|---|---|---|
| Comparison with Poisson distribution Blue bars denote a histogram of data divided into 1 sec bins. Red curve is a Poisson curve with rate = median count rate of data. |
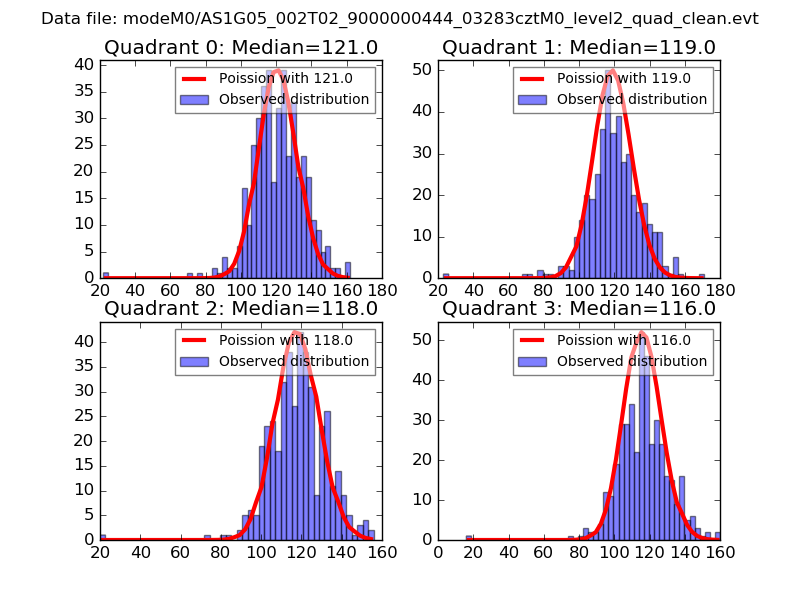 |
 |
| Quadrant-wise count rates Data is divided into 100 sec bins |
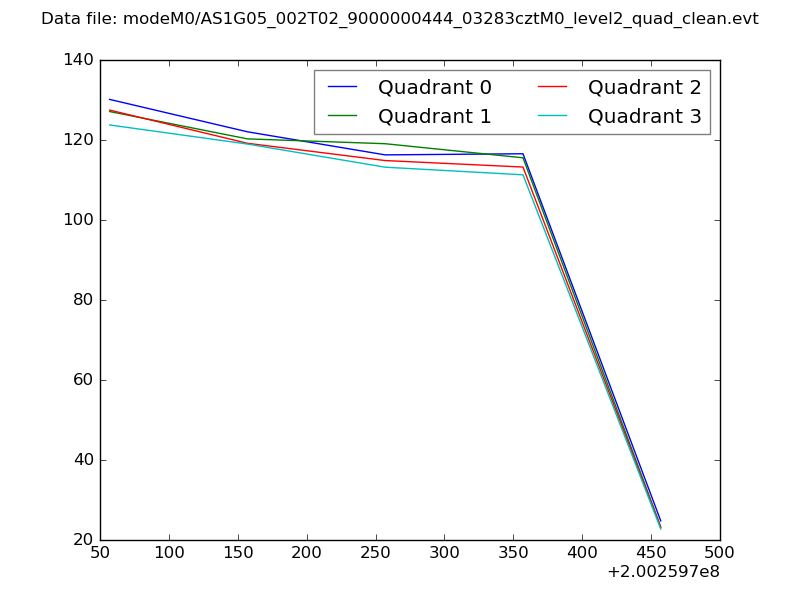 |
|
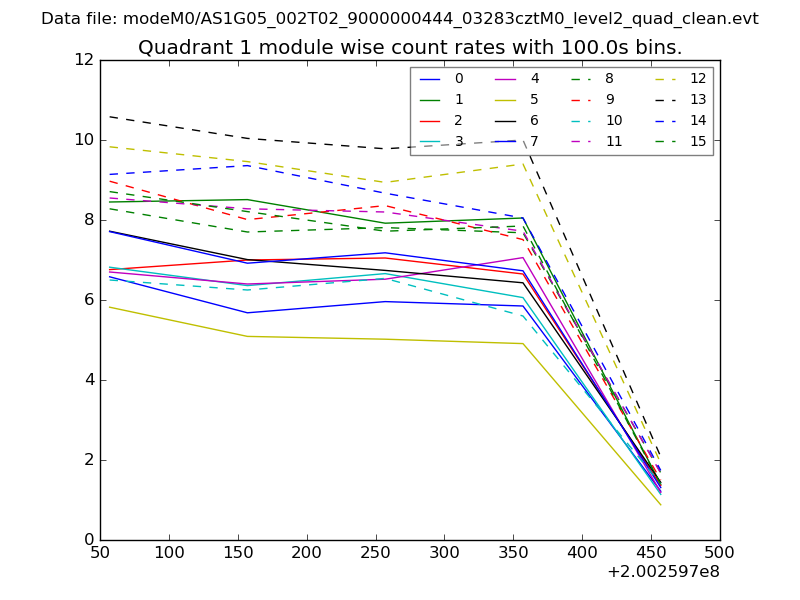
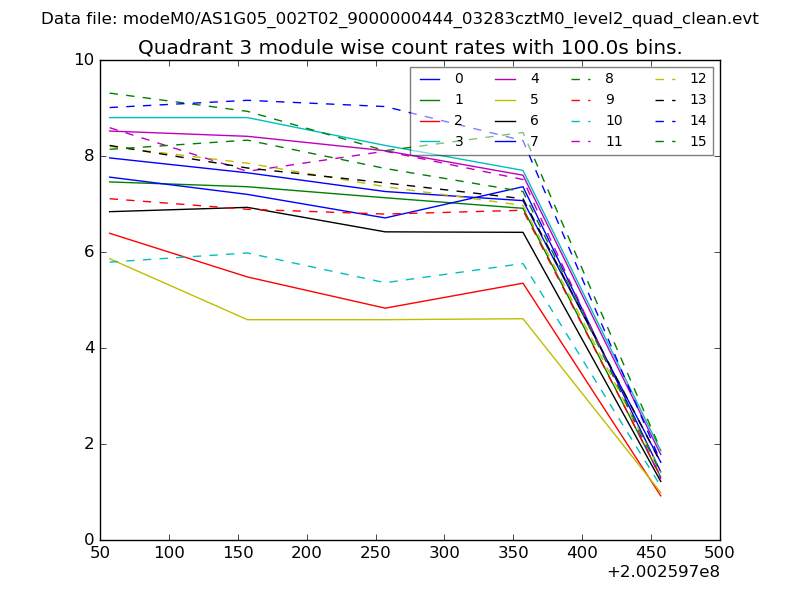
| Module-wise count rates for Quadrant A Data is divided into 100 sec bins |
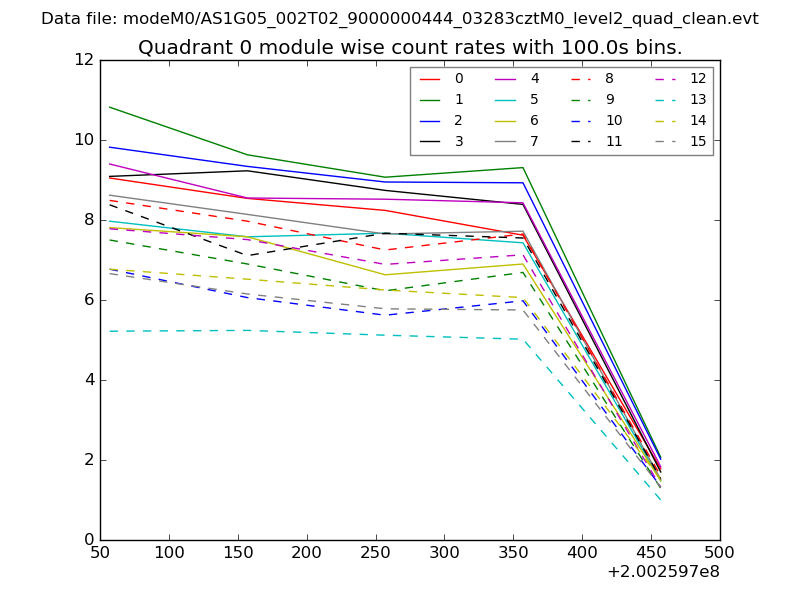 |
 |
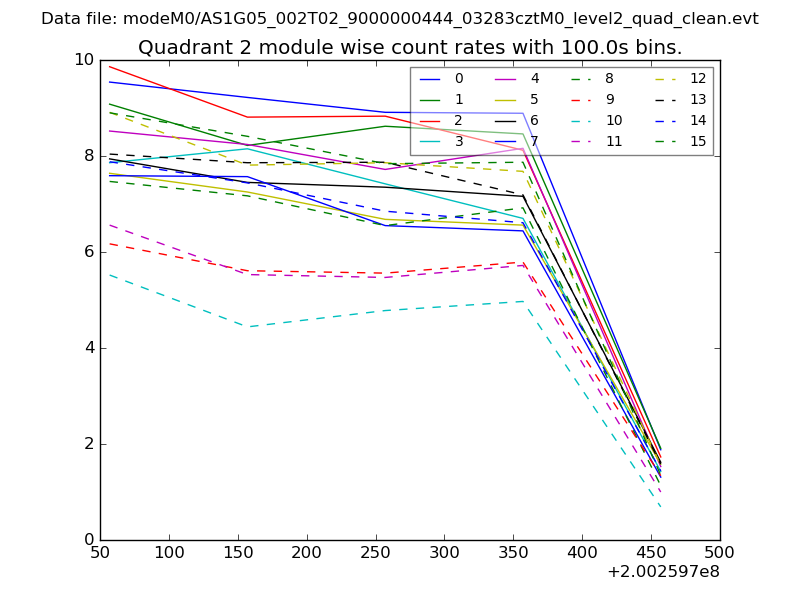
| Module-wise count rates for Quadrant B Data is divided into 100 sec bins |
 |
 |
| Module-wise count rates for Quadrant C Data is divided into 100 sec bins |
 |
 |
| Module-wise count rates for Quadrant D Data is divided into 100 sec bins |
 |
 |
| Parameter | Plot |
|---|---|
| CZT HV Monitor | 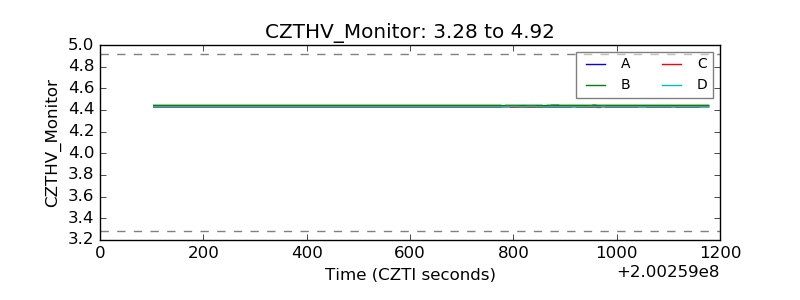 |
| D_VDD | 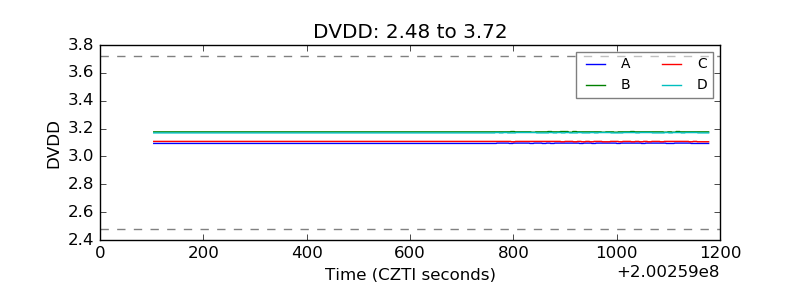 |
| Temperature 1 | 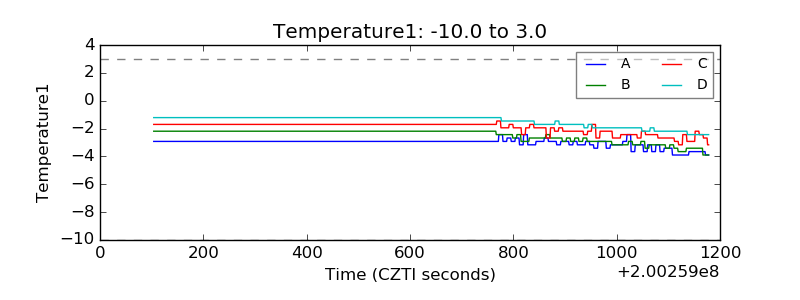 |
| Veto HV Monitor | 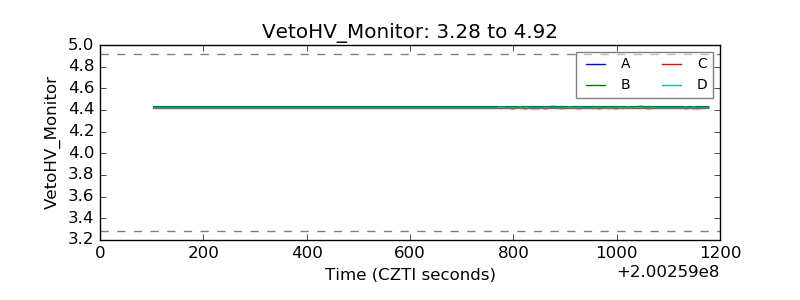 |
| Veto LLD | 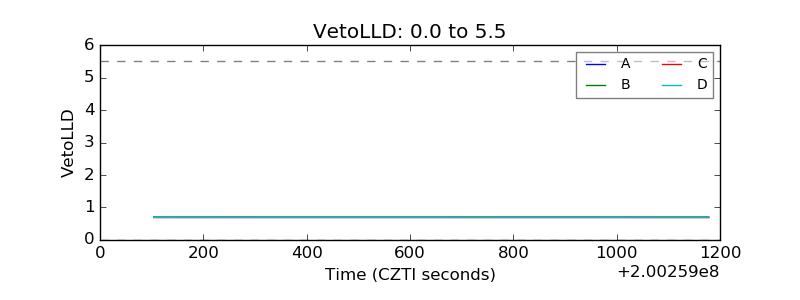 |
| Alpha Counter | 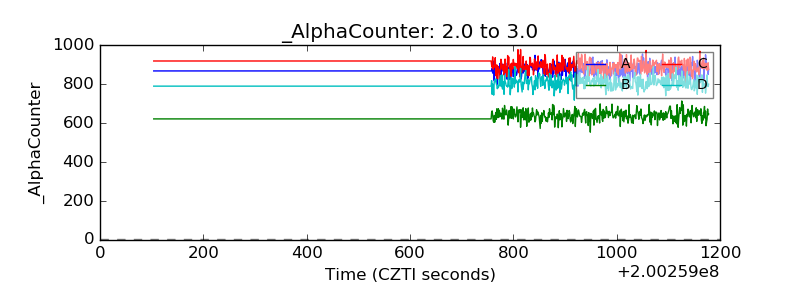 |
| _CPM_Rate | 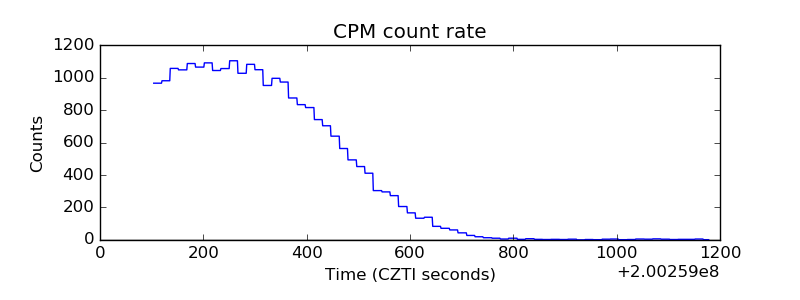 |
| CZT Counter | 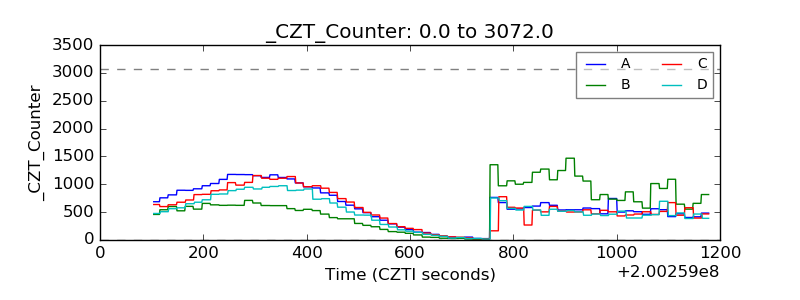 |
| +2.5 Volts monitor |  |
| +5 Volts monitor | 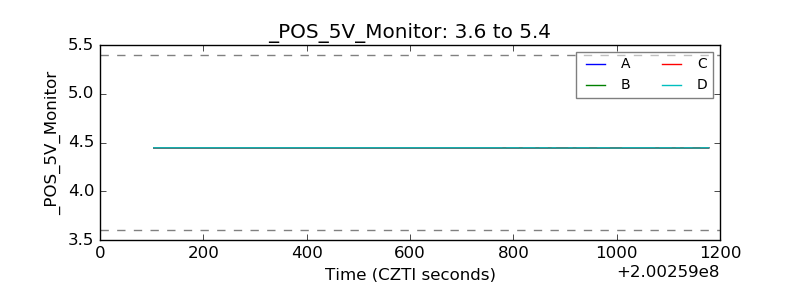 |
| Veto Counter | 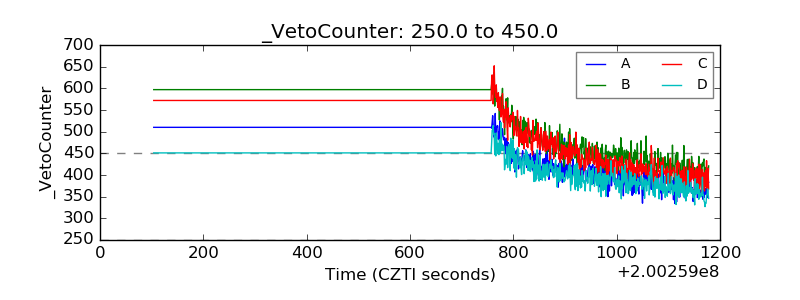 |