| Param | Original file | Final file |
|---|---|---|
| Filename | modeM0/AS1SLEW_01234_9000000449_03324cztM0_level2.evt | modeM0/AS1SLEW_01234_9000000449_03324cztM0_level2_quad_clean.evt |
| Size (bytes) | 2,312,640 | 466,560 |
| Size | 2.2 MB | 455.6 KB |
| Events in quadrant A | 14,393 | 1,091 |
| Events in quadrant B | 14,006 | 1,167 |
| Events in quadrant C | 15,399 | 1,424 |
| Events in quadrant D | 22,064 | 818 |
| Mode SS | |||
|---|---|---|---|
| Quadrant | BADHDUFLAG | Total packets | Discarded packets |
| A | 0 | 2 | 0 |
| B | 0 | 2 | 0 |
| C | 0 | 2 | 0 |
| D | 0 | 2 | 0 |
| Mode M9 | |||
|---|---|---|---|
| Quadrant | BADHDUFLAG | Total packets | Discarded packets |
| A | 0 | 4 | 0 |
| B | 0 | 4 | 0 |
| C | 0 | 4 | 0 |
| D | 0 | 4 | 0 |
| Mode M0 | |||
|---|---|---|---|
| Quadrant | BADHDUFLAG | Total packets | Discarded packets |
| A | 0 | 55 | 0 |
| B | 0 | 53 | 0 |
| C | 0 | 58 | 0 |
| D | 0 | 74 | 0 |
| Quadrant | Total seconds | Saturated seconds | Saturation percentage |
|---|---|---|---|
| A | 15 | 15 | 100.000000% |
| B | 15 | 15 | 100.000000% |
| C | 15 | 15 | 100.000000% |
| D | 15 | 15 | 100.000000% |
Noise dominated data is calculated using 1-second bins in cleaned event files. If a bin has >2000 counts, and if more than 50% of those come from <1% of pixels, then it is considered to be noise-dominated and hence unusable.
| Quadrant | # 1 sec bins | Bins with >0 counts | Bins with >2000 counts | High rate bins dominated by noise | Noise dominated (total time) | Noise dominated (detector-on time) | Marked lightcurve |
|---|---|---|---|---|---|---|---|
| A | 15 | 15 | 0 | 0 | 0.00% | 0.00% | 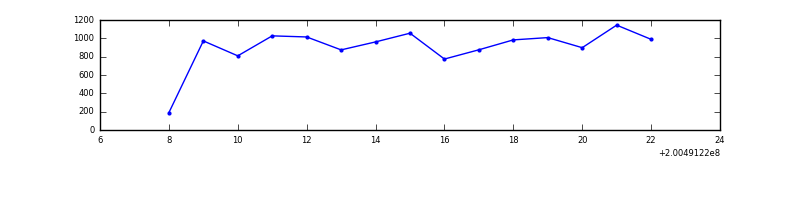 |
| B | 15 | 15 | 0 | 0 | 0.00% | 0.00% | 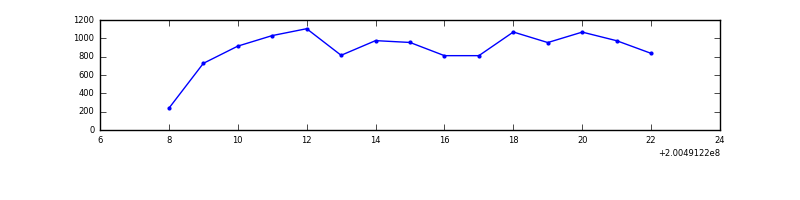 |
| C | 15 | 15 | 0 | 0 | 0.00% | 0.00% | 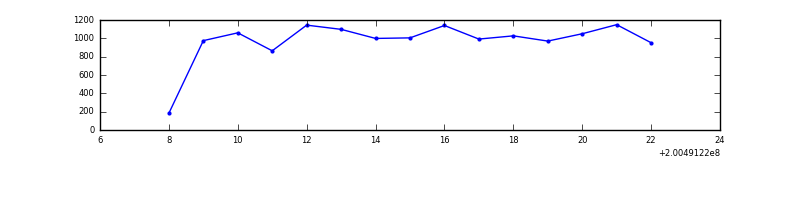 |
| D | 15 | 15 | 4 | 4 | 26.67% | 26.67% | 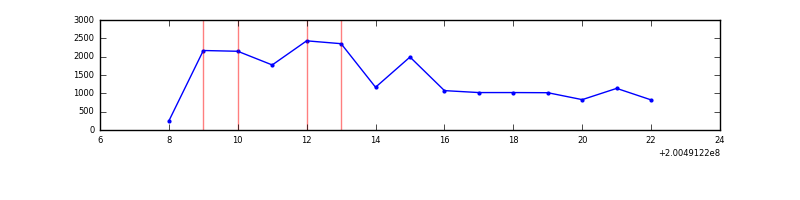 |
Top three noisy pixels from each quadrant. If the there are fewer than three noisy pixels in the level2.evt file, extra rows are filled as -1
| Pixel properties | Quadrant properties | ||||||
|---|---|---|---|---|---|---|---|
| Quadrant | DetID | PixID | Counts | Sigma | Mean | Median | Sigma |
| A | 12 | 194 | 36 | 16.86 | 3 | 3 | 2.0 |
| A | 0 | 226 | 29 | 13.29 | 3 | 3 | 2.0 |
| A | 3 | 11 | 15 | 6.13 | 3 | 3 | 2.0 |
| B | 15 | 204 | 280 | 149.09 | 3 | 3 | 1.9 |
| B | 12 | 111 | 85 | 44.14 | 3 | 3 | 1.9 |
| B | 11 | 111 | 51 | 25.84 | 3 | 3 | 1.9 |
| C | 14 | 223 | 149 | 68.82 | 3 | 3 | 2.1 |
| C | 6 | 80 | 106 | 48.55 | 3 | 3 | 2.1 |
| C | 13 | 61 | 32 | 13.67 | 3 | 3 | 2.1 |
| D | 13 | 223 | 11733 | 7655.95 | 2 | 2 | 1.5 |
| D | 7 | 46 | 136 | 87.45 | 2 | 2 | 1.5 |
| D | 2 | 206 | 29 | 17.62 | 2 | 2 | 1.5 |
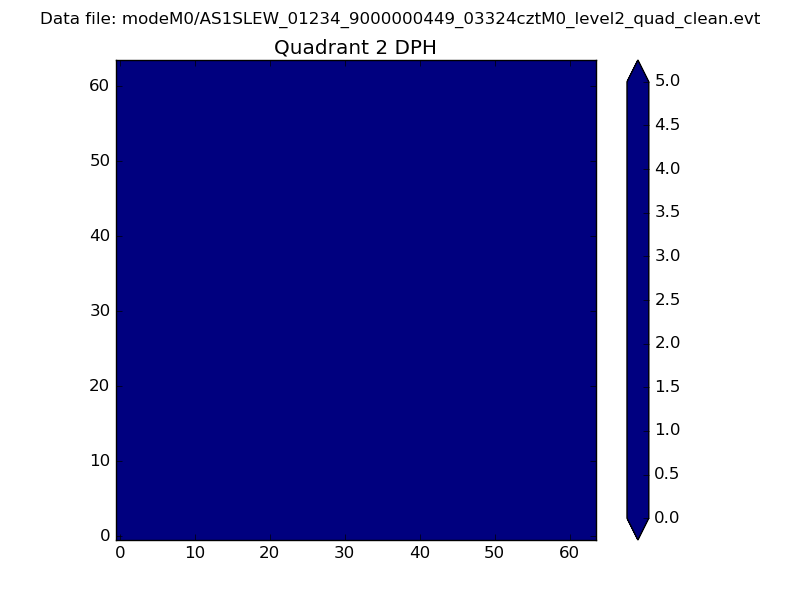
Histogram calculated using DETX and DETY for each event in the final _common_clean file
| Quadrant A |  |
 |
Quadrant B |
|---|---|---|---|
| Quadrant D | 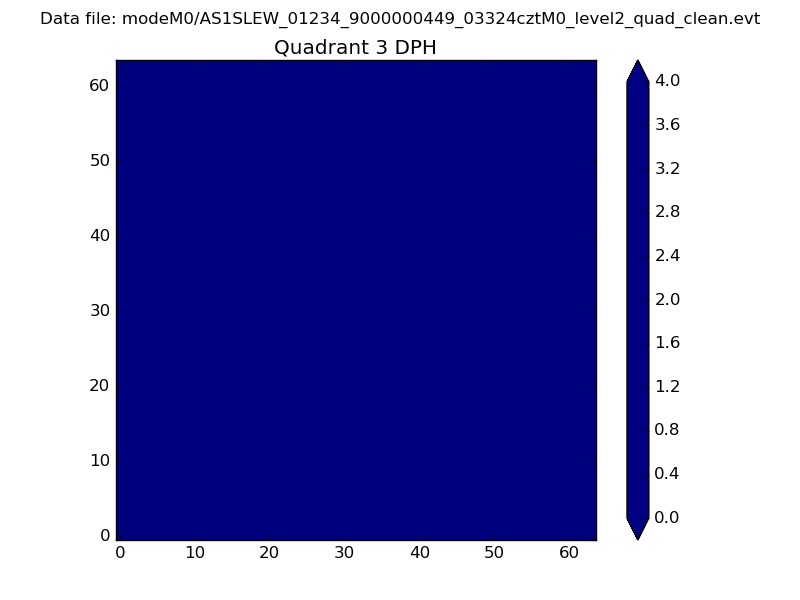 |
 |
Quadrant C |
| Plot type | Count rate plots | Images |
|---|---|---|
| Comparison with Poisson distribution Blue bars denote a histogram of data divided into 1 sec bins. Red curve is a Poisson curve with rate = median count rate of data. |
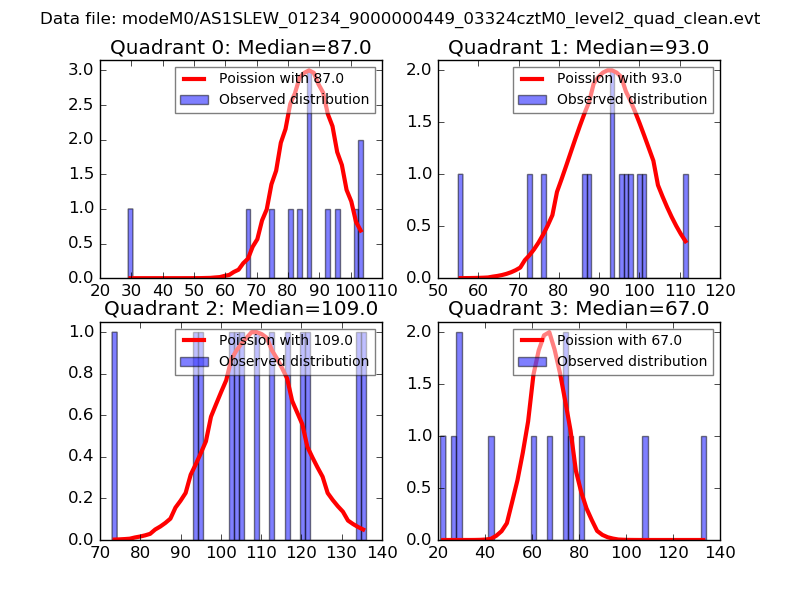 |
 |
| Quadrant-wise count rates Data is divided into 100 sec bins |
 |
|
| Module-wise count rates for Quadrant A Data is divided into 100 sec bins |
 |
 |
| Module-wise count rates for Quadrant B Data is divided into 100 sec bins |
 |
 |
| Module-wise count rates for Quadrant C Data is divided into 100 sec bins |
 |
 |
| Module-wise count rates for Quadrant D Data is divided into 100 sec bins |
 |
 |
| Parameter | Plot |
|---|---|
| CZT HV Monitor | 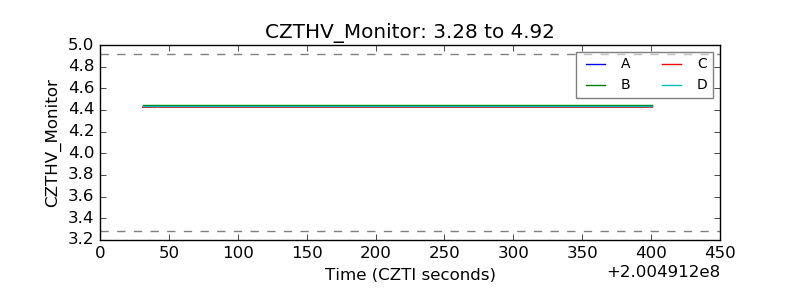 |
| D_VDD | 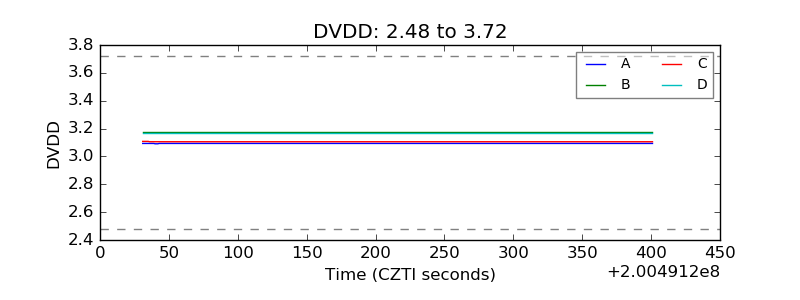 |
| Temperature 1 | 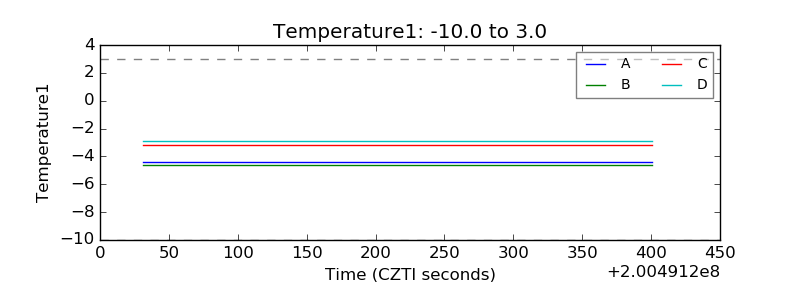 |
| Veto HV Monitor | 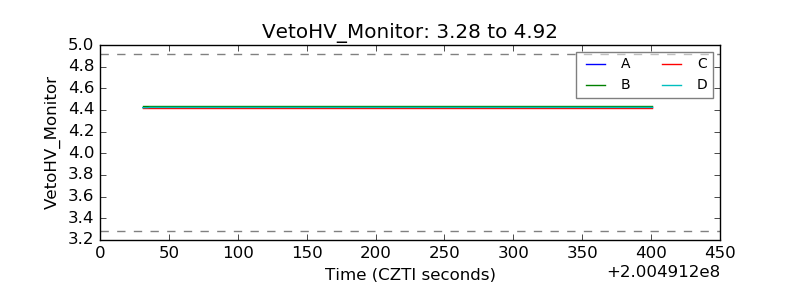 |
| Veto LLD | 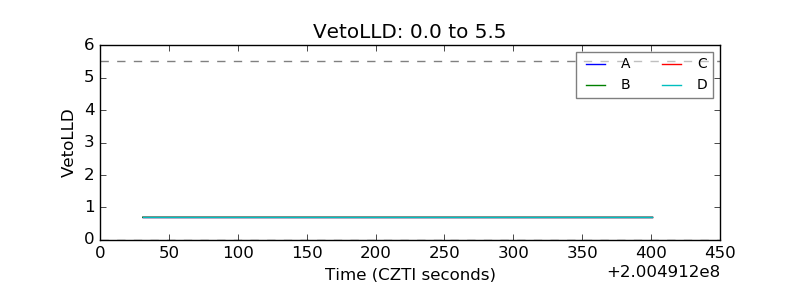 |
| Alpha Counter | 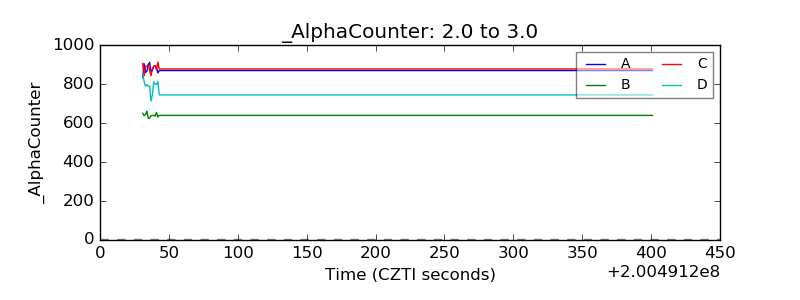 |
| _CPM_Rate | 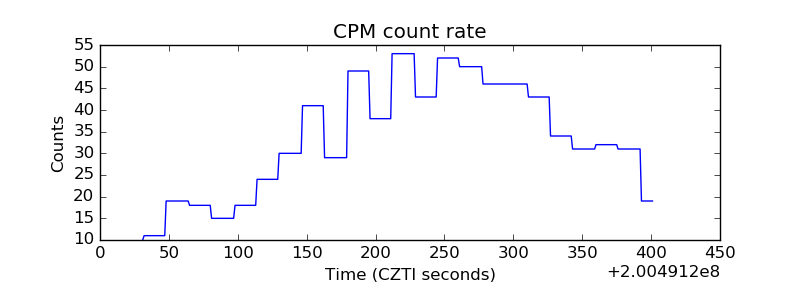 |
| CZT Counter | 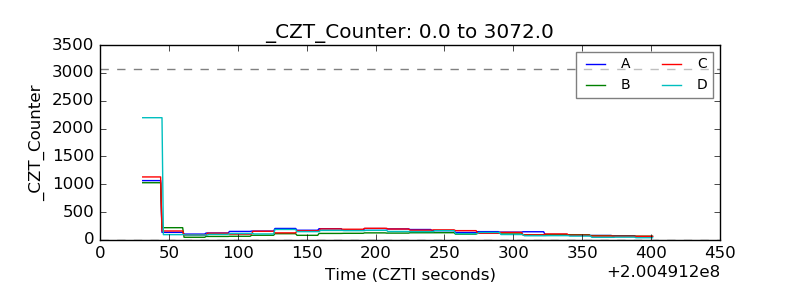 |
| +2.5 Volts monitor |  |
| +5 Volts monitor |  |
| Veto Counter | 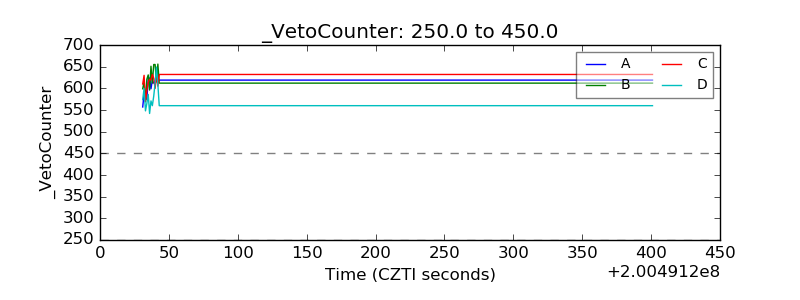 |