| Param | Original file | Final file |
|---|---|---|
| Filename | modeM0/AS1G05_218T03_9000000582_04661cztM0_level2.evt | modeM0/AS1G05_218T03_9000000582_04661cztM0_level2_quad_clean.evt |
| Size (bytes) | 13,731,840 | 2,640,960 |
| Size | 13.1 MB | 2.5 MB |
| Events in quadrant A | 71,452 | 16,449 |
| Events in quadrant B | 82,677 | 17,171 |
| Events in quadrant C | 72,235 | 16,454 |
| Events in quadrant D | 177,877 | 12,684 |
| Mode M9 | |||
|---|---|---|---|
| Quadrant | BADHDUFLAG | Total packets | Discarded packets |
| A | 0 | 8 | 0 |
| B | 0 | 8 | 0 |
| C | 0 | 8 | 0 |
| D | 0 | 9 | 0 |
| Mode SS | |||
|---|---|---|---|
| Quadrant | BADHDUFLAG | Total packets | Discarded packets |
| A | 0 | 2 | 0 |
| B | 0 | 2 | 0 |
| C | 0 | 2 | 0 |
| D | 0 | 2 | 0 |
| Mode M0 | |||
|---|---|---|---|
| Quadrant | BADHDUFLAG | Total packets | Discarded packets |
| A | 0 | 294 | 1 |
| B | 0 | 339 | 1 |
| C | 0 | 306 | 1 |
| D | 0 | 612 | 1 |
| Quadrant | Total seconds | Saturated seconds | Saturation percentage |
|---|---|---|---|
| A | 117 | 1 | 0.854701% |
| B | 117 | 2 | 1.709402% |
| C | 117 | 4 | 3.418803% |
| D | 117 | 45 | 38.461538% |
Noise dominated data is calculated using 1-second bins in cleaned event files. If a bin has >2000 counts, and if more than 50% of those come from <1% of pixels, then it is considered to be noise-dominated and hence unusable.
| Quadrant | # 1 sec bins | Bins with >0 counts | Bins with >2000 counts | High rate bins dominated by noise | Noise dominated (total time) | Noise dominated (detector-on time) | Marked lightcurve |
|---|---|---|---|---|---|---|---|
| A | 117 | 117 | 0 | 0 | 0.00% | 0.00% | 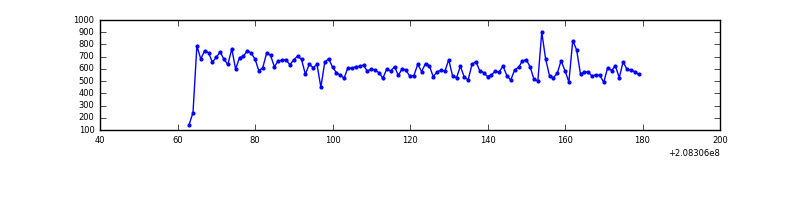 |
| B | 117 | 117 | 0 | 0 | 0.00% | 0.00% | 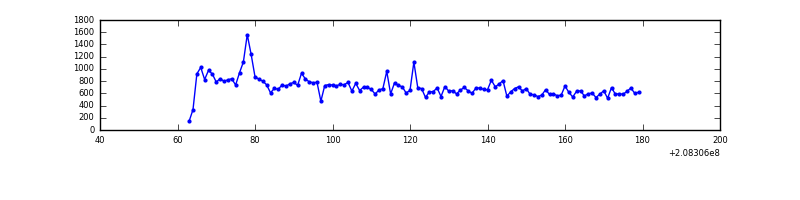 |
| C | 117 | 117 | 0 | 0 | 0.00% | 0.00% | 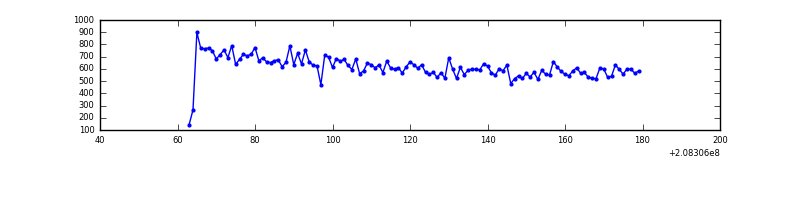 |
| D | 117 | 117 | 31 | 31 | 26.50% | 26.50% | 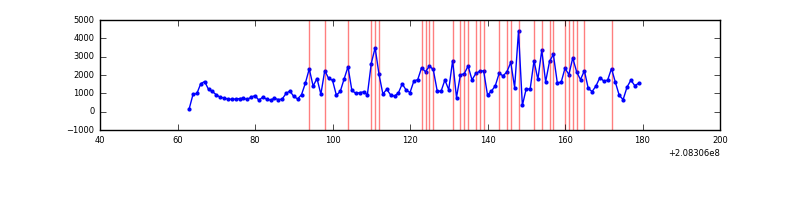 |
Top three noisy pixels from each quadrant. If the there are fewer than three noisy pixels in the level2.evt file, extra rows are filled as -1
| Pixel properties | Quadrant properties | ||||||
|---|---|---|---|---|---|---|---|
| Quadrant | DetID | PixID | Counts | Sigma | Mean | Median | Sigma |
| A | 7 | 16 | 1638 | 291.51 | 17 | 17 | 5.6 |
| A | 13 | 14 | 391 | 67.26 | 17 | 17 | 5.6 |
| A | 12 | 194 | 197 | 32.37 | 17 | 17 | 5.6 |
| B | 4 | 80 | 6730 | 1180.82 | 18 | 18 | 5.7 |
| B | 14 | 167 | 1227 | 212.69 | 18 | 18 | 5.7 |
| B | 4 | 172 | 880 | 151.65 | 18 | 18 | 5.7 |
| C | 7 | 223 | 566 | 91.07 | 18 | 18 | 6.0 |
| C | 7 | 254 | 151 | 22.1 | 18 | 18 | 6.0 |
| C | 13 | 61 | 138 | 19.94 | 18 | 18 | 6.0 |
| D | 13 | 235 | 106348 | 18938.68 | 15 | 15 | 5.6 |
| D | 10 | 15 | 5025 | 892.32 | 15 | 15 | 5.6 |
| D | 2 | 234 | 4053 | 719.2 | 15 | 15 | 5.6 |
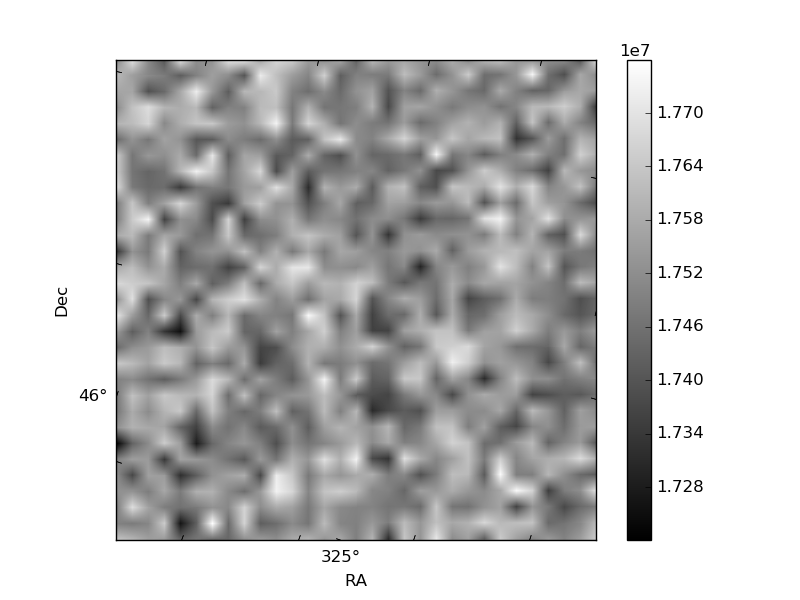
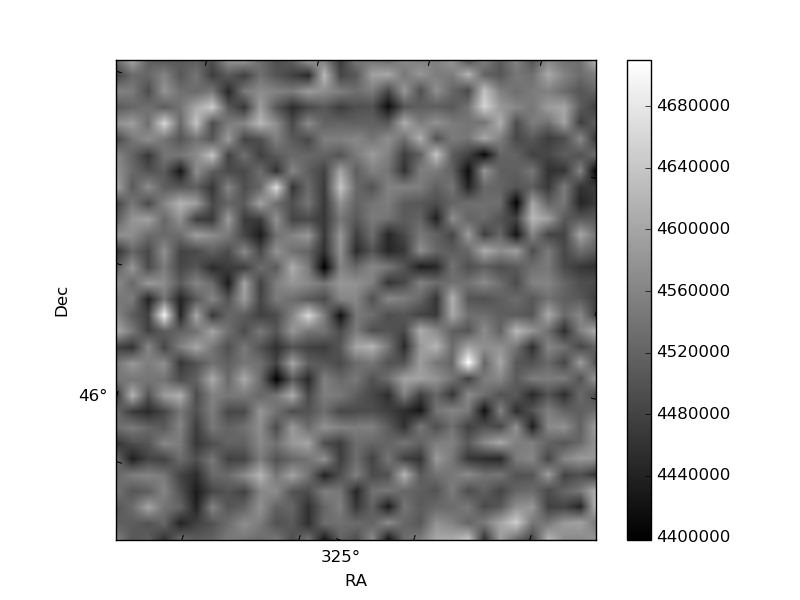
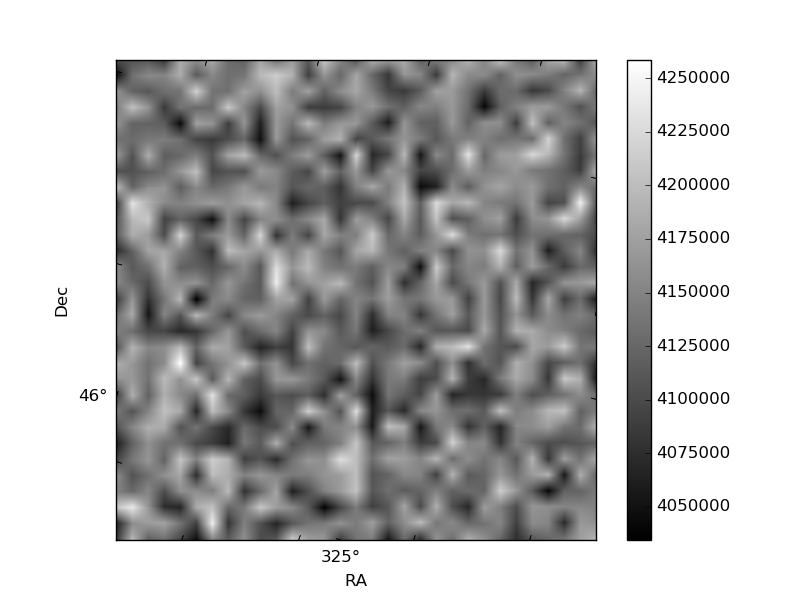
Histogram calculated using DETX and DETY for each event in the final _common_clean file
| Quadrant A | 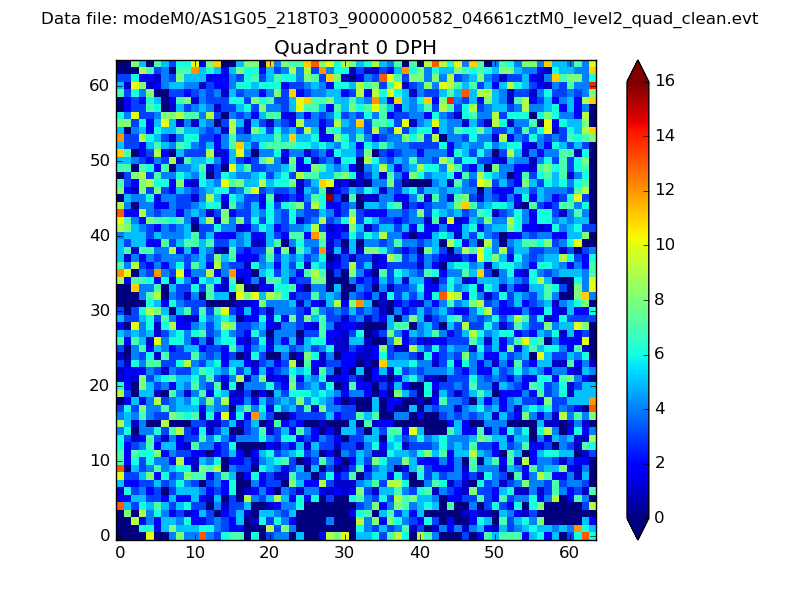 |
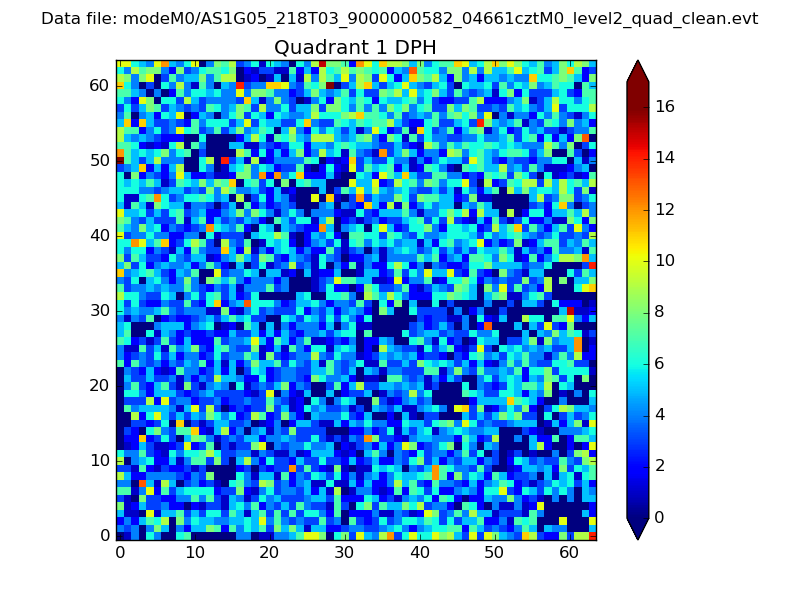 |
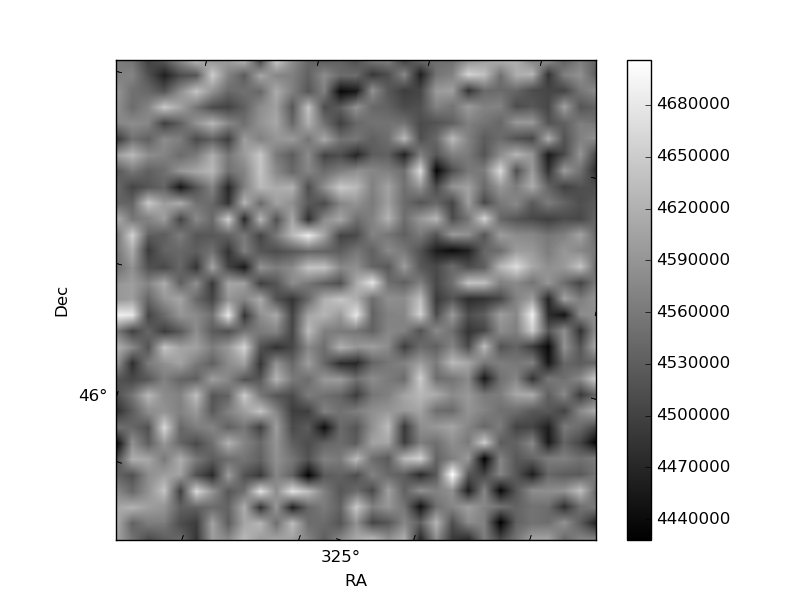
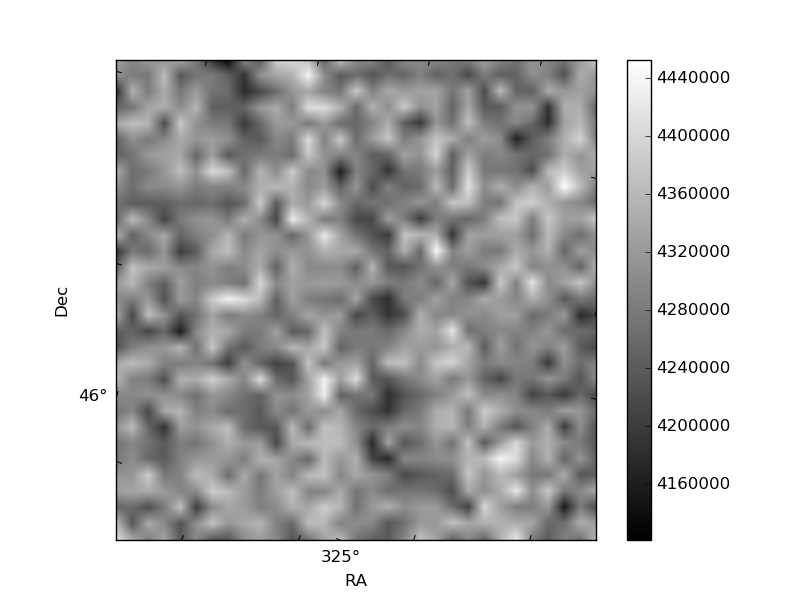
Quadrant B |
|---|---|---|---|
| Quadrant D | 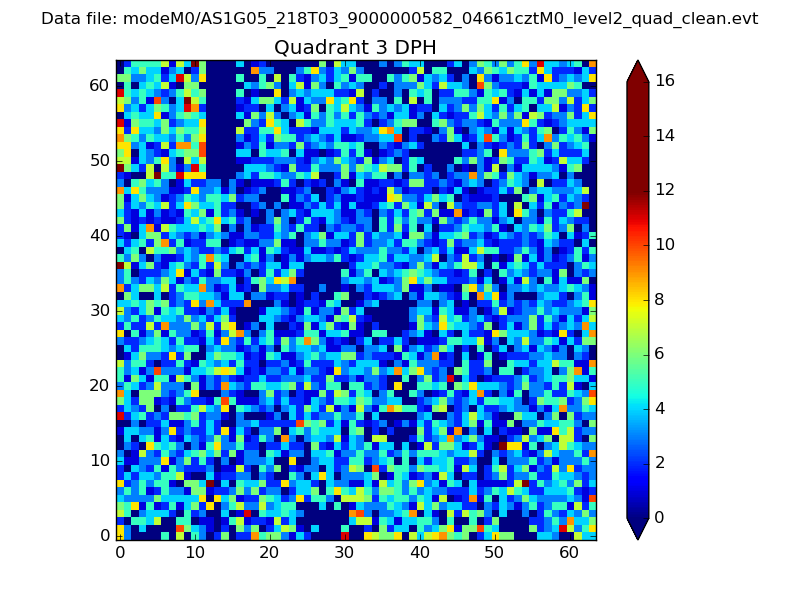 |
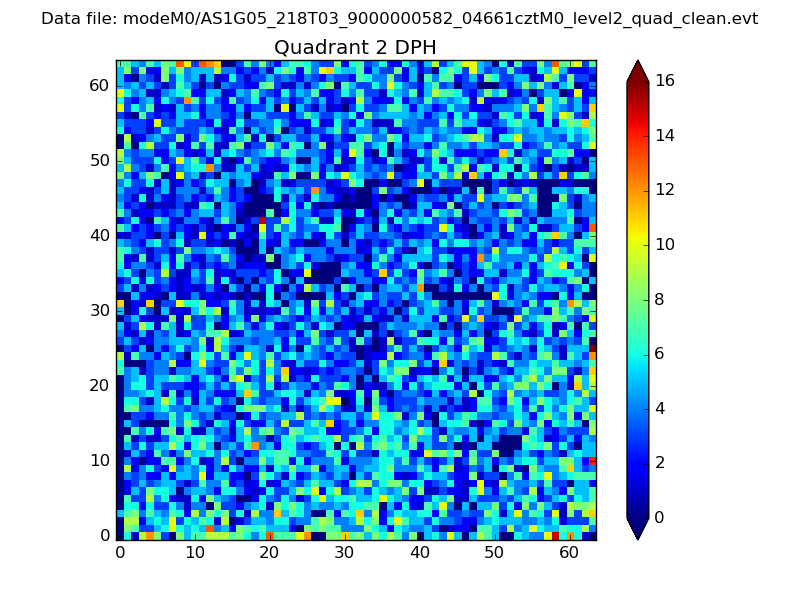 |
Quadrant C |
| Plot type | Count rate plots | Images |
|---|---|---|
| Comparison with Poisson distribution Blue bars denote a histogram of data divided into 1 sec bins. Red curve is a Poisson curve with rate = median count rate of data. |
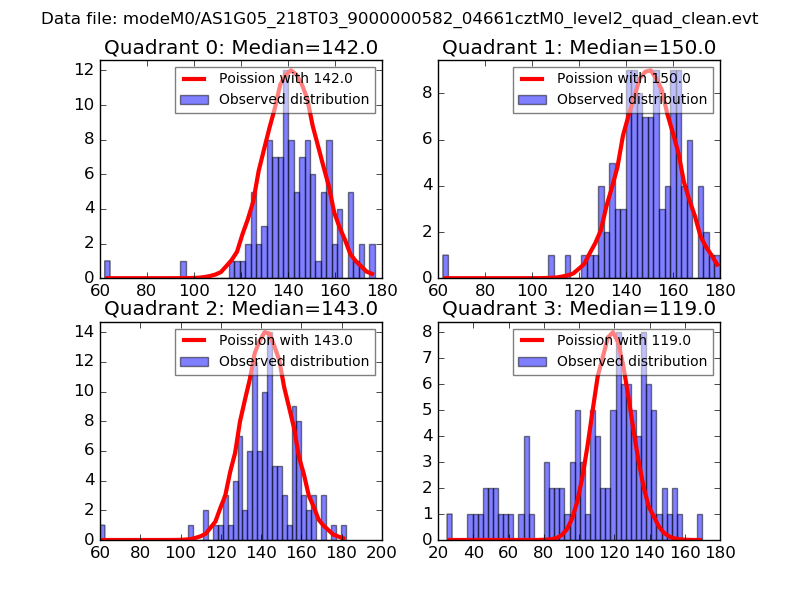 |
 |
| Quadrant-wise count rates Data is divided into 100 sec bins |
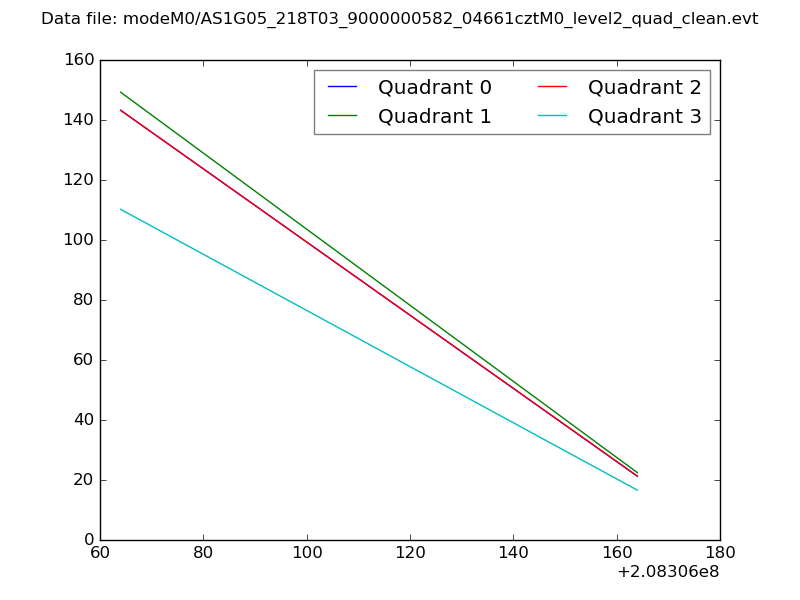 |
|
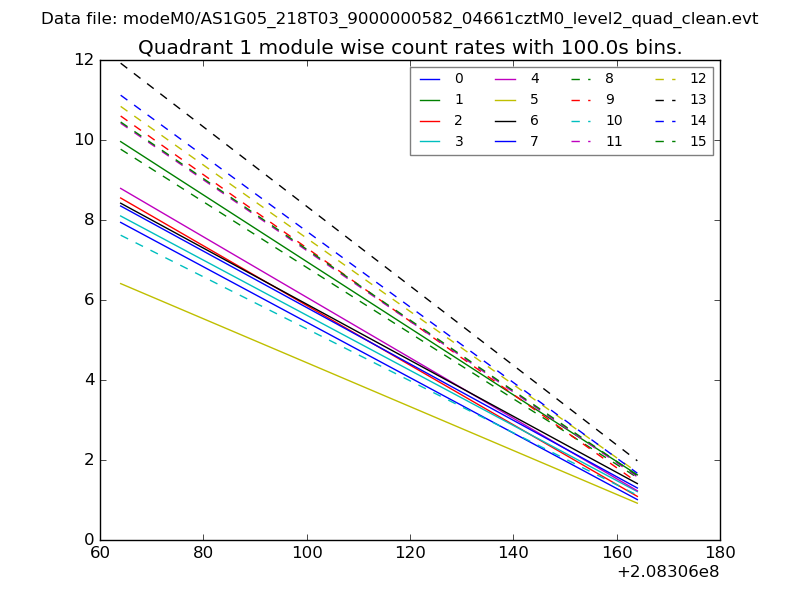
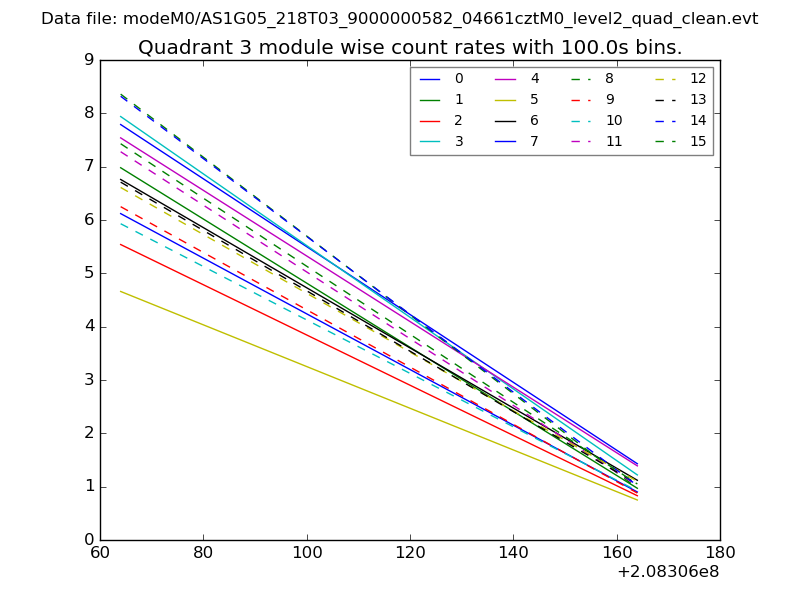
| Module-wise count rates for Quadrant A Data is divided into 100 sec bins |
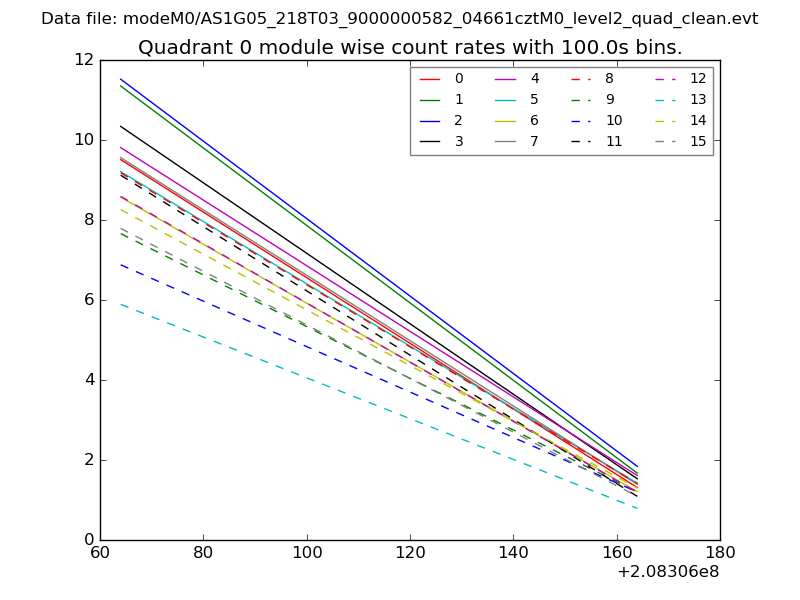 |
 |
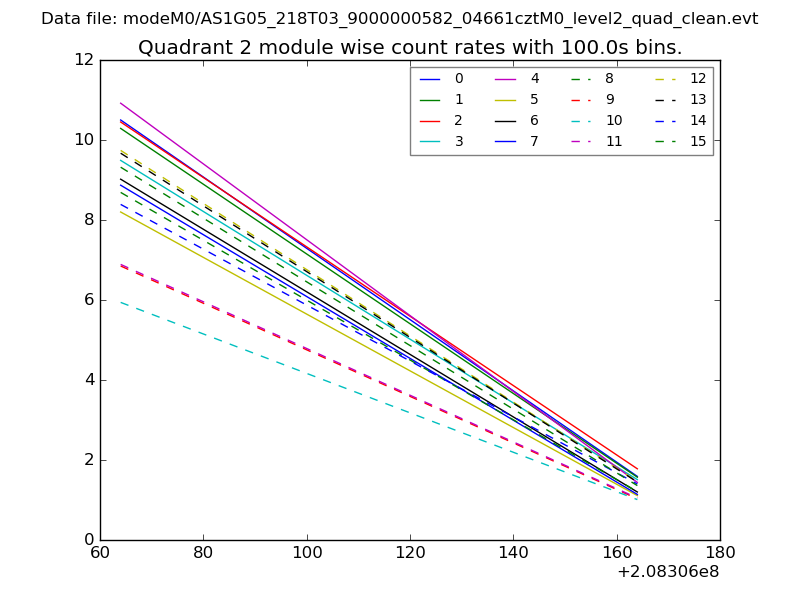
| Module-wise count rates for Quadrant B Data is divided into 100 sec bins |
 |
 |
| Module-wise count rates for Quadrant C Data is divided into 100 sec bins |
 |
 |
| Module-wise count rates for Quadrant D Data is divided into 100 sec bins |
 |
 |
| Parameter | Plot |
|---|---|
| CZT HV Monitor | 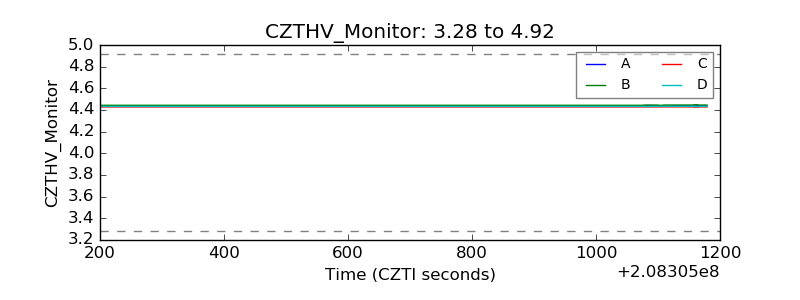 |
| D_VDD | 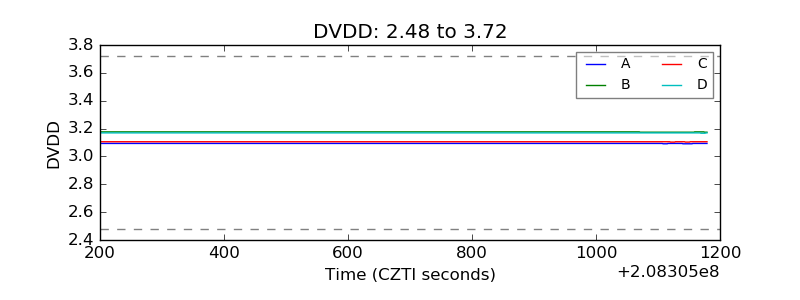 |
| Temperature 1 | 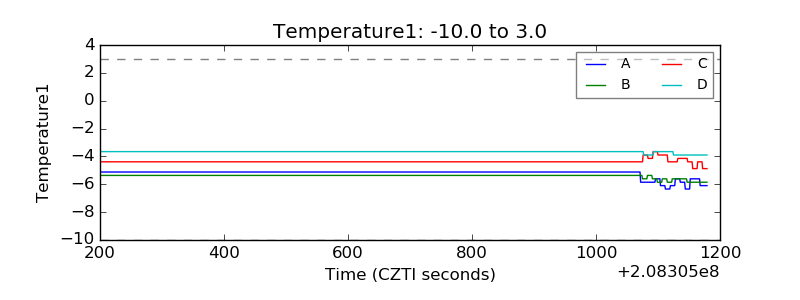 |
| Veto HV Monitor | 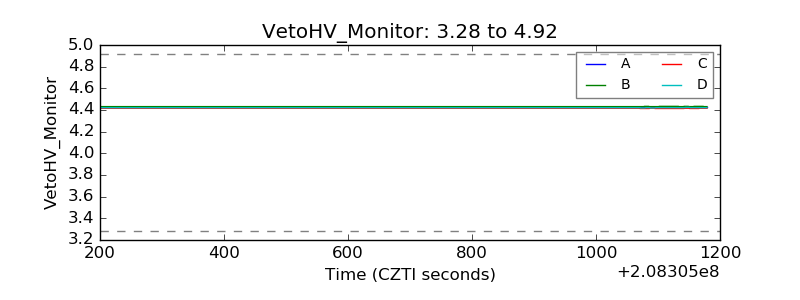 |
| Veto LLD | 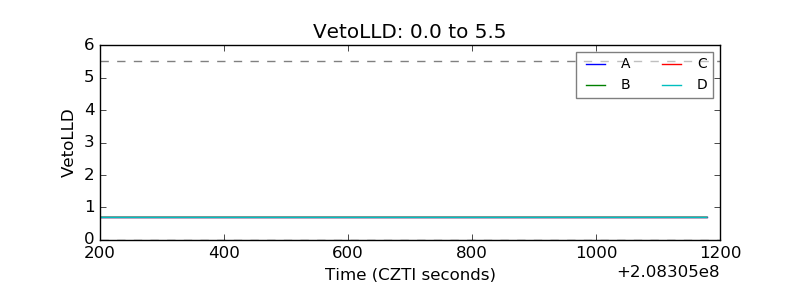 |
| Alpha Counter | 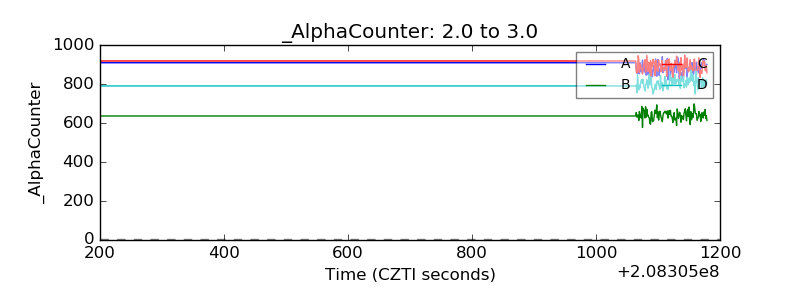 |
| _CPM_Rate | 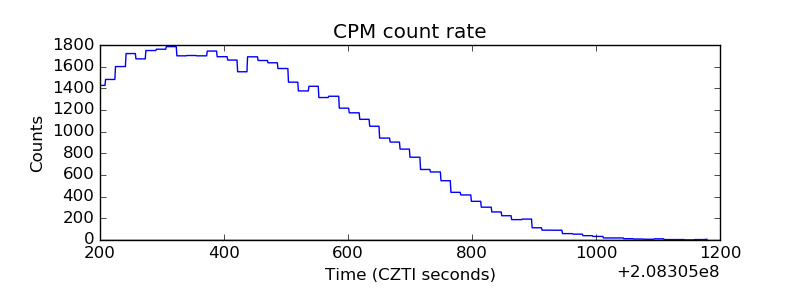 |
| CZT Counter | 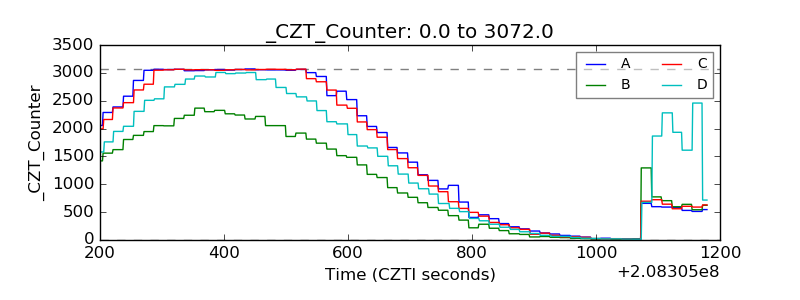 |
| +2.5 Volts monitor |  |
| +5 Volts monitor |  |
| _ROLL_ROT | 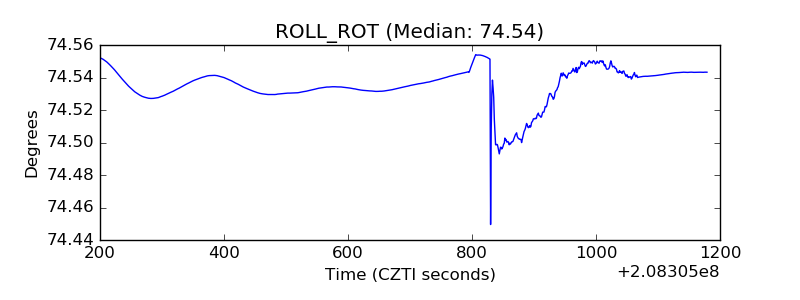 |
| _Roll_DEC | 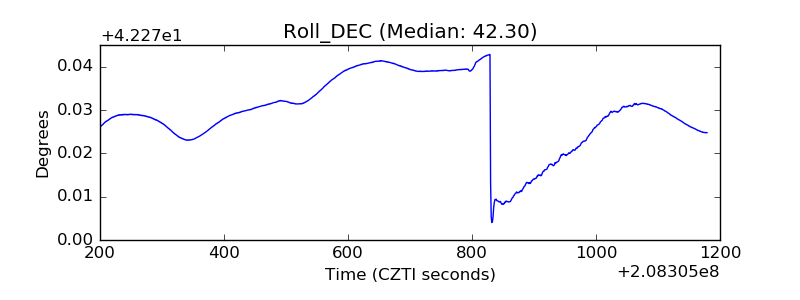 |
| _Roll_RA | 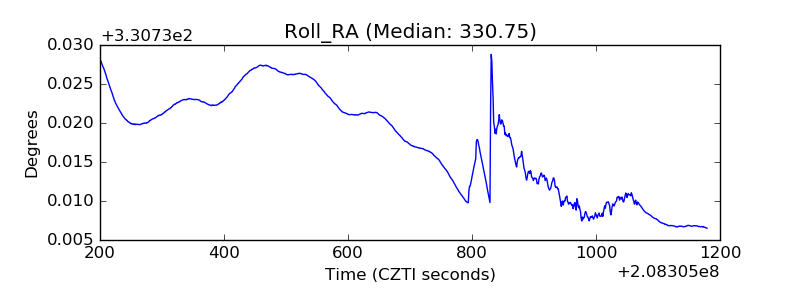 |
| Veto Counter | 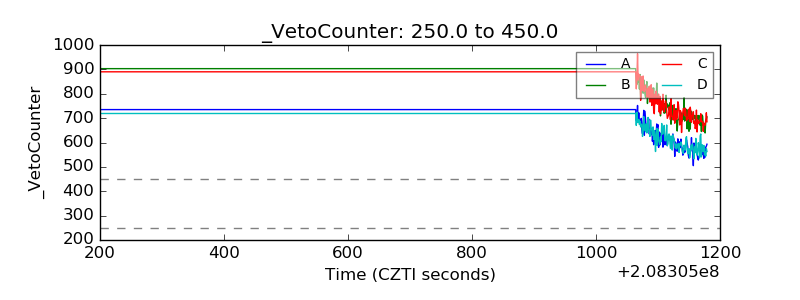 |