| Param | Original file | Final file |
|---|---|---|
| Filename | modeM0/AS1G05_212T01_9000000600_04767cztM0_level2.evt | modeM0/AS1G05_212T01_9000000600_04767cztM0_level2_quad_clean.evt |
| Size (bytes) | 415,621,440 | 65,295,360 |
| Size | 396.4 MB | 62.3 MB |
| Events in quadrant A | 2,408,108 | 404,587 |
| Events in quadrant B | 2,959,433 | 404,722 |
| Events in quadrant C | 3,567,384 | 394,190 |
| Events in quadrant D | 3,273,971 | 384,360 |
| Mode M0 | |||
|---|---|---|---|
| Quadrant | BADHDUFLAG | Total packets | Discarded packets |
| A | 0 | 11272 | 26 |
| B | 0 | 12553 | 40 |
| C | 0 | 14575 | 62 |
| D | 0 | 13907 | 52 |
| Mode M9 | |||
|---|---|---|---|
| Quadrant | BADHDUFLAG | Total packets | Discarded packets |
| A | 0 | 1 | 0 |
| B | 0 | 1 | 0 |
| C | 0 | 1 | 0 |
| D | 0 | 1 | 0 |
| Mode SS | |||
|---|---|---|---|
| Quadrant | BADHDUFLAG | Total packets | Discarded packets |
| A | 0 | 114 | 0 |
| B | 0 | 114 | 0 |
| C | 0 | 114 | 0 |
| D | 0 | 114 | 0 |
| Quadrant | Total seconds | Saturated seconds | Saturation percentage |
|---|---|---|---|
| A | 5560 | 26 | 0.467626% |
| B | 5557 | 56 | 1.007738% |
| C | 5554 | 247 | 4.447245% |
| D | 5555 | 271 | 4.878488% |
Noise dominated data is calculated using 1-second bins in cleaned event files. If a bin has >2000 counts, and if more than 50% of those come from <1% of pixels, then it is considered to be noise-dominated and hence unusable.
| Quadrant | # 1 sec bins | Bins with >0 counts | Bins with >2000 counts | High rate bins dominated by noise | Noise dominated (total time) | Noise dominated (detector-on time) | Marked lightcurve |
|---|---|---|---|---|---|---|---|
| A | 5573 | 5573 | 0 | 0 | 0.00% | 0.00% | 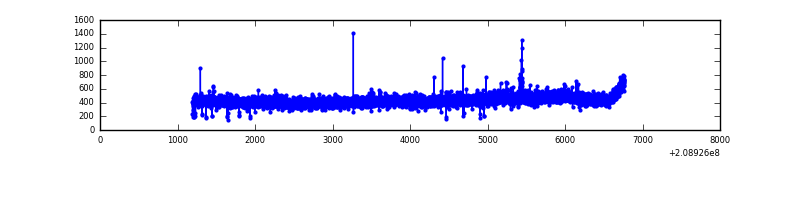 |
| B | 5573 | 5573 | 28 | 28 | 0.50% | 0.50% | 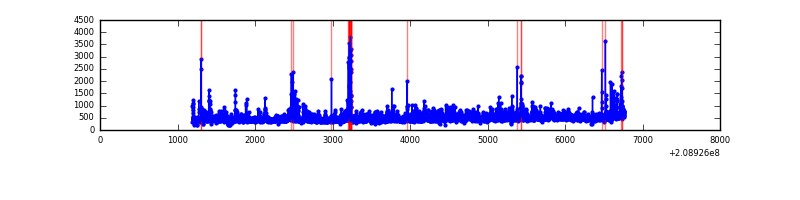 |
| C | 5573 | 5573 | 190 | 190 | 3.41% | 3.41% | 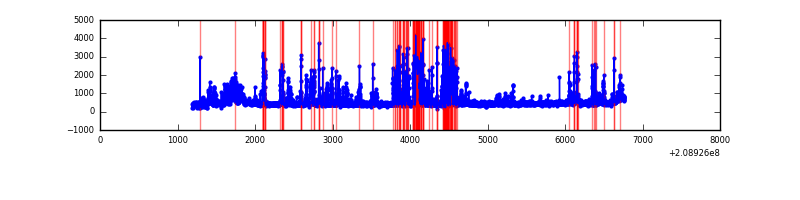 |
| D | 5573 | 5572 | 184 | 184 | 3.30% | 3.30% | 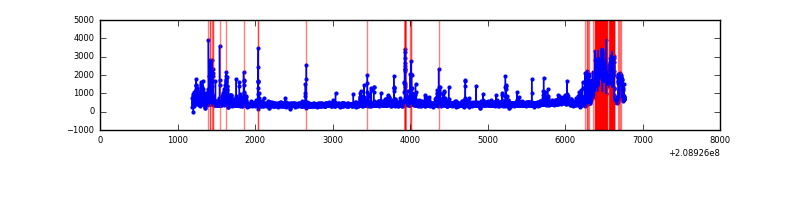 |
Top three noisy pixels from each quadrant. If the there are fewer than three noisy pixels in the level2.evt file, extra rows are filled as -1
| Pixel properties | Quadrant properties | ||||||
|---|---|---|---|---|---|---|---|
| Quadrant | DetID | PixID | Counts | Sigma | Mean | Median | Sigma |
| A | 8 | 15 | 28281 | 218.23 | 614 | 599 | 126.8 |
| A | 0 | 149 | 10680 | 79.47 | 614 | 599 | 126.8 |
| A | 0 | 226 | 6879 | 49.51 | 614 | 599 | 126.8 |
| B | 4 | 80 | 212173 | 1773.83 | 619 | 602 | 119.3 |
| B | 14 | 167 | 207514 | 1734.77 | 619 | 602 | 119.3 |
| B | 15 | 204 | 110668 | 922.8 | 619 | 602 | 119.3 |
| C | 14 | 48 | 1257528 | 9111.39 | 588 | 589 | 138.0 |
| C | 1 | 16 | 8310 | 55.97 | 588 | 589 | 138.0 |
| C | 12 | 4 | 5855 | 38.17 | 588 | 589 | 138.0 |
| D | 13 | 235 | 801797 | 5590.19 | 589 | 570 | 143.3 |
| D | 2 | 136 | 91002 | 630.95 | 589 | 570 | 143.3 |
| D | 11 | 132 | 54276 | 374.71 | 589 | 570 | 143.3 |
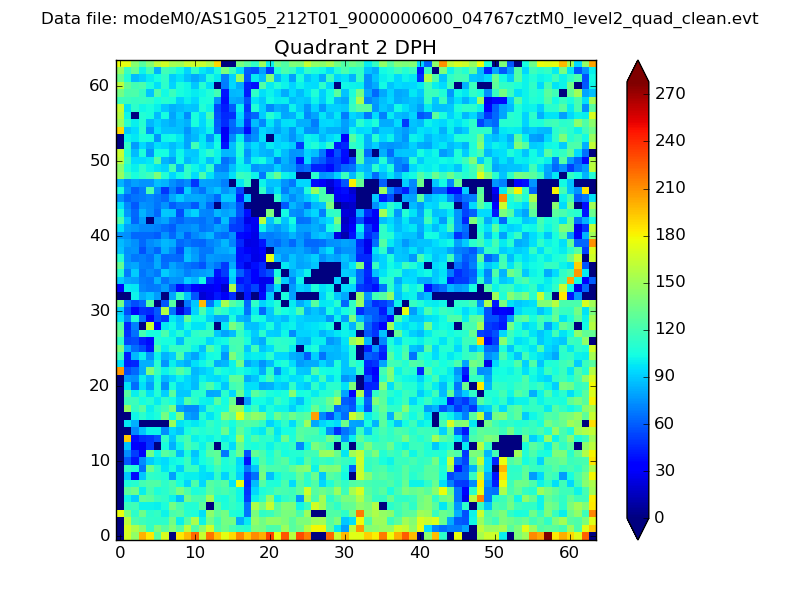
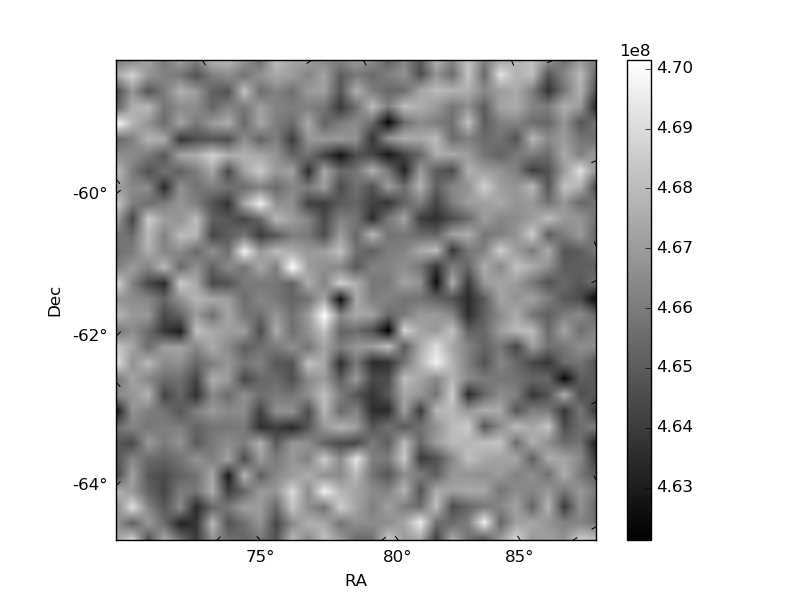
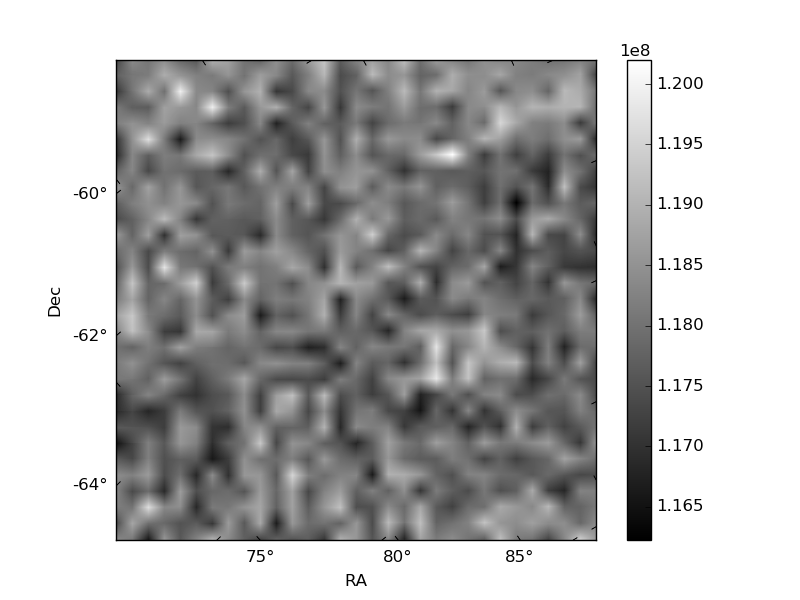
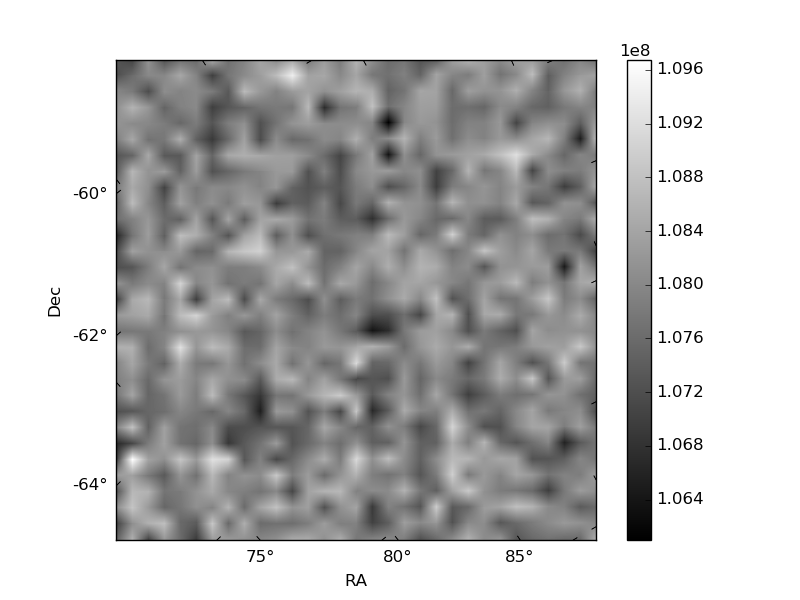
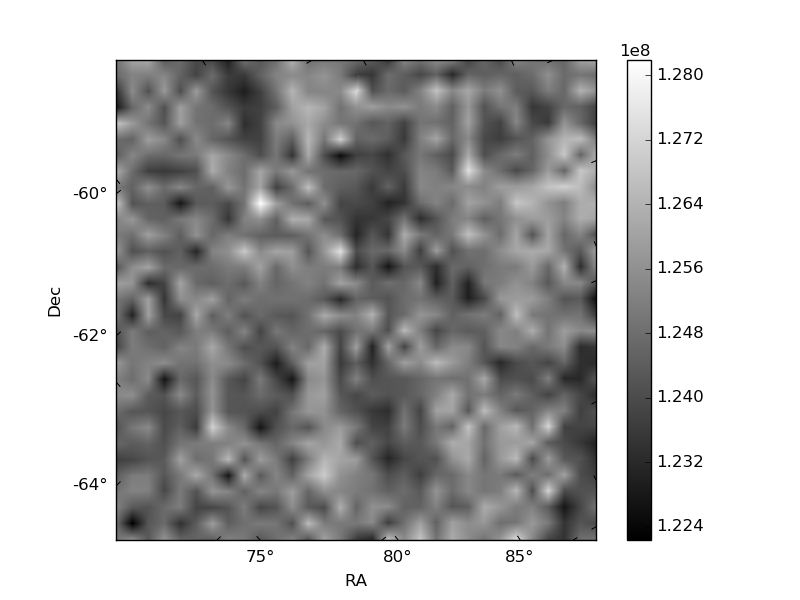
Histogram calculated using DETX and DETY for each event in the final _common_clean file
| Quadrant A | 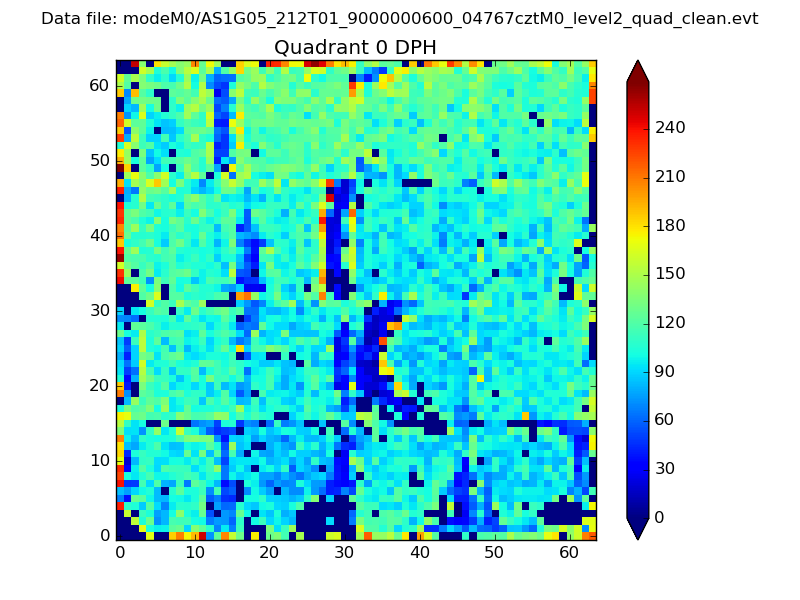 |
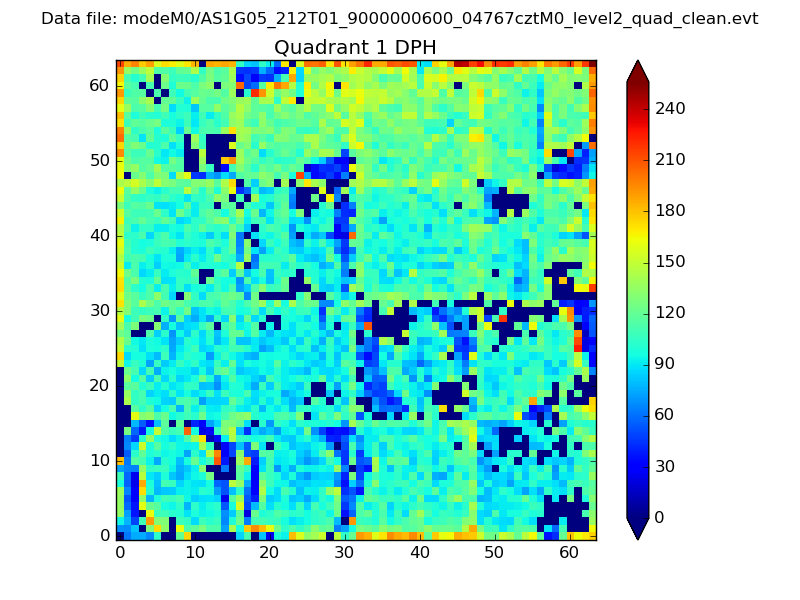 |
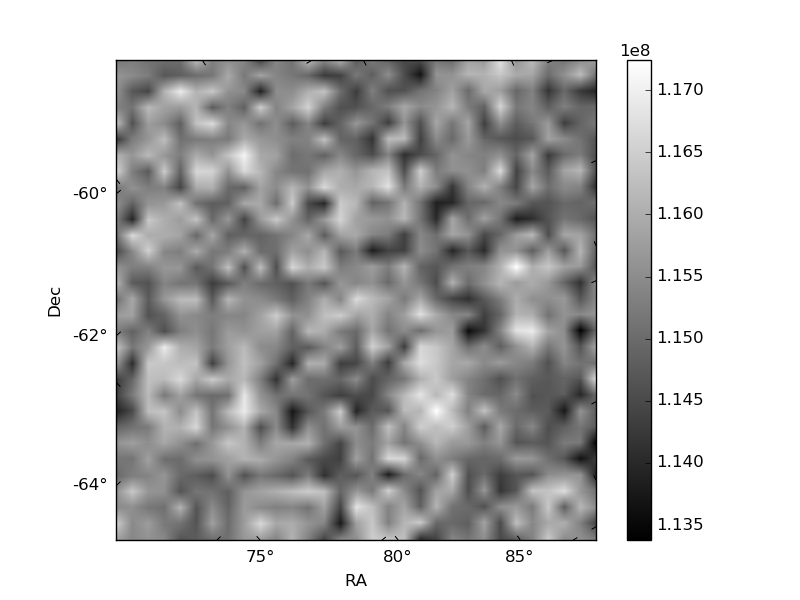
Quadrant B |
|---|---|---|---|
| Quadrant D | 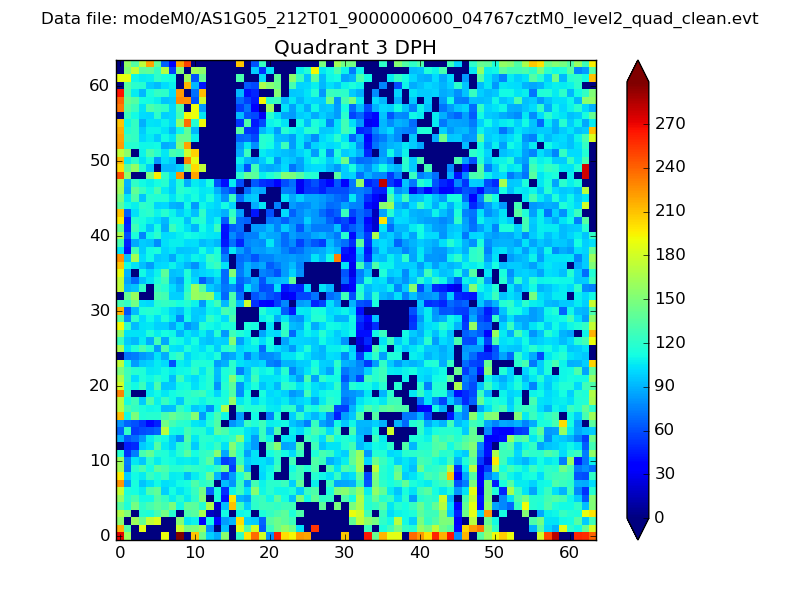 |
 |
Quadrant C |
| Plot type | Count rate plots | Images |
|---|---|---|
| Comparison with Poisson distribution Blue bars denote a histogram of data divided into 1 sec bins. Red curve is a Poisson curve with rate = median count rate of data. |
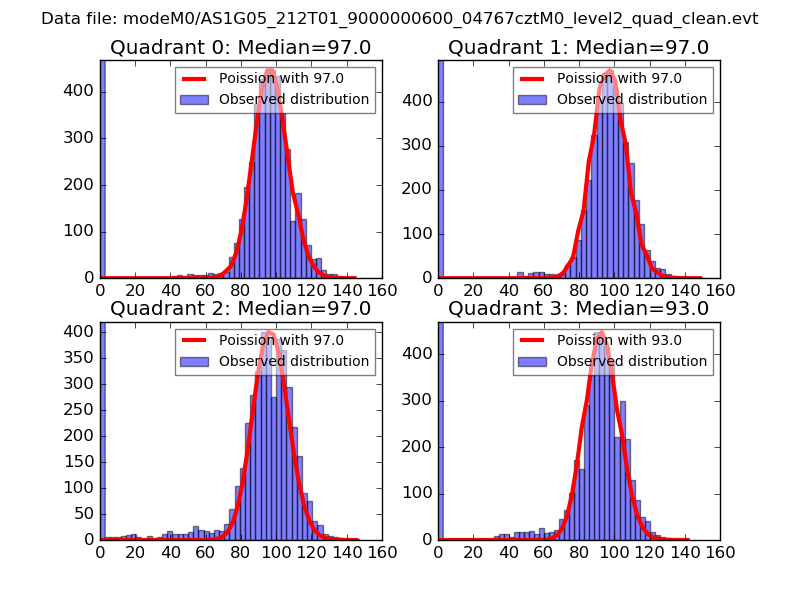 |
 |
| Quadrant-wise count rates Data is divided into 100 sec bins |
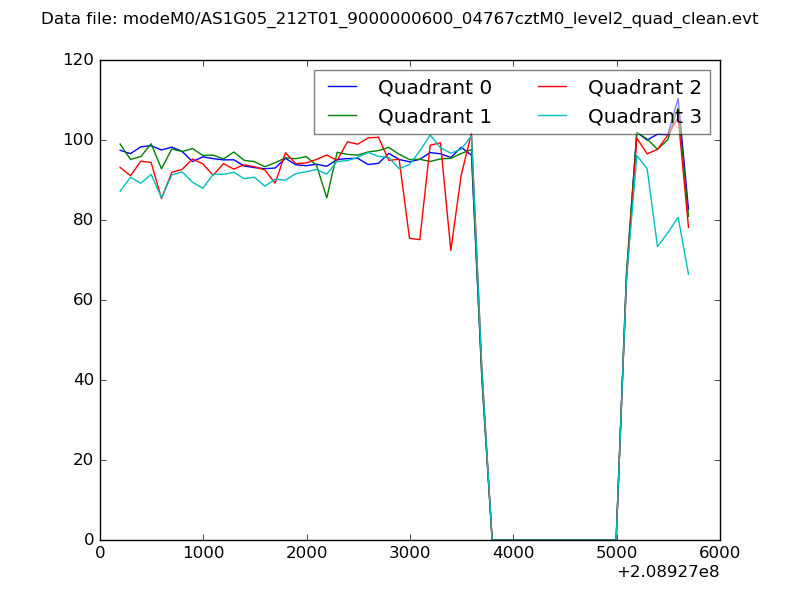 |
|
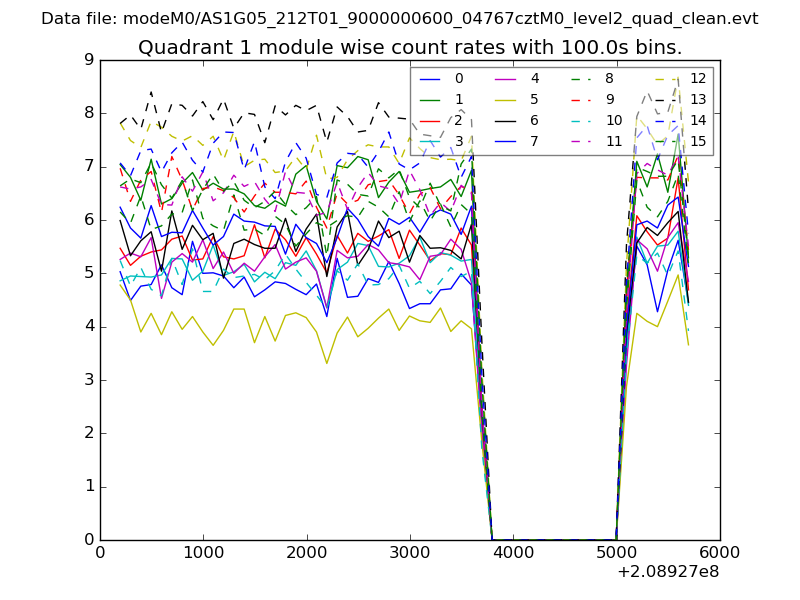
| Module-wise count rates for Quadrant A Data is divided into 100 sec bins |
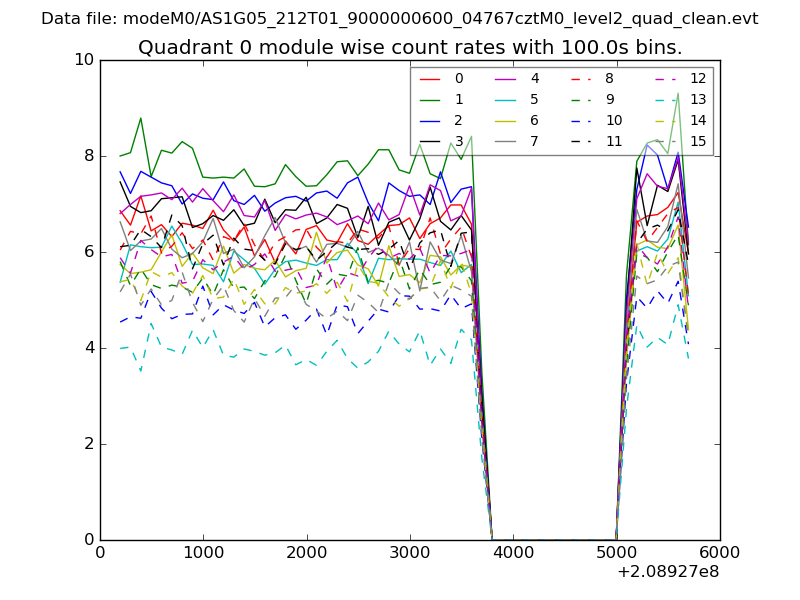 |
 |
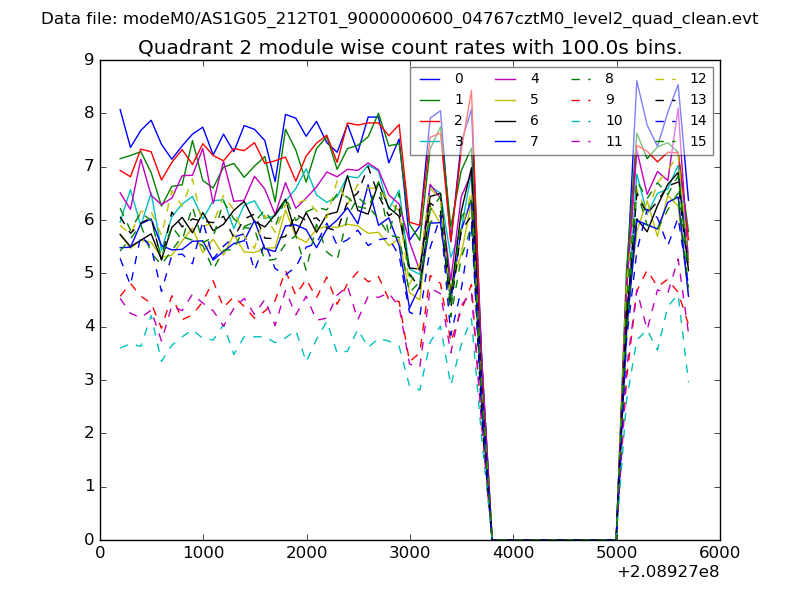
| Module-wise count rates for Quadrant B Data is divided into 100 sec bins |
 |
 |
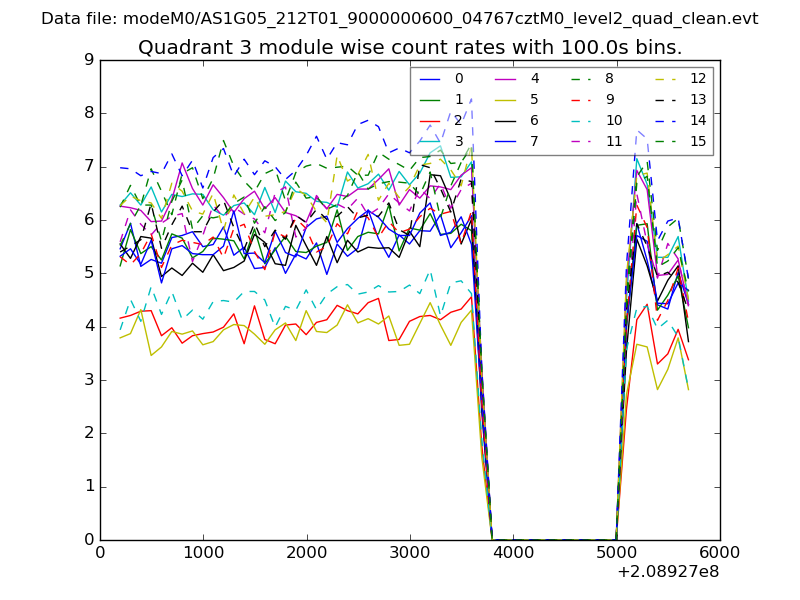
| Module-wise count rates for Quadrant C Data is divided into 100 sec bins |
 |
 |
| Module-wise count rates for Quadrant D Data is divided into 100 sec bins |
 |
 |
| Parameter | Plot |
|---|---|
| CZT HV Monitor | 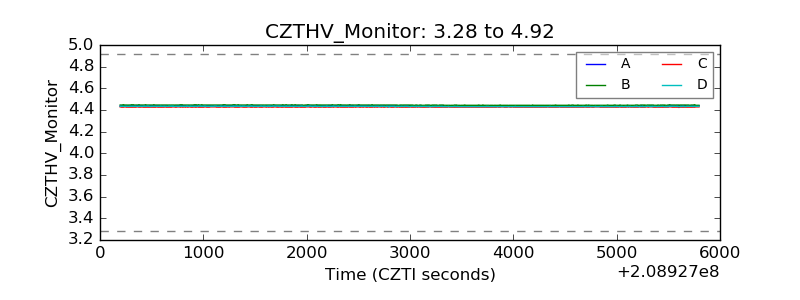 |
| D_VDD | 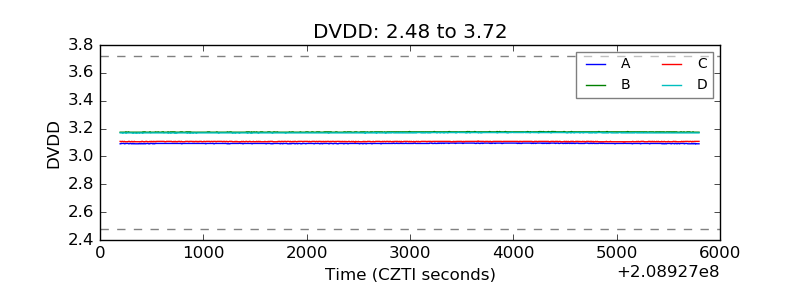 |
| Temperature 1 |  |
| Veto HV Monitor | 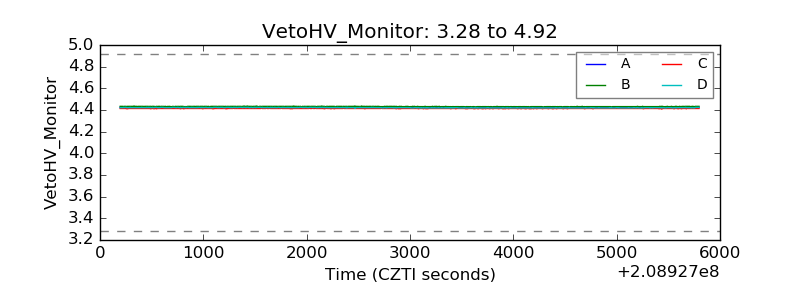 |
| Veto LLD | 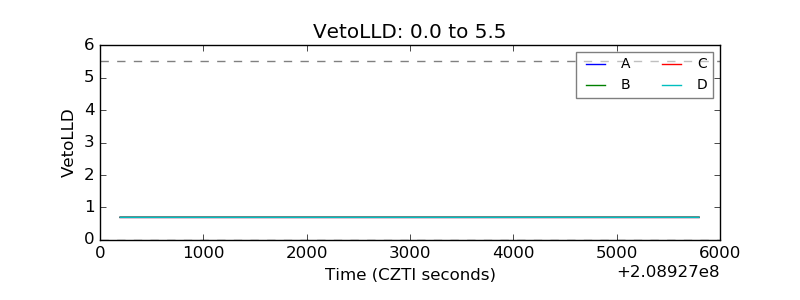 |
| Alpha Counter | 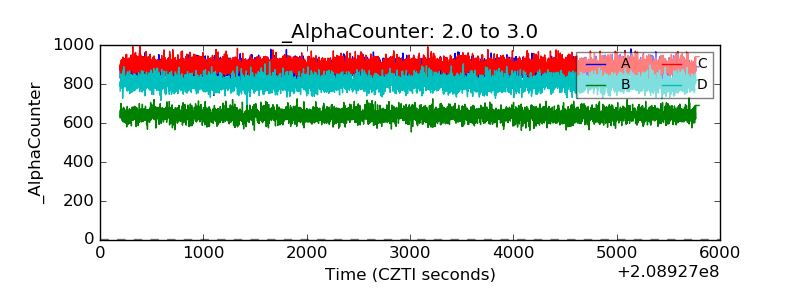 |
| _CPM_Rate | 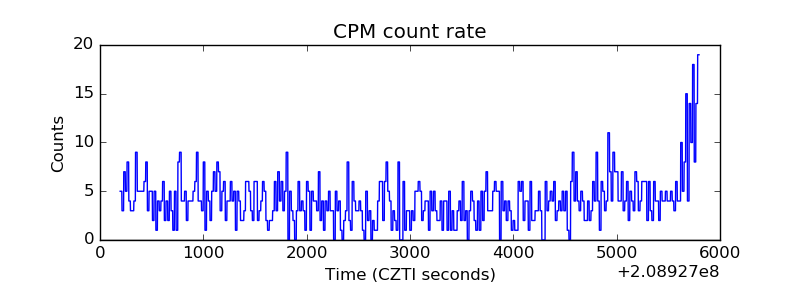 |
| CZT Counter | 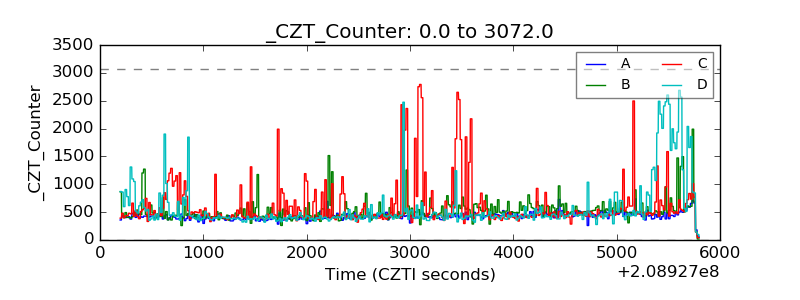 |
| +2.5 Volts monitor |  |
| +5 Volts monitor | 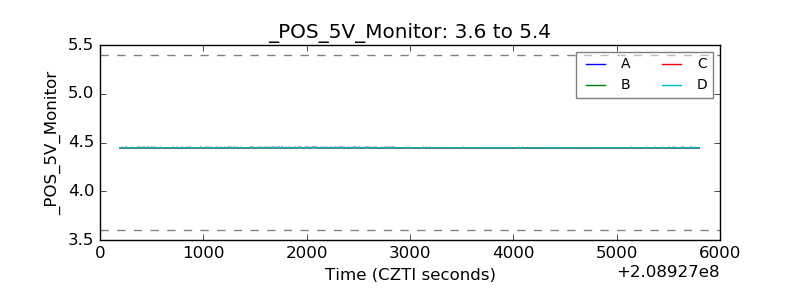 |
| _ROLL_ROT | 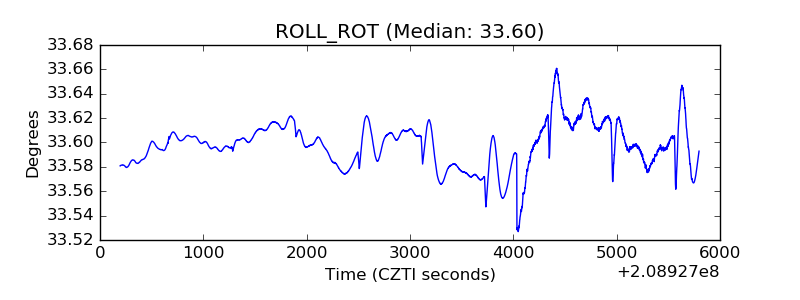 |
| _Roll_DEC | 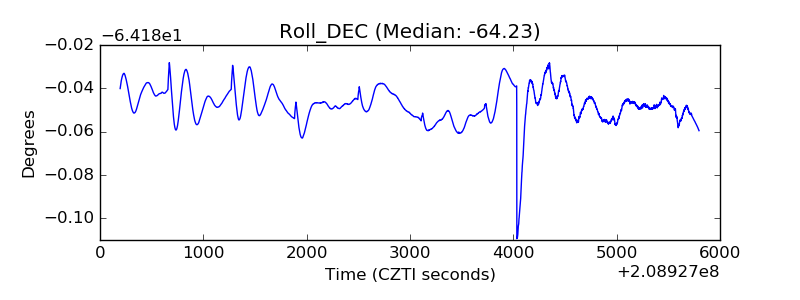 |
| _Roll_RA | 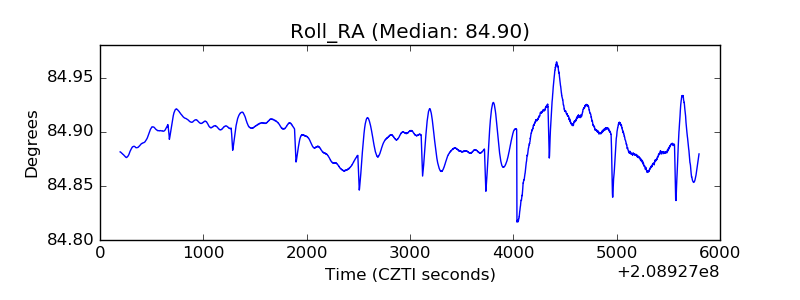 |
| Veto Counter | 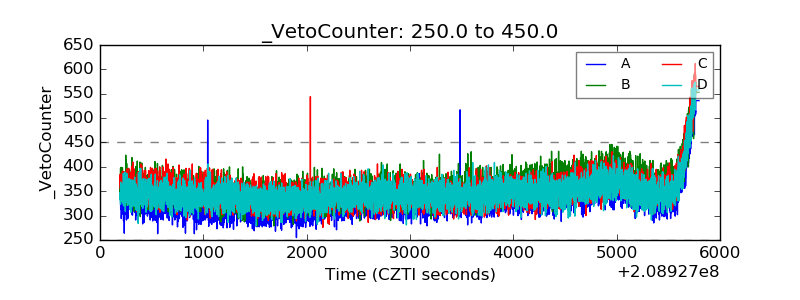 |