| Param | Original file | Final file |
|---|---|---|
| Filename | modeM0/AS1SLEW_01234_9000000603_04781cztM0_level2.evt | modeM0/AS1SLEW_01234_9000000603_04781cztM0_level2_quad_clean.evt |
| Size (bytes) | 40,340,160 | 1,431,360 |
| Size | 38.5 MB | 1.4 MB |
| Events in quadrant A | 241,284 | 1,378 |
| Events in quadrant B | 227,510 | 1,437 |
| Events in quadrant C | 502,092 | 1,209 |
| Events in quadrant D | 218,951 | 1,346 |
| Mode SS | |||
|---|---|---|---|
| Quadrant | BADHDUFLAG | Total packets | Discarded packets |
| A | 0 | 8 | 0 |
| B | 0 | 8 | 0 |
| C | 0 | 8 | 0 |
| D | 0 | 8 | 0 |
| Mode M0 | |||
|---|---|---|---|
| Quadrant | BADHDUFLAG | Total packets | Discarded packets |
| A | 0 | 1020 | 0 |
| B | 0 | 937 | 0 |
| C | 0 | 1781 | 0 |
| D | 0 | 891 | 0 |
| Quadrant | Total seconds | Saturated seconds | Saturation percentage |
|---|---|---|---|
| A | 420 | 85 | 20.238095% |
| B | 420 | 1 | 0.238095% |
| C | 420 | 96 | 22.857143% |
| D | 420 | 0 | 0.000000% |
Noise dominated data is calculated using 1-second bins in cleaned event files. If a bin has >2000 counts, and if more than 50% of those come from <1% of pixels, then it is considered to be noise-dominated and hence unusable.
| Quadrant | # 1 sec bins | Bins with >0 counts | Bins with >2000 counts | High rate bins dominated by noise | Noise dominated (total time) | Noise dominated (detector-on time) | Marked lightcurve |
|---|---|---|---|---|---|---|---|
| A | 420 | 420 | 0 | 0 | 0.00% | 0.00% |  |
| B | 420 | 420 | 0 | 0 | 0.00% | 0.00% | 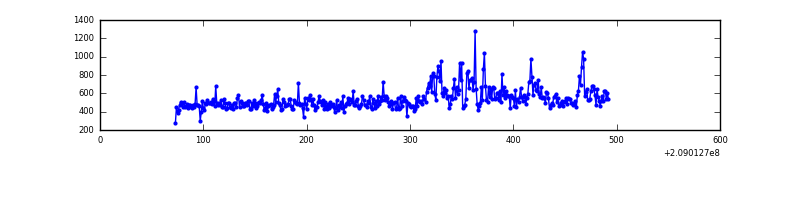 |
| C | 420 | 420 | 78 | 78 | 18.57% | 18.57% | 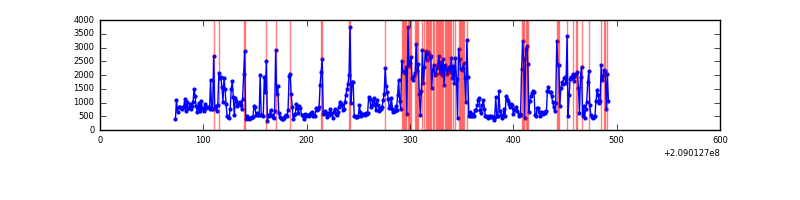 |
| D | 420 | 420 | 0 | 0 | 0.00% | 0.00% | 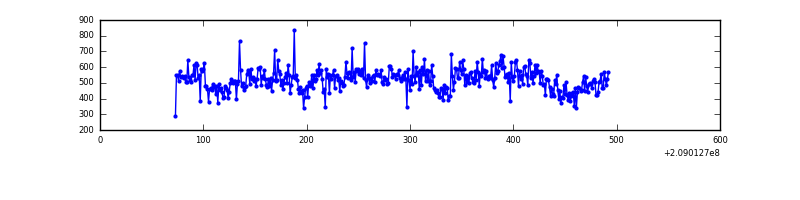 |
Top three noisy pixels from each quadrant. If the there are fewer than three noisy pixels in the level2.evt file, extra rows are filled as -1
| Pixel properties | Quadrant properties | ||||||
|---|---|---|---|---|---|---|---|
| Quadrant | DetID | PixID | Counts | Sigma | Mean | Median | Sigma |
| A | 14 | 111 | 55617 | 4656.36 | 47 | 46 | 11.9 |
| A | 15 | 14 | 2214 | 181.66 | 47 | 46 | 11.9 |
| A | 8 | 15 | 1529 | 124.26 | 47 | 46 | 11.9 |
| B | 14 | 167 | 31171 | 2596.03 | 49 | 47 | 12.0 |
| B | 15 | 204 | 3783 | 311.62 | 49 | 47 | 12.0 |
| B | 4 | 80 | 871 | 68.73 | 49 | 47 | 12.0 |
| C | 14 | 48 | 323044 | 25763.68 | 45 | 45 | 12.5 |
| C | 9 | 237 | 1551 | 120.12 | 45 | 45 | 12.5 |
| C | 13 | 61 | 375 | 26.32 | 45 | 45 | 12.5 |
| D | 11 | 132 | 32659 | 2380.91 | 49 | 47 | 13.7 |
| D | 2 | 234 | 957 | 66.44 | 49 | 47 | 13.7 |
| D | 14 | 226 | 575 | 38.55 | 49 | 47 | 13.7 |
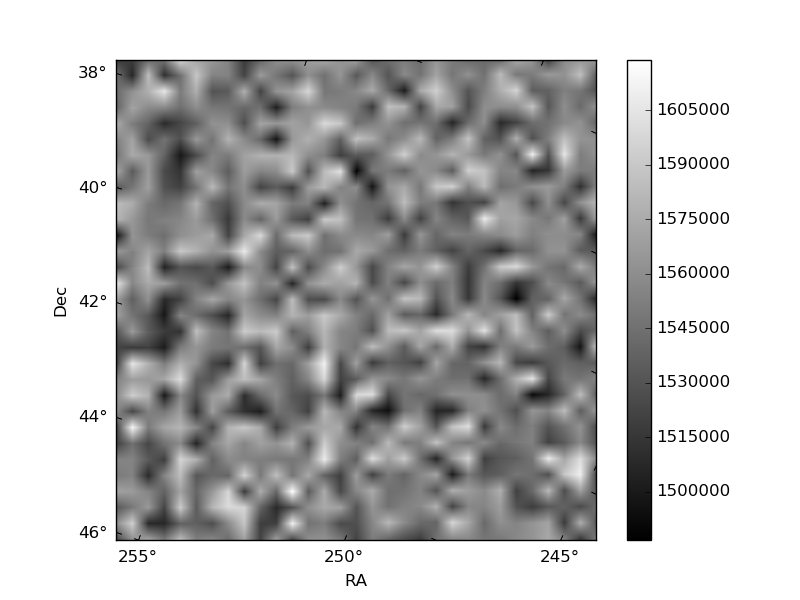
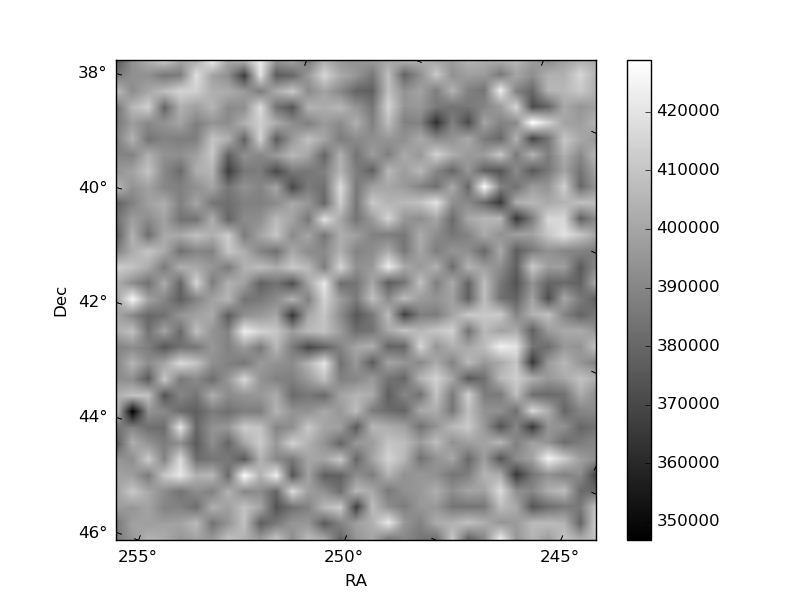
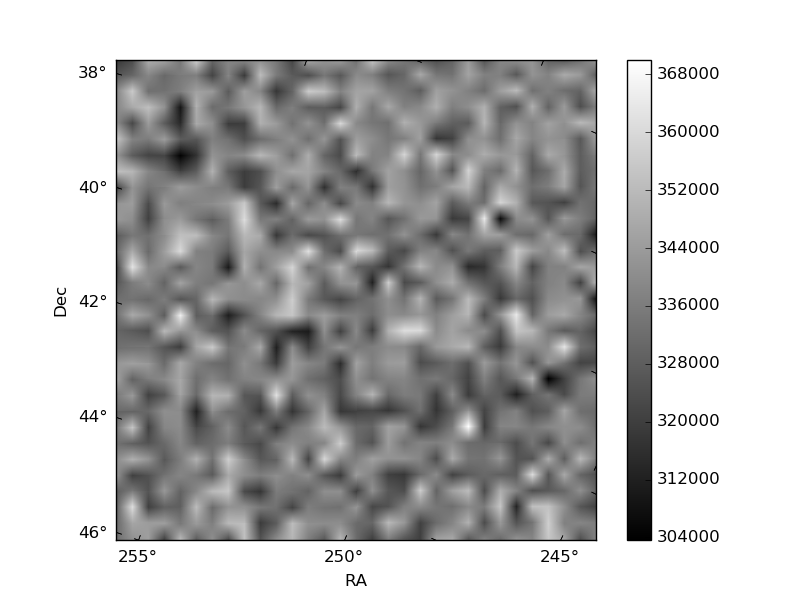
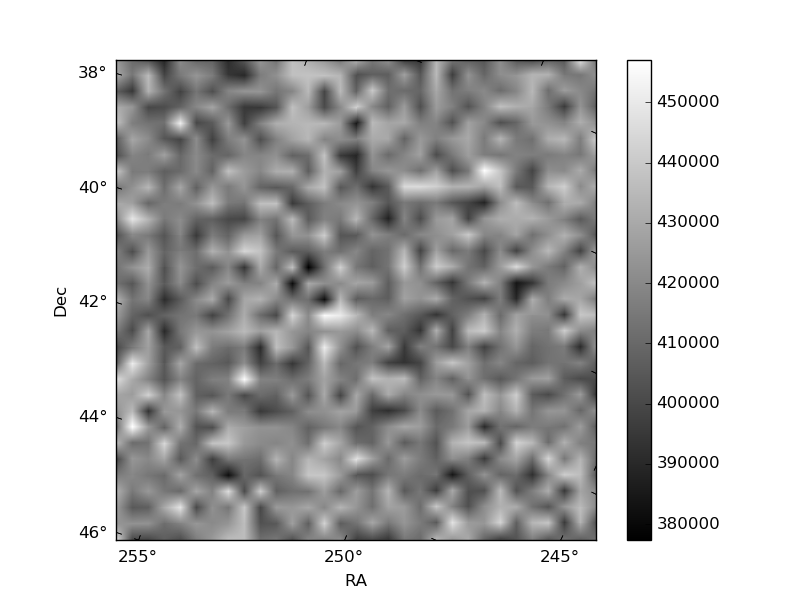
Histogram calculated using DETX and DETY for each event in the final _common_clean file
| Quadrant A |  |
 |
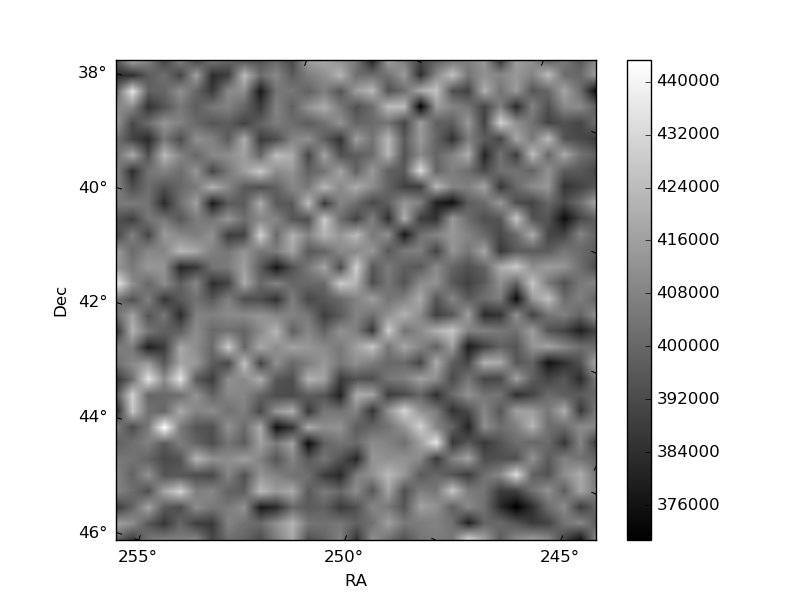
Quadrant B |
|---|---|---|---|
| Quadrant D |  |
 |
Quadrant C |
| Plot type | Count rate plots | Images |
|---|---|---|
| Comparison with Poisson distribution Blue bars denote a histogram of data divided into 1 sec bins. Red curve is a Poisson curve with rate = median count rate of data. |
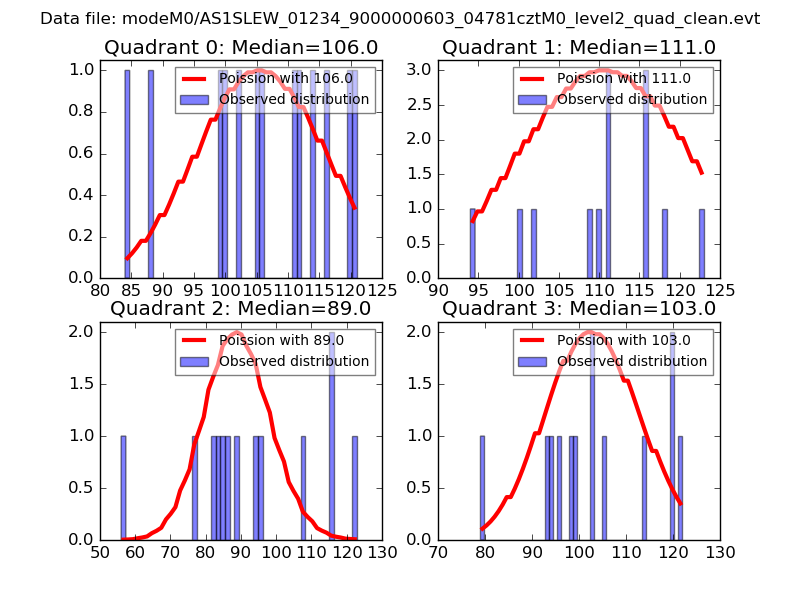 |
 |
| Quadrant-wise count rates Data is divided into 100 sec bins |
 |
|
| Module-wise count rates for Quadrant A Data is divided into 100 sec bins |
 |
 |
| Module-wise count rates for Quadrant B Data is divided into 100 sec bins |
 |
 |
| Module-wise count rates for Quadrant C Data is divided into 100 sec bins |
 |
 |
| Module-wise count rates for Quadrant D Data is divided into 100 sec bins |
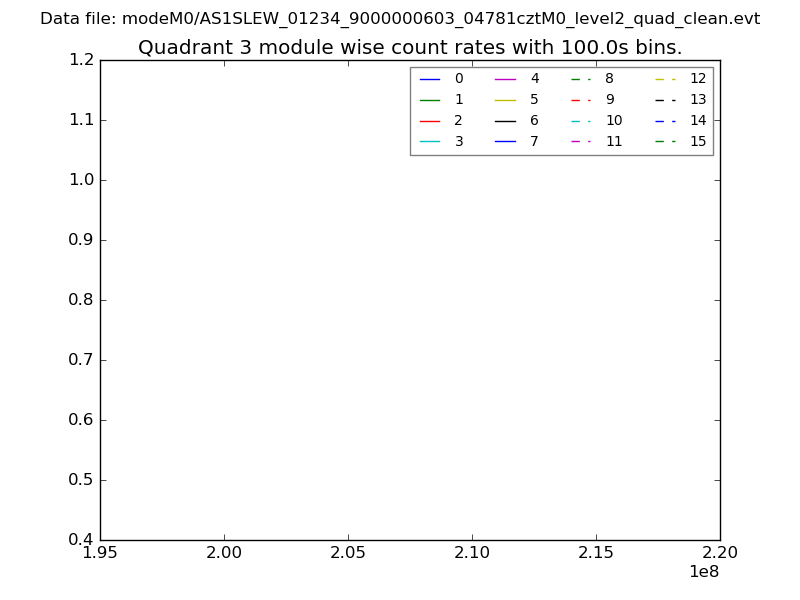 |
 |
| Parameter | Plot |
|---|---|
| CZT HV Monitor | 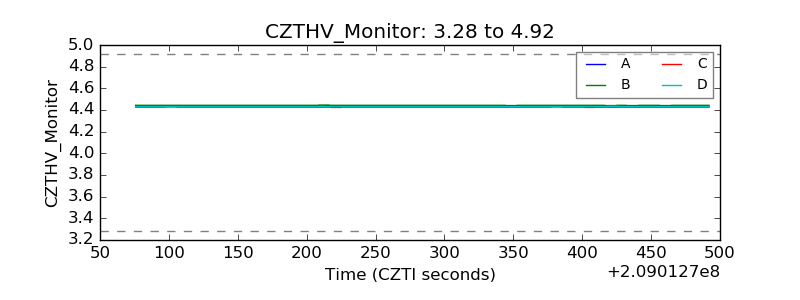 |
| D_VDD | 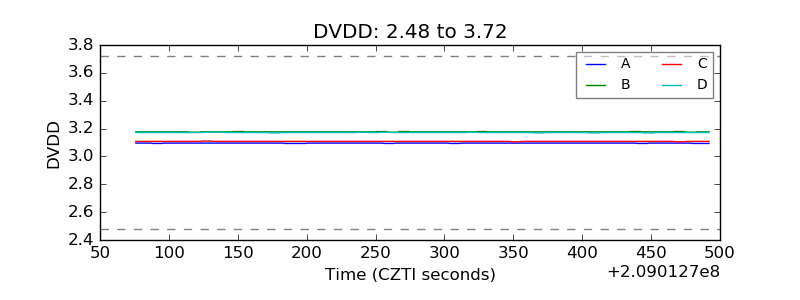 |
| Temperature 1 |  |
| Veto HV Monitor | 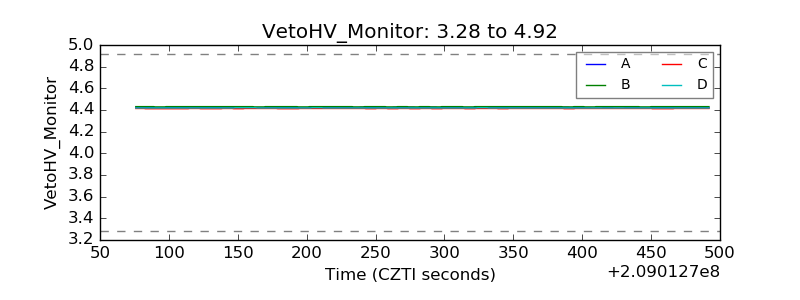 |
| Veto LLD |  |
| Alpha Counter | 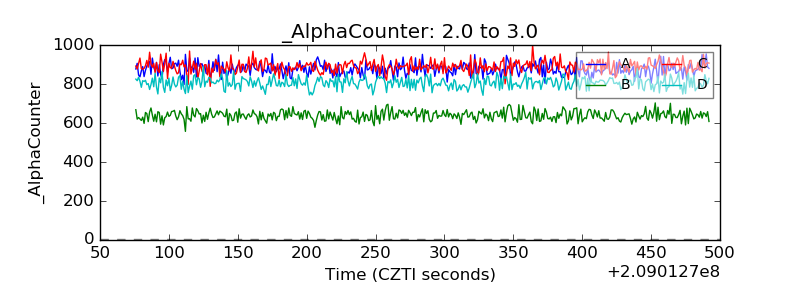 |
| _CPM_Rate | 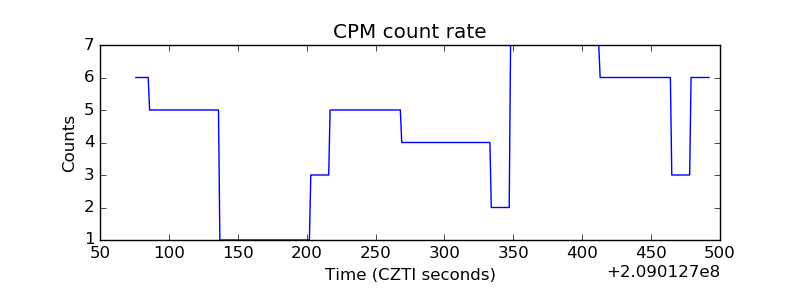 |
| CZT Counter | 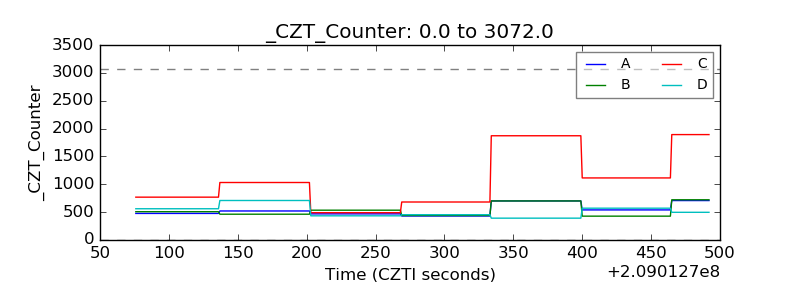 |
| +2.5 Volts monitor |  |
| +5 Volts monitor |  |
| _ROLL_ROT | 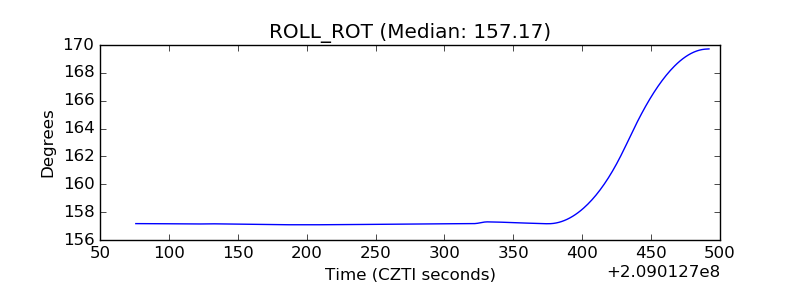 |
| _Roll_DEC | 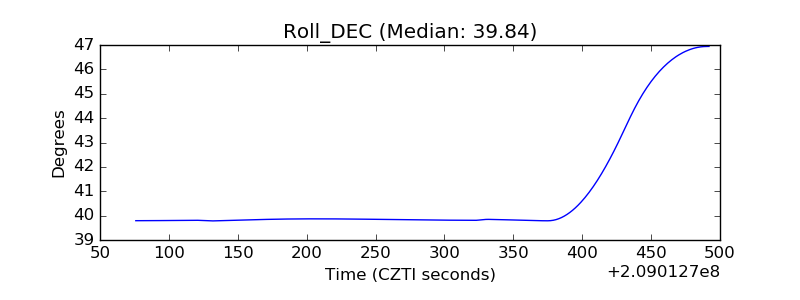 |
| _Roll_RA | 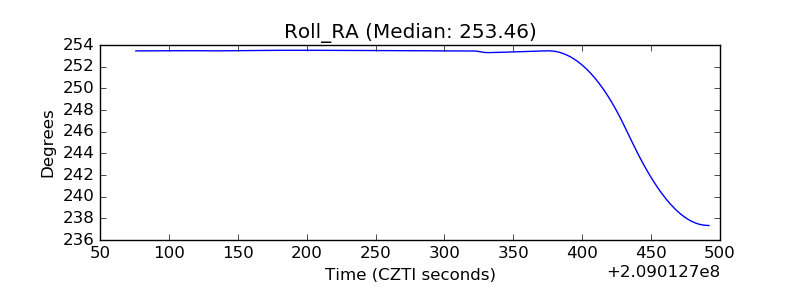 |
| Veto Counter | 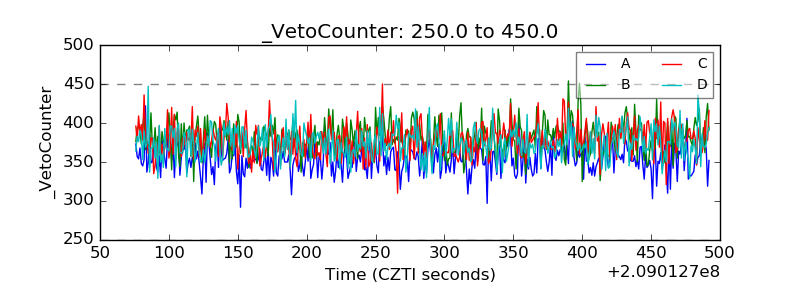 |