| Param | Original file | Final file |
|---|---|---|
| Filename | modeM0/AS1T01_136T01_9000000662_05214cztM0_level2.evt | modeM0/AS1T01_136T01_9000000662_05214cztM0_level2_quad_clean.evt |
| Size (bytes) | 486,414,720 | 76,046,400 |
| Size | 463.9 MB | 72.5 MB |
| Events in quadrant A | 3,255,881 | 457,123 |
| Events in quadrant B | 3,369,278 | 463,318 |
| Events in quadrant C | 3,308,635 | 461,905 |
| Events in quadrant D | 4,312,201 | 423,621 |
| Mode M9 | |||
|---|---|---|---|
| Quadrant | BADHDUFLAG | Total packets | Discarded packets |
| A | 0 | 3 | 0 |
| B | 0 | 3 | 0 |
| C | 0 | 3 | 0 |
| D | 0 | 3 | 0 |
| Mode SS | |||
|---|---|---|---|
| Quadrant | BADHDUFLAG | Total packets | Discarded packets |
| A | 0 | 142 | 0 |
| B | 0 | 142 | 0 |
| C | 0 | 142 | 0 |
| D | 0 | 142 | 0 |
| Mode M0 | |||
|---|---|---|---|
| Quadrant | BADHDUFLAG | Total packets | Discarded packets |
| A | 0 | 14810 | 2 |
| B | 0 | 14855 | 1 |
| C | 0 | 14904 | 1 |
| D | 0 | 18033 | 1 |
| Quadrant | Total seconds | Saturated seconds | Saturation percentage |
|---|---|---|---|
| A | 7135 | 304 | 4.260687% |
| B | 7135 | 293 | 4.106517% |
| C | 7135 | 235 | 3.293623% |
| D | 7135 | 786 | 11.016118% |
Noise dominated data is calculated using 1-second bins in cleaned event files. If a bin has >2000 counts, and if more than 50% of those come from <1% of pixels, then it is considered to be noise-dominated and hence unusable.
| Quadrant | # 1 sec bins | Bins with >0 counts | Bins with >2000 counts | High rate bins dominated by noise | Noise dominated (total time) | Noise dominated (detector-on time) | Marked lightcurve |
|---|---|---|---|---|---|---|---|
| A | 7345 | 7135 | 0 | 0 | 0.00% | 0.00% | 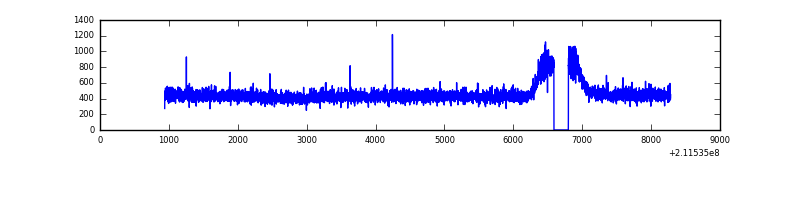 |
| B | 7345 | 7135 | 0 | 0 | 0.00% | 0.00% | 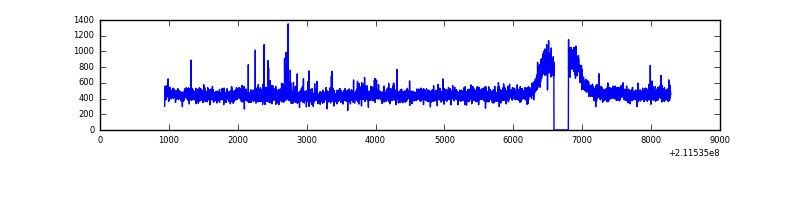 |
| C | 7345 | 7135 | 0 | 0 | 0.00% | 0.00% | 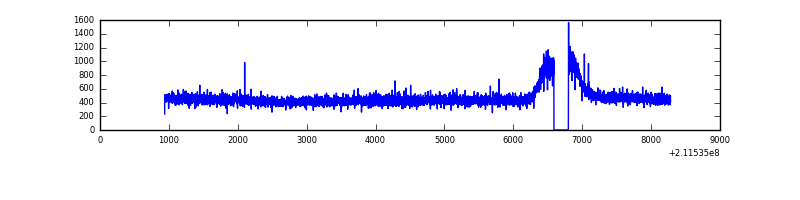 |
| D | 7345 | 7135 | 271 | 271 | 3.69% | 3.80% | 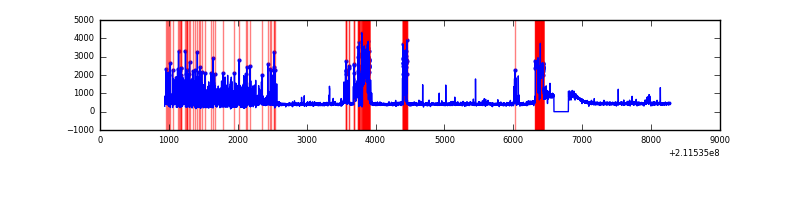 |
Top three noisy pixels from each quadrant. If the there are fewer than three noisy pixels in the level2.evt file, extra rows are filled as -1
| Pixel properties | Quadrant properties | ||||||
|---|---|---|---|---|---|---|---|
| Quadrant | DetID | PixID | Counts | Sigma | Mean | Median | Sigma |
| A | 12 | 194 | 8417 | 43.07 | 845 | 821 | 176.4 |
| A | 0 | 226 | 8126 | 41.42 | 845 | 821 | 176.4 |
| A | 0 | 50 | 4996 | 23.67 | 845 | 821 | 176.4 |
| B | 15 | 204 | 35582 | 206.35 | 851 | 826 | 168.4 |
| B | 12 | 111 | 15576 | 87.57 | 851 | 826 | 168.4 |
| B | 0 | 229 | 14525 | 81.33 | 851 | 826 | 168.4 |
| C | 1 | 16 | 44925 | 226.46 | 832 | 833 | 194.7 |
| C | 8 | 128 | 6998 | 31.66 | 832 | 833 | 194.7 |
| C | 13 | 61 | 6702 | 30.14 | 832 | 833 | 194.7 |
| D | 2 | 33 | 518945 | 2633.85 | 798 | 772 | 196.7 |
| D | 1 | 239 | 414453 | 2102.73 | 798 | 772 | 196.7 |
| D | 13 | 53 | 263549 | 1335.69 | 798 | 772 | 196.7 |
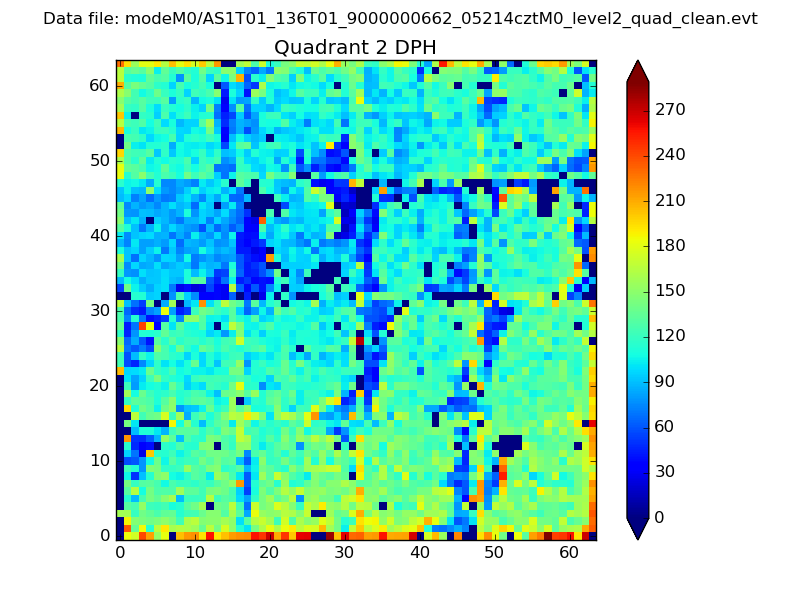
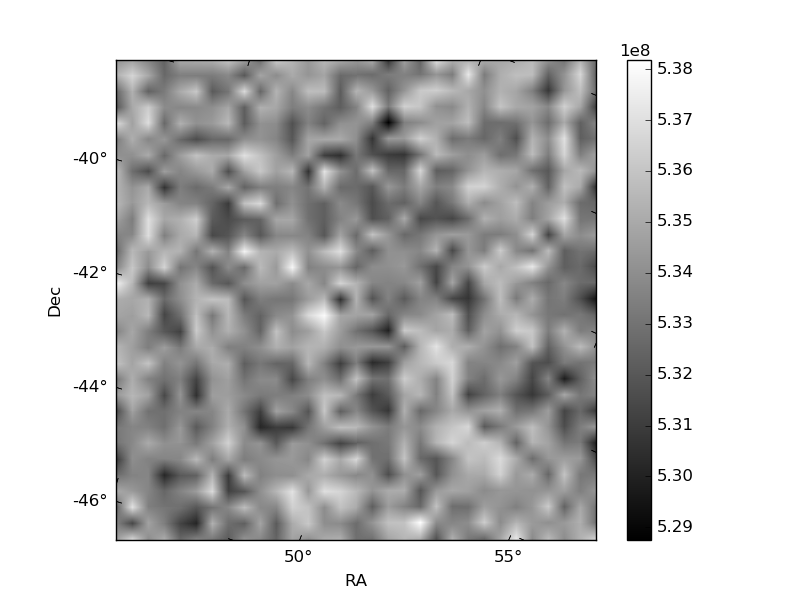
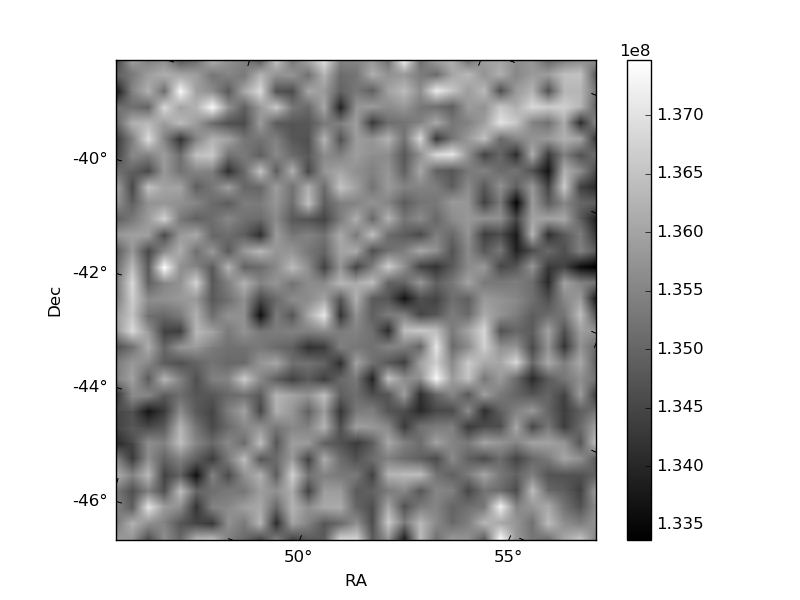
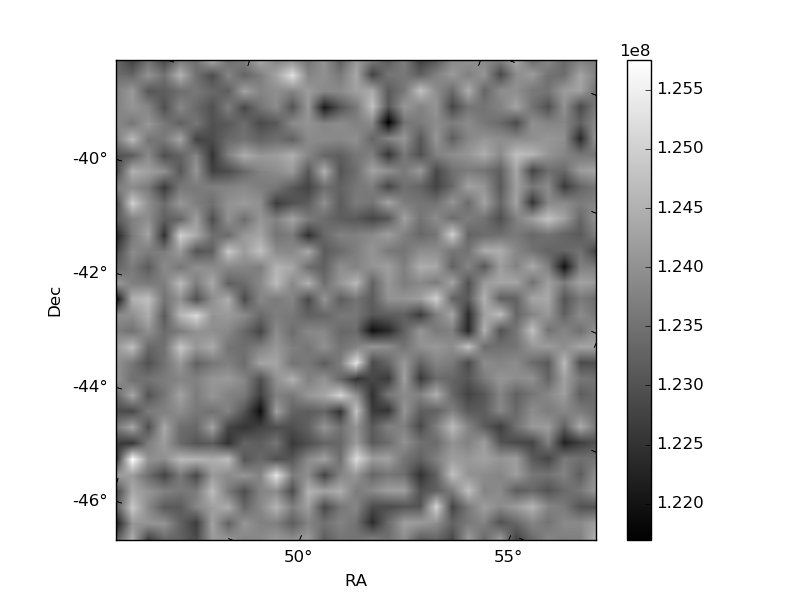
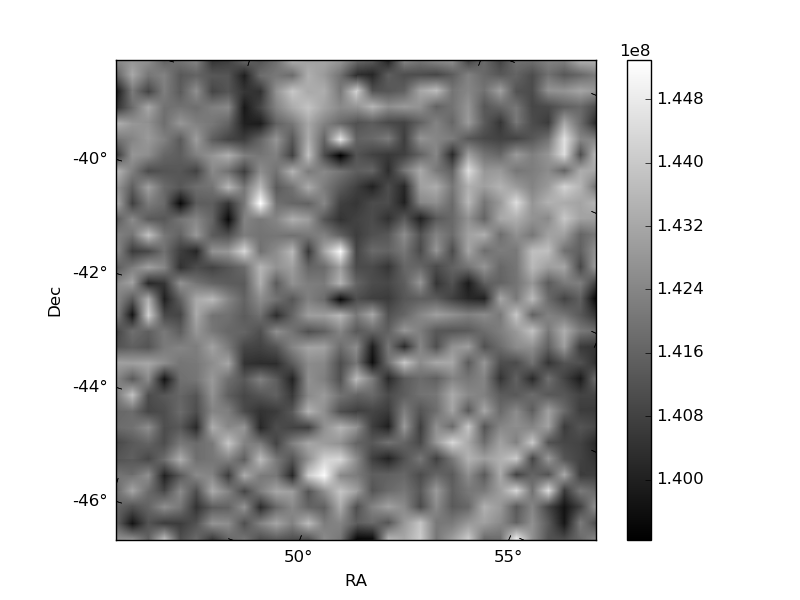
Histogram calculated using DETX and DETY for each event in the final _common_clean file
| Quadrant A | 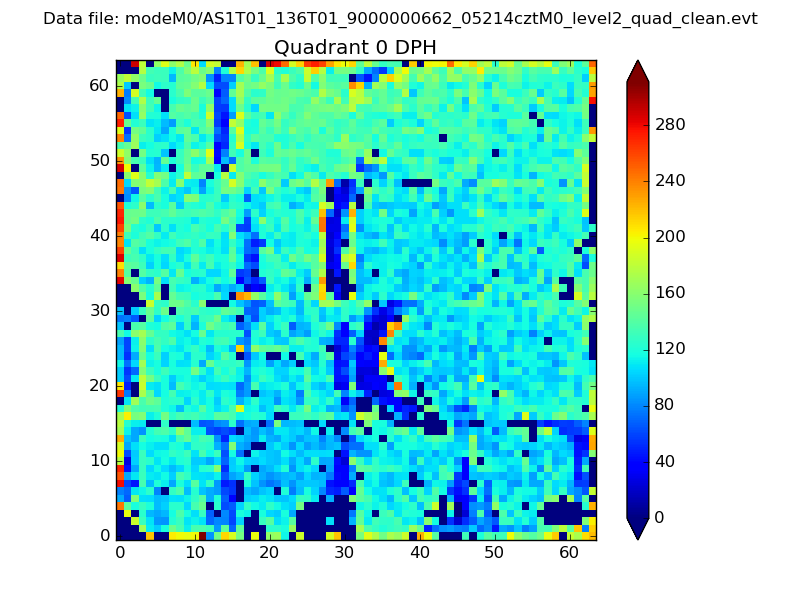 |
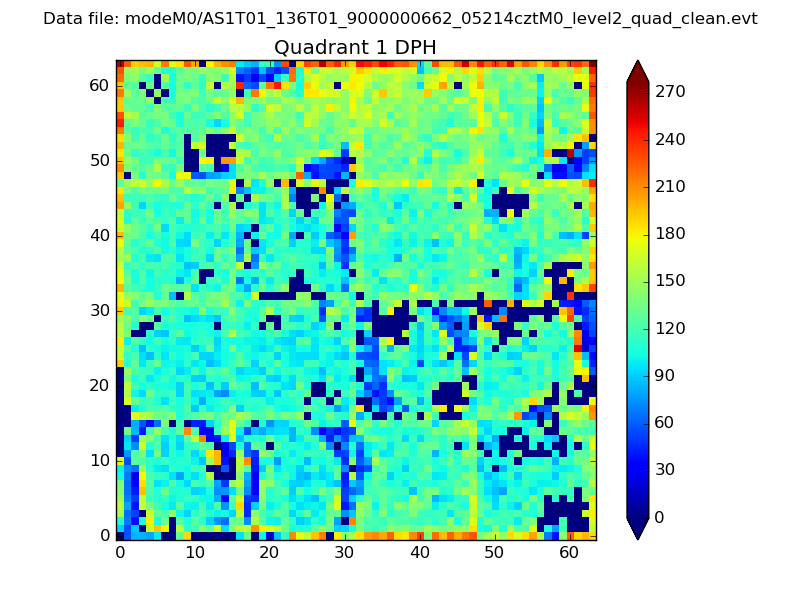 |
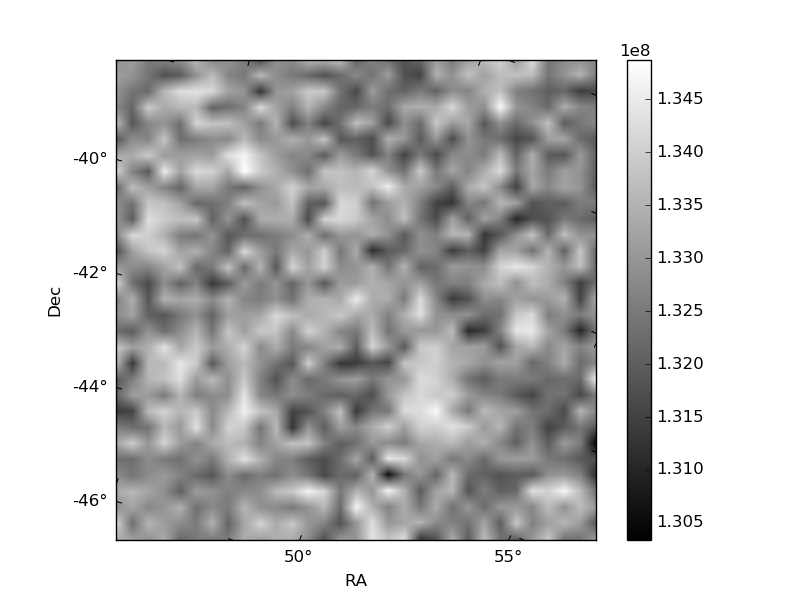
Quadrant B |
|---|---|---|---|
| Quadrant D | 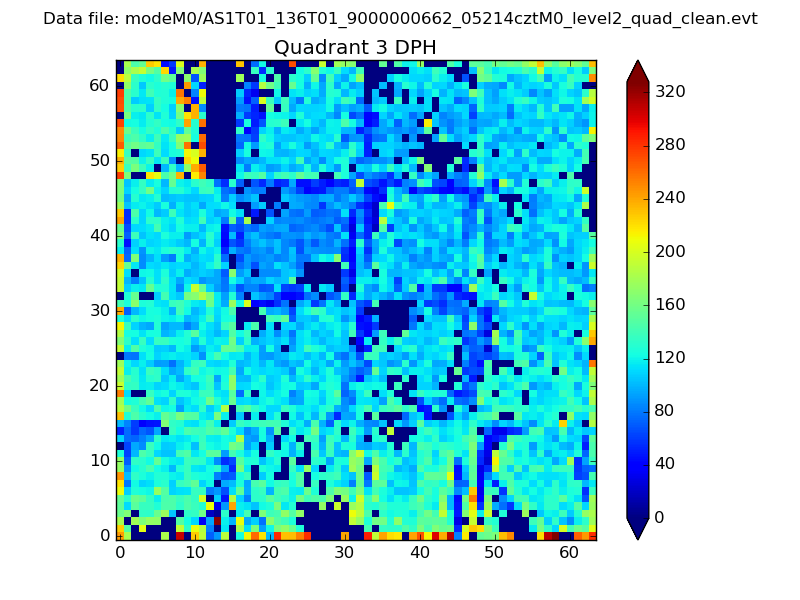 |
 |
Quadrant C |
| Plot type | Count rate plots | Images |
|---|---|---|
| Comparison with Poisson distribution Blue bars denote a histogram of data divided into 1 sec bins. Red curve is a Poisson curve with rate = median count rate of data. |
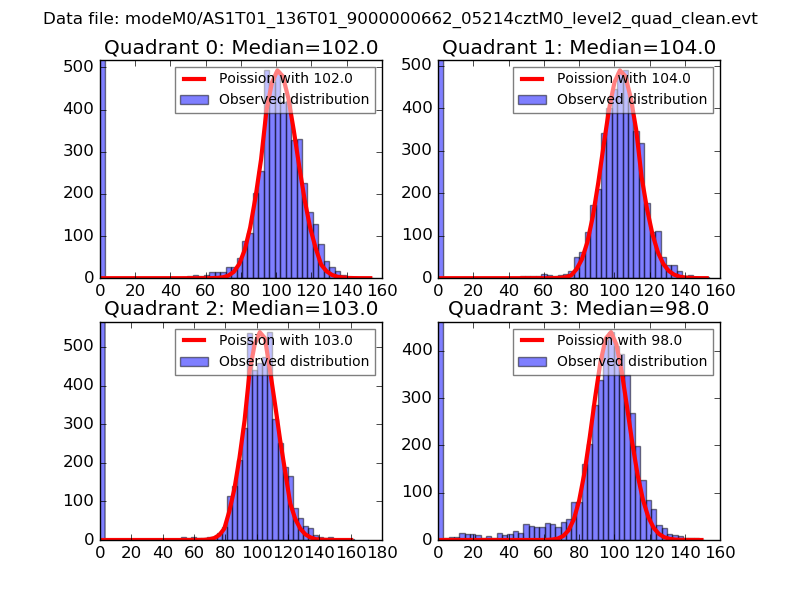 |
 |
| Quadrant-wise count rates Data is divided into 100 sec bins |
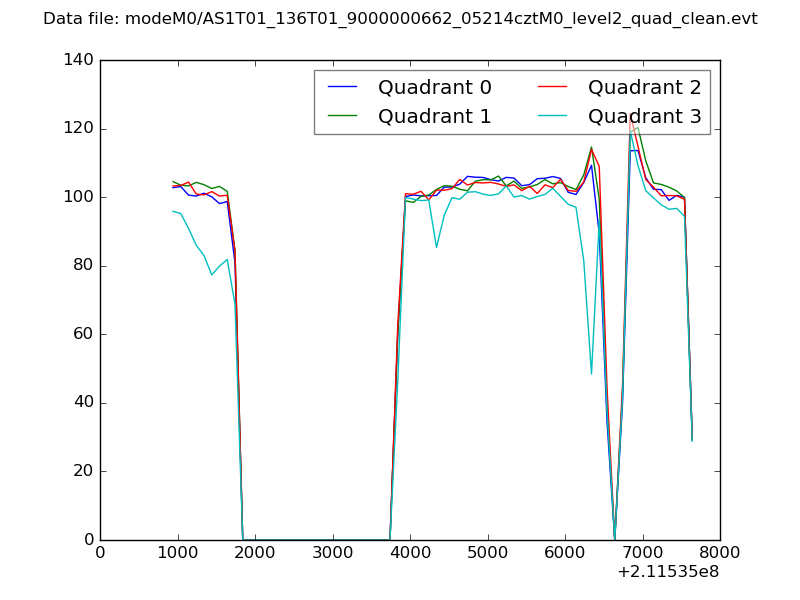 |
|
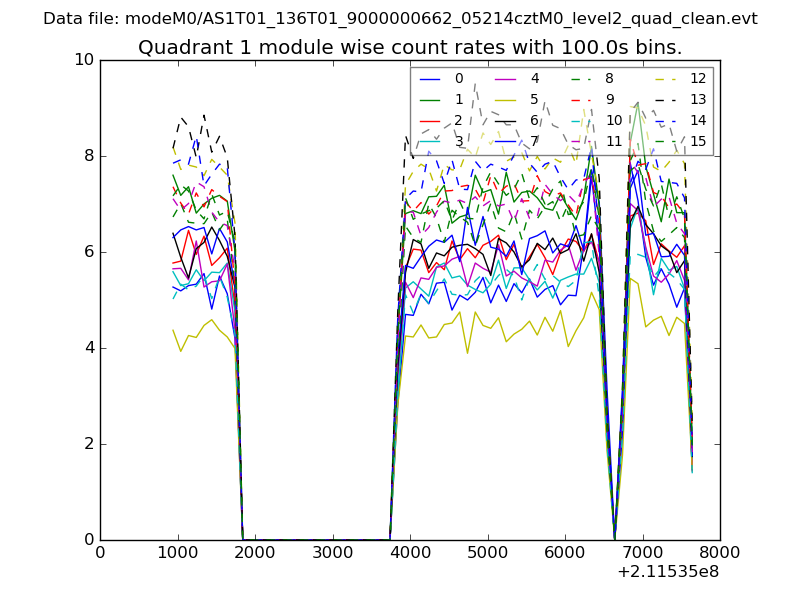
| Module-wise count rates for Quadrant A Data is divided into 100 sec bins |
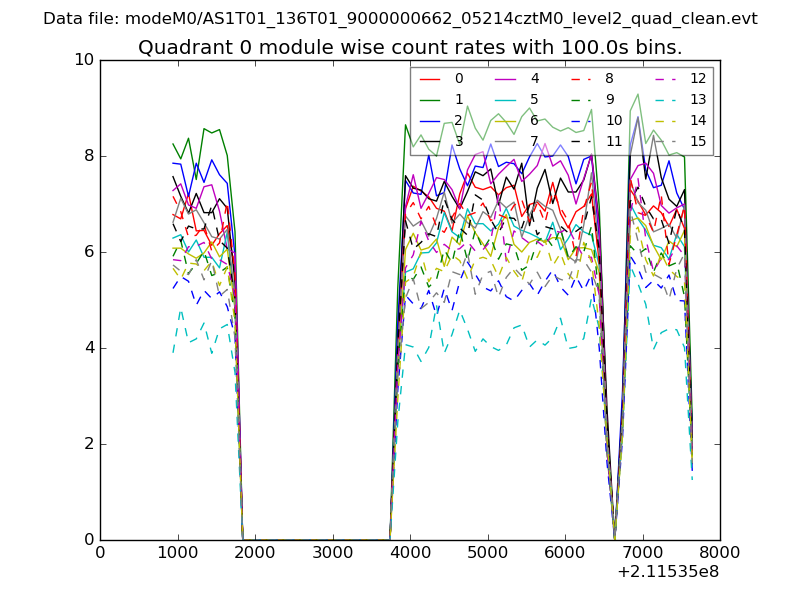 |
 |
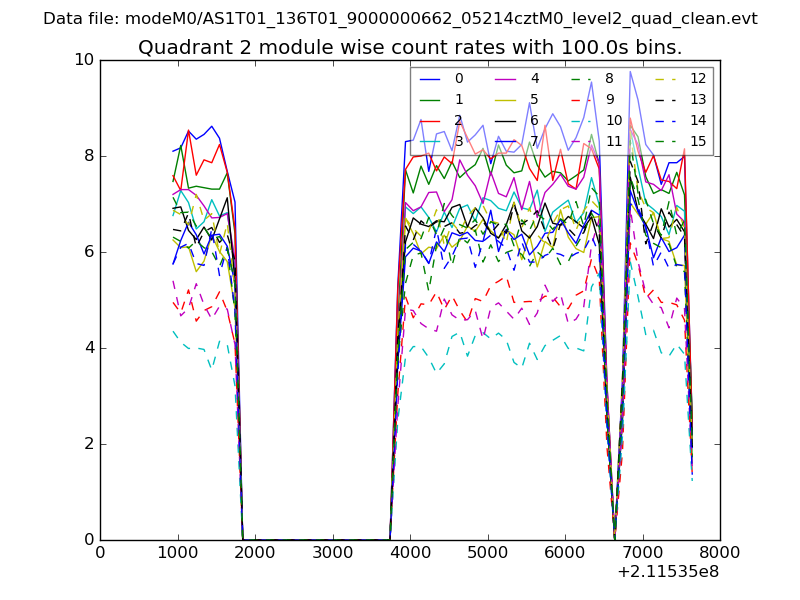
| Module-wise count rates for Quadrant B Data is divided into 100 sec bins |
 |
 |
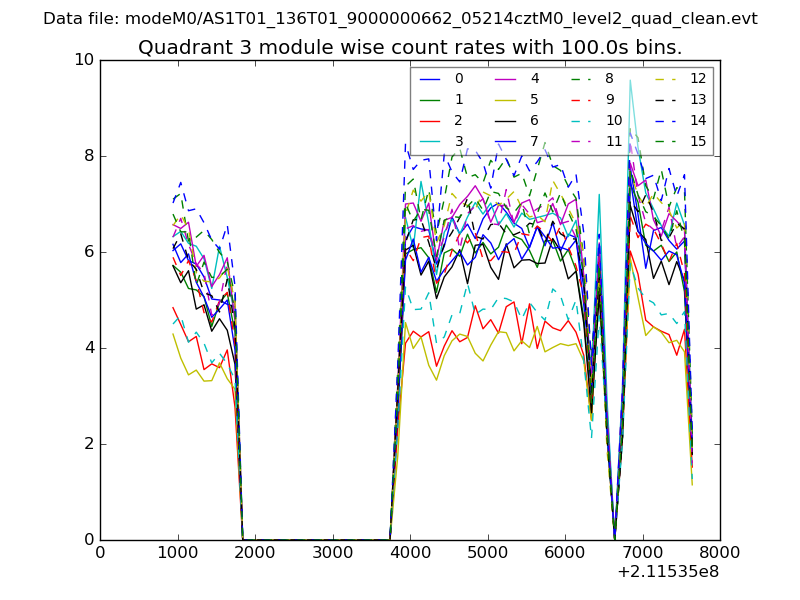
| Module-wise count rates for Quadrant C Data is divided into 100 sec bins |
 |
 |
| Module-wise count rates for Quadrant D Data is divided into 100 sec bins |
 |
 |
| Parameter | Plot |
|---|---|
| CZT HV Monitor | 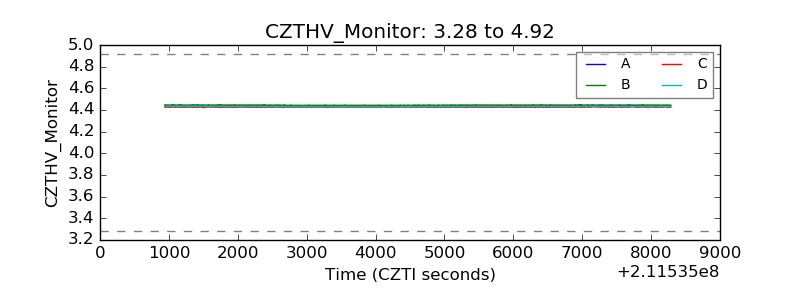 |
| D_VDD | 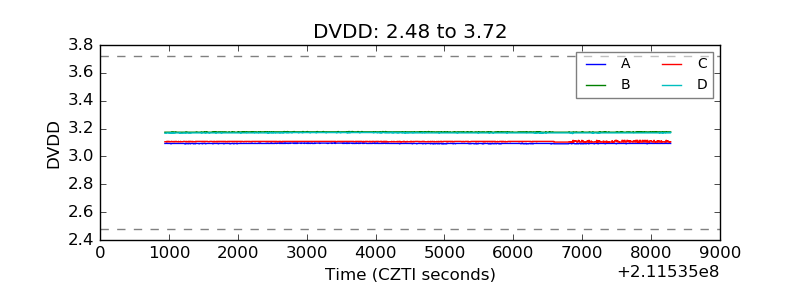 |
| Temperature 1 | 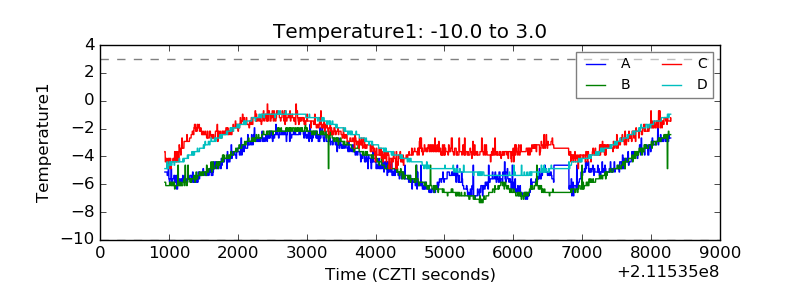 |
| Veto HV Monitor | 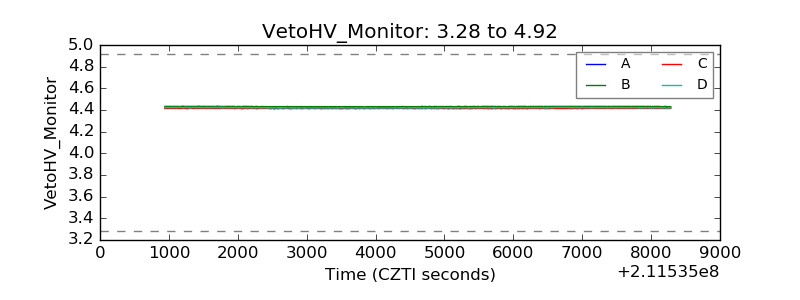 |
| Veto LLD | 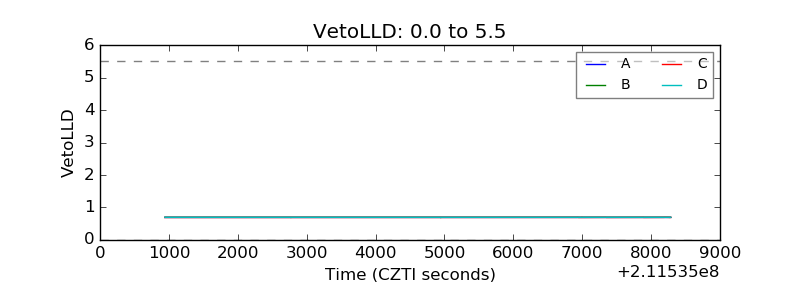 |
| Alpha Counter | 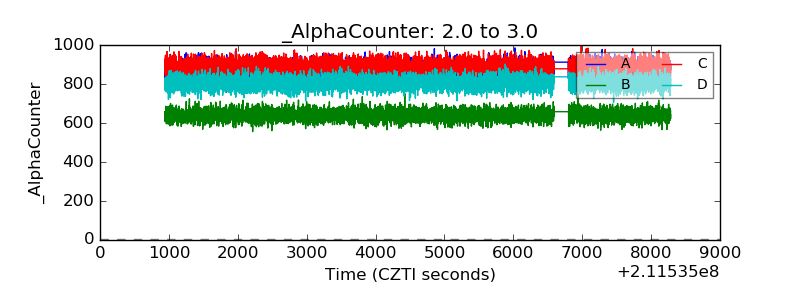 |
| _CPM_Rate | 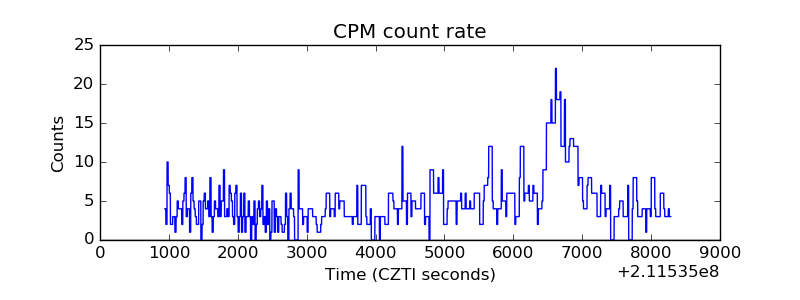 |
| CZT Counter | 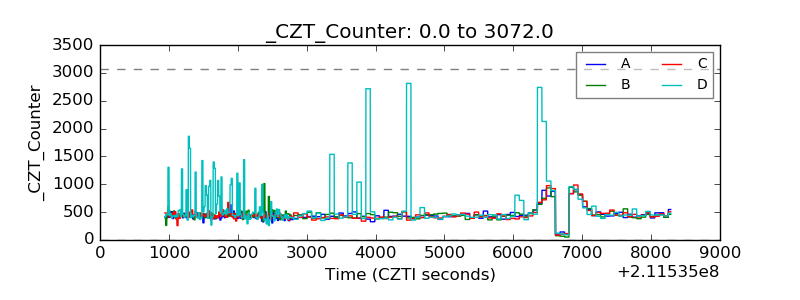 |
| +2.5 Volts monitor |  |
| +5 Volts monitor |  |
| _ROLL_ROT | 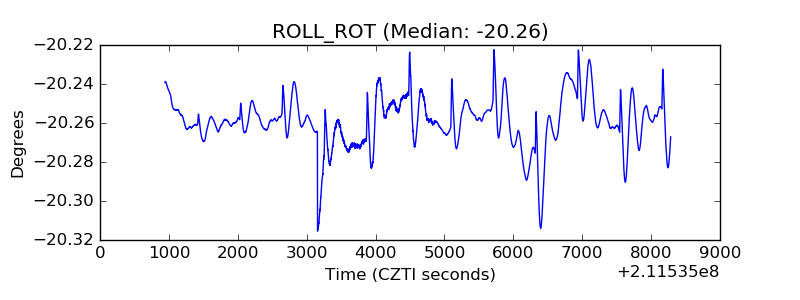 |
| _Roll_DEC | 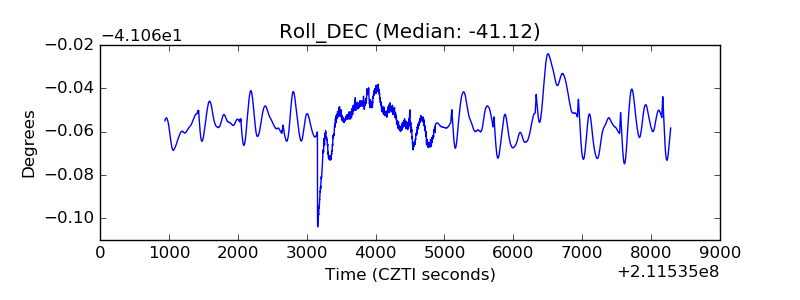 |
| _Roll_RA |  |
| Veto Counter | 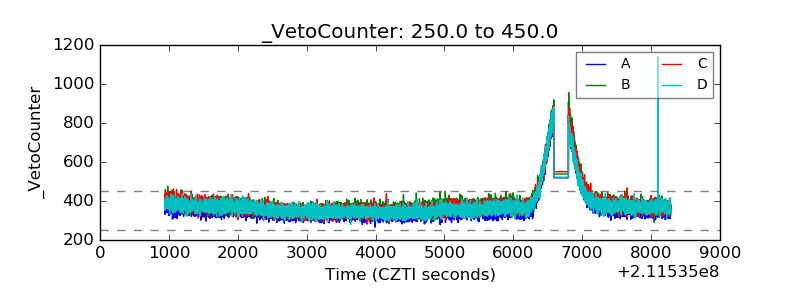 |