| Param | Original file | Final file |
|---|---|---|
| Filename | modeM0/AS1C01_015T01_9000000668_05245cztM0_level2.evt | modeM0/AS1C01_015T01_9000000668_05245cztM0_level2_quad_clean.evt |
| Size (bytes) | 570,000,960 | 65,540,160 |
| Size | 543.6 MB | 62.5 MB |
| Events in quadrant A | 3,602,810 | 369,954 |
| Events in quadrant B | 3,678,080 | 367,945 |
| Events in quadrant C | 3,616,781 | 361,291 |
| Events in quadrant D | 5,839,616 | 346,908 |
| Mode SS | |||
|---|---|---|---|
| Quadrant | BADHDUFLAG | Total packets | Discarded packets |
| A | 0 | 158 | 0 |
| B | 0 | 158 | 0 |
| C | 0 | 158 | 0 |
| D | 0 | 158 | 0 |
| Mode M9 | |||
|---|---|---|---|
| Quadrant | BADHDUFLAG | Total packets | Discarded packets |
| A | 0 | 5 | 0 |
| B | 0 | 5 | 0 |
| C | 0 | 5 | 0 |
| D | 0 | 5 | 0 |
| Mode M0 | |||
|---|---|---|---|
| Quadrant | BADHDUFLAG | Total packets | Discarded packets |
| A | 0 | 16084 | 3 |
| B | 0 | 16158 | 2 |
| C | 0 | 16147 | 2 |
| D | 0 | 22496 | 2 |
| Quadrant | Total seconds | Saturated seconds | Saturation percentage |
|---|---|---|---|
| A | 7738 | 225 | 2.907728% |
| B | 7738 | 234 | 3.024037% |
| C | 7738 | 212 | 2.739726% |
| D | 7738 | 719 | 9.291807% |
Noise dominated data is calculated using 1-second bins in cleaned event files. If a bin has >2000 counts, and if more than 50% of those come from <1% of pixels, then it is considered to be noise-dominated and hence unusable.
| Quadrant | # 1 sec bins | Bins with >0 counts | Bins with >2000 counts | High rate bins dominated by noise | Noise dominated (total time) | Noise dominated (detector-on time) | Marked lightcurve |
|---|---|---|---|---|---|---|---|
| A | 8178 | 7740 | 0 | 0 | 0.00% | 0.00% | 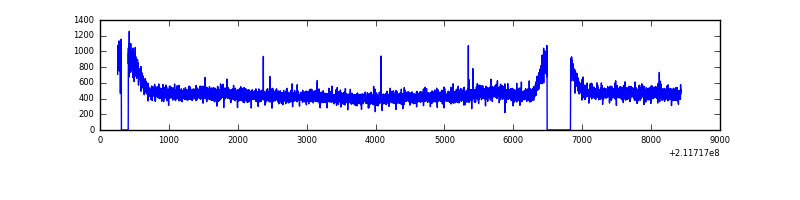 |
| B | 8178 | 7740 | 0 | 0 | 0.00% | 0.00% | 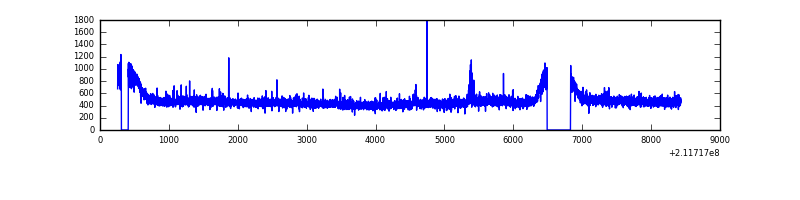 |
| C | 8178 | 7740 | 0 | 0 | 0.00% | 0.00% | 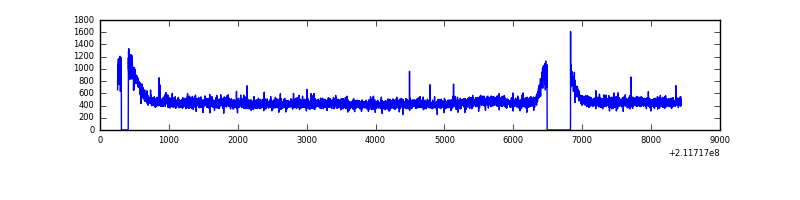 |
| D | 8178 | 7740 | 372 | 372 | 4.55% | 4.81% | 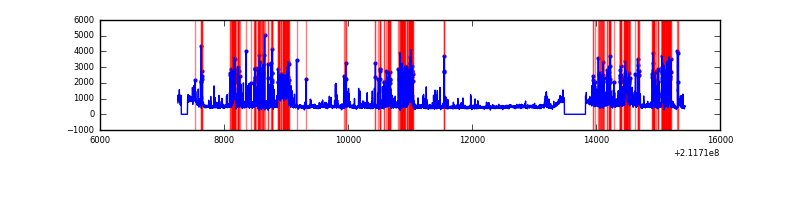 |
Top three noisy pixels from each quadrant. If the there are fewer than three noisy pixels in the level2.evt file, extra rows are filled as -1
| Pixel properties | Quadrant properties | ||||||
|---|---|---|---|---|---|---|---|
| Quadrant | DetID | PixID | Counts | Sigma | Mean | Median | Sigma |
| A | 0 | 226 | 9211 | 42.96 | 935 | 912 | 193.2 |
| A | 12 | 194 | 9121 | 42.5 | 935 | 912 | 193.2 |
| A | 13 | 14 | 5333 | 22.89 | 935 | 912 | 193.2 |
| B | 12 | 111 | 18130 | 92.78 | 937 | 912 | 185.6 |
| B | 7 | 252 | 16440 | 83.67 | 937 | 912 | 185.6 |
| B | 11 | 111 | 14388 | 72.61 | 937 | 912 | 185.6 |
| C | 1 | 16 | 63182 | 294.54 | 899 | 903 | 211.4 |
| C | 8 | 128 | 20235 | 91.43 | 899 | 903 | 211.4 |
| C | 8 | 112 | 8074 | 33.91 | 899 | 903 | 211.4 |
| D | 11 | 145 | 1857278 | 8408.93 | 889 | 859 | 220.8 |
| D | 8 | 195 | 295400 | 1334.17 | 889 | 859 | 220.8 |
| D | 2 | 16 | 268338 | 1211.59 | 889 | 859 | 220.8 |
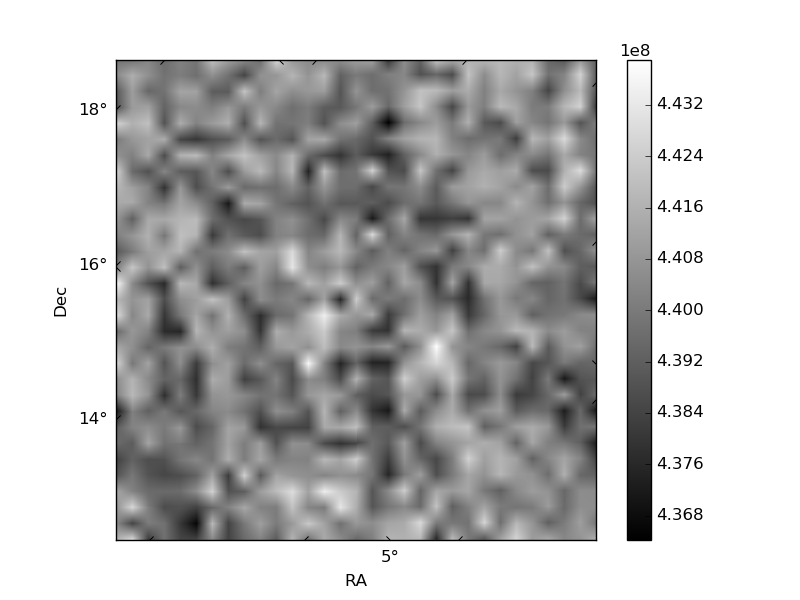
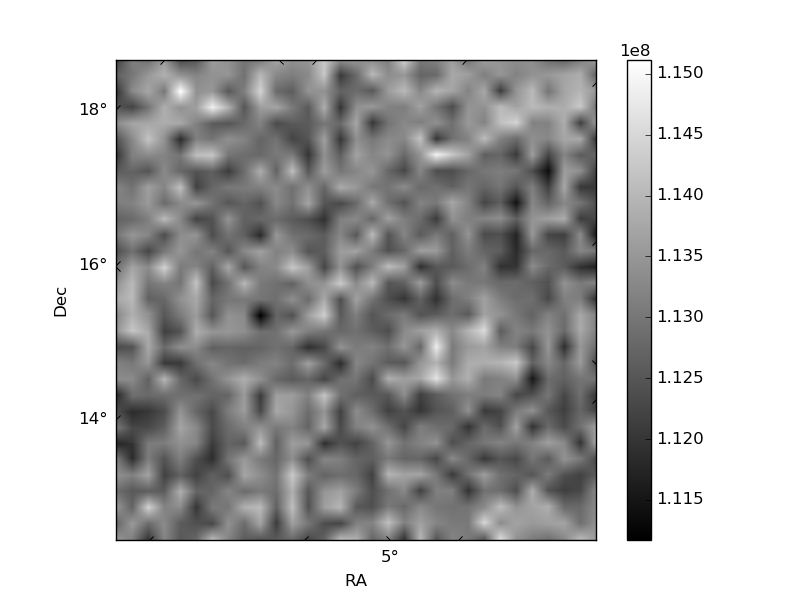
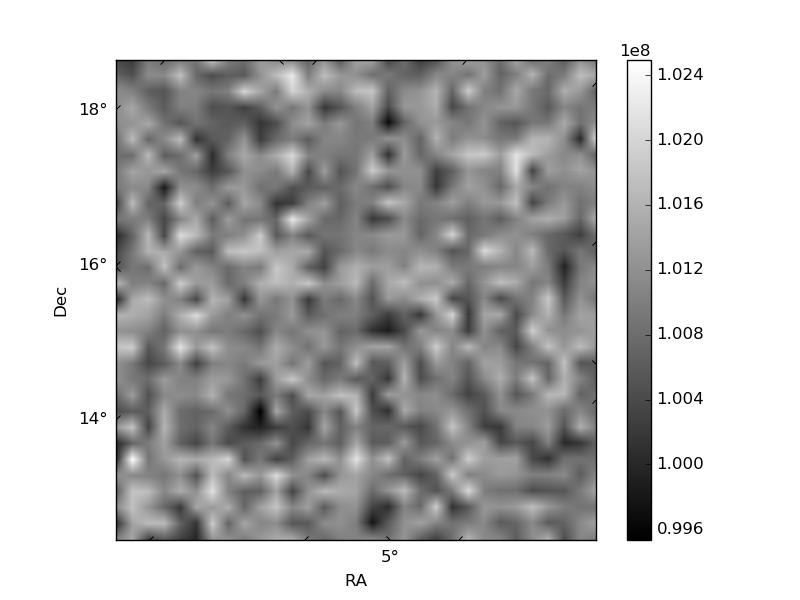
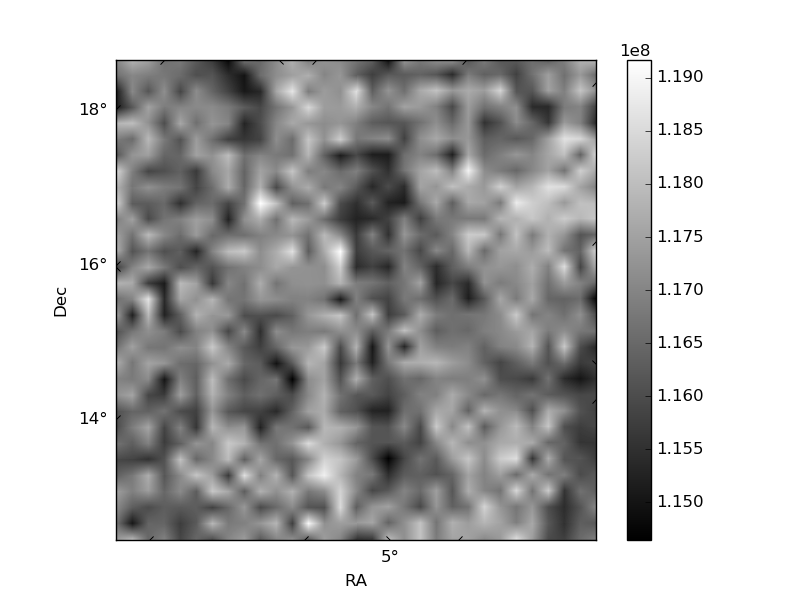
Histogram calculated using DETX and DETY for each event in the final _common_clean file
| Quadrant A | 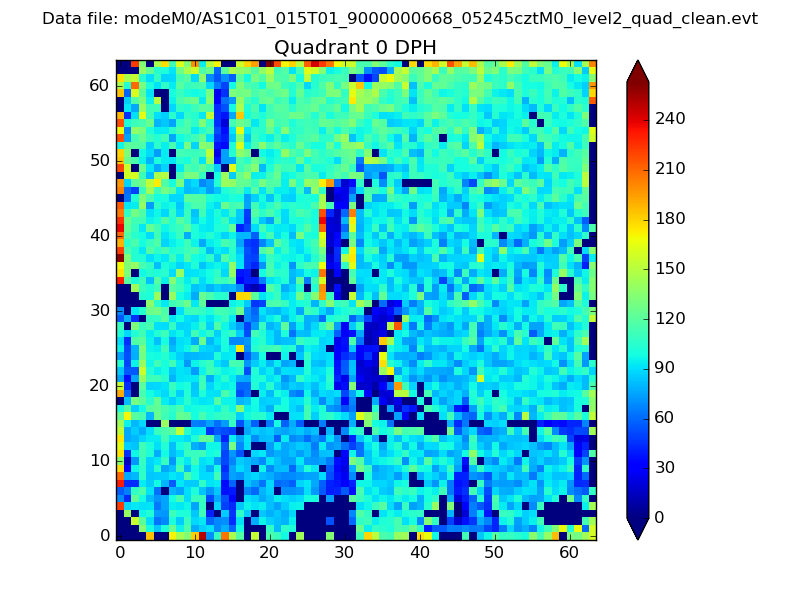 |
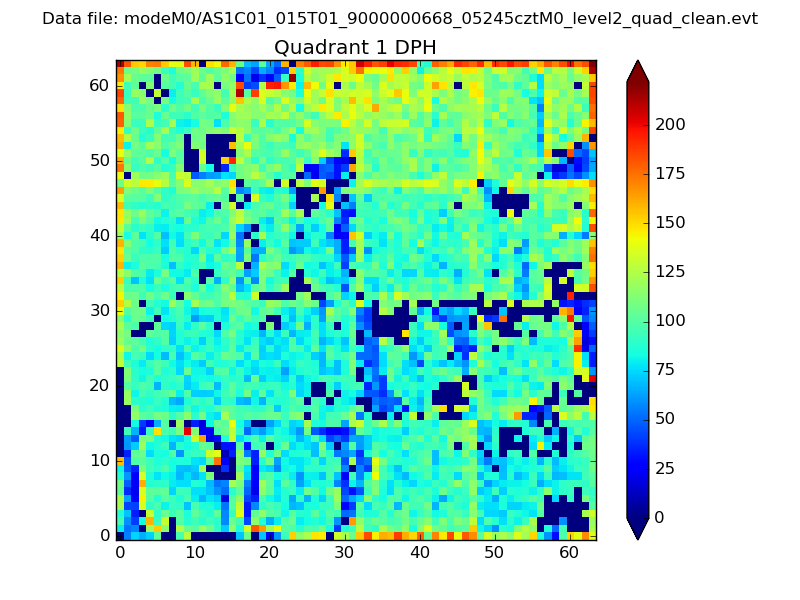 |
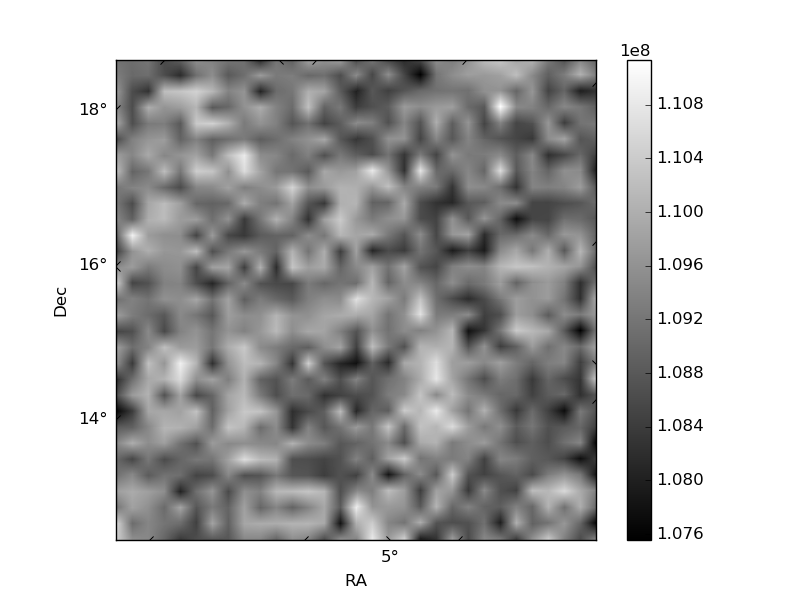
Quadrant B |
|---|---|---|---|
| Quadrant D | 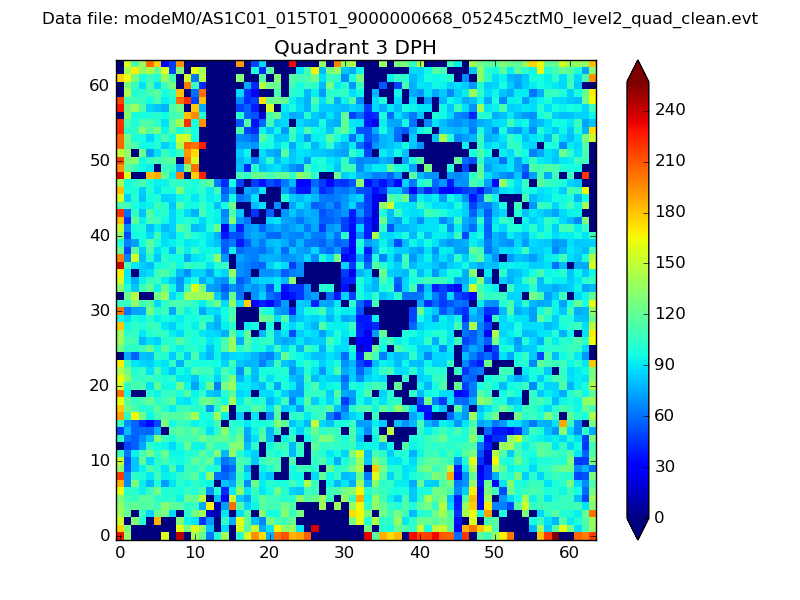 |
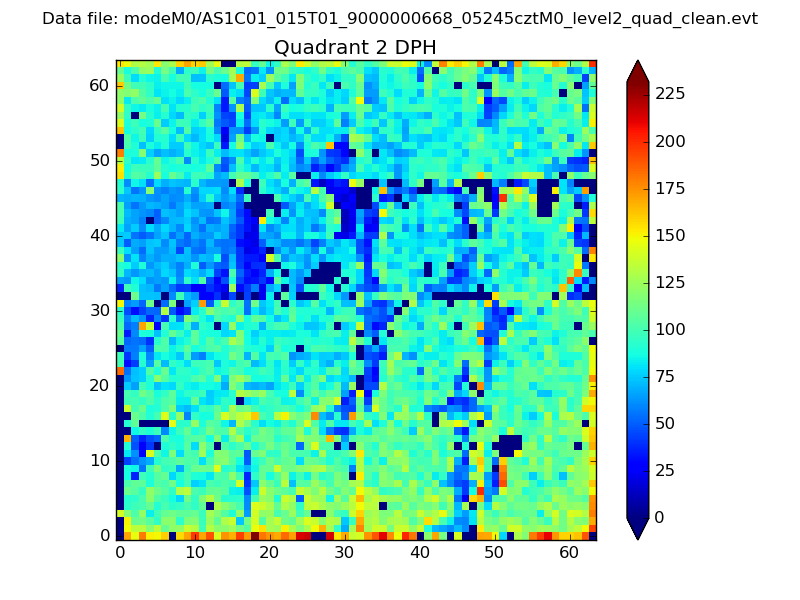 |
Quadrant C |
| Plot type | Count rate plots | Images |
|---|---|---|
| Comparison with Poisson distribution Blue bars denote a histogram of data divided into 1 sec bins. Red curve is a Poisson curve with rate = median count rate of data. |
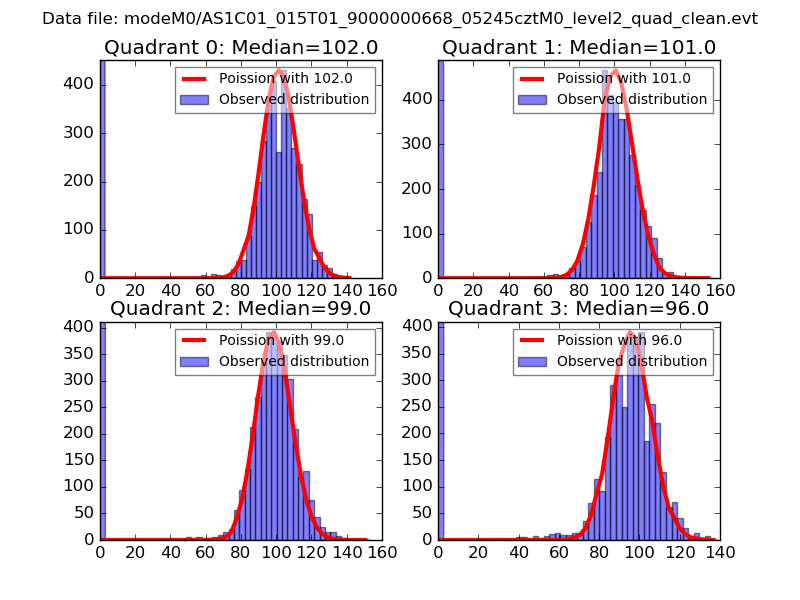 |
 |
| Quadrant-wise count rates Data is divided into 100 sec bins |
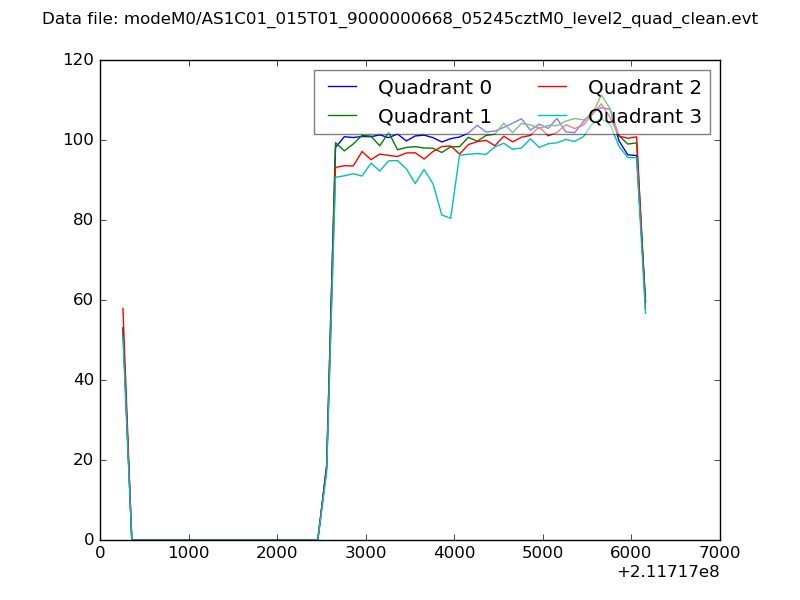 |
|
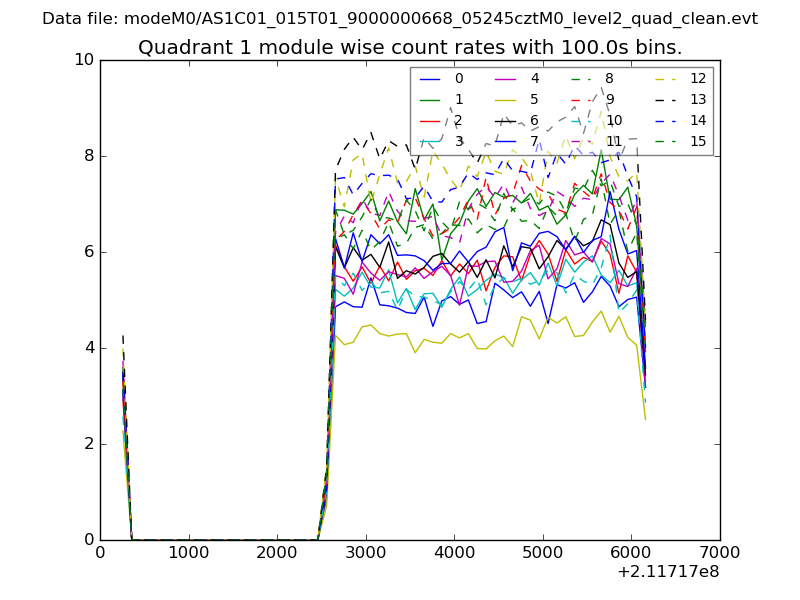
| Module-wise count rates for Quadrant A Data is divided into 100 sec bins |
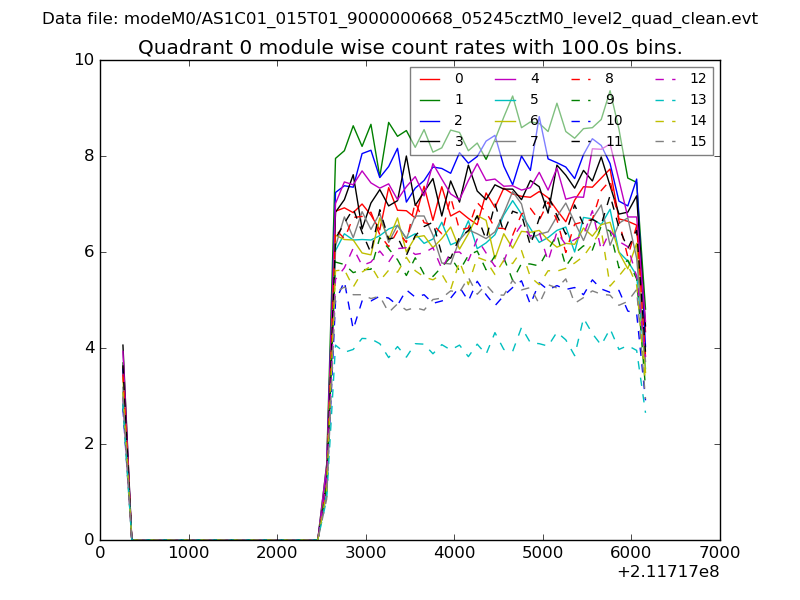 |
 |
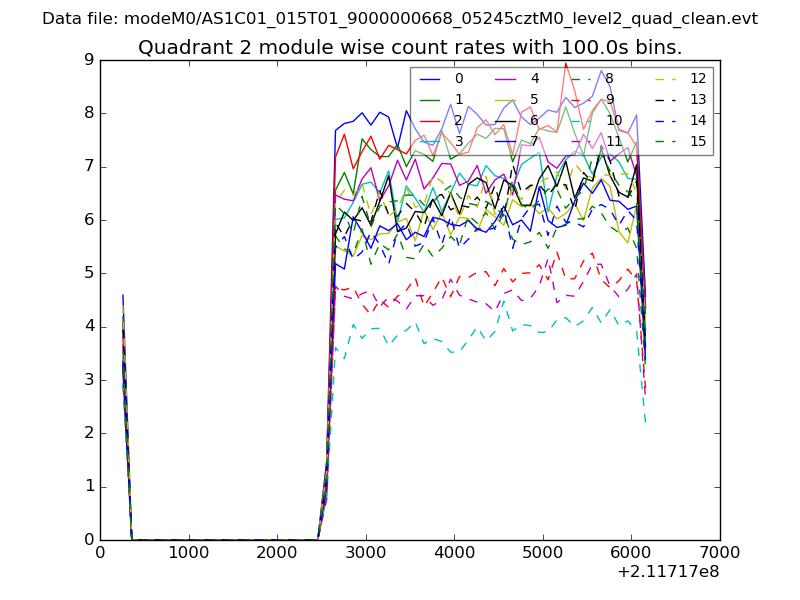
| Module-wise count rates for Quadrant B Data is divided into 100 sec bins |
 |
 |
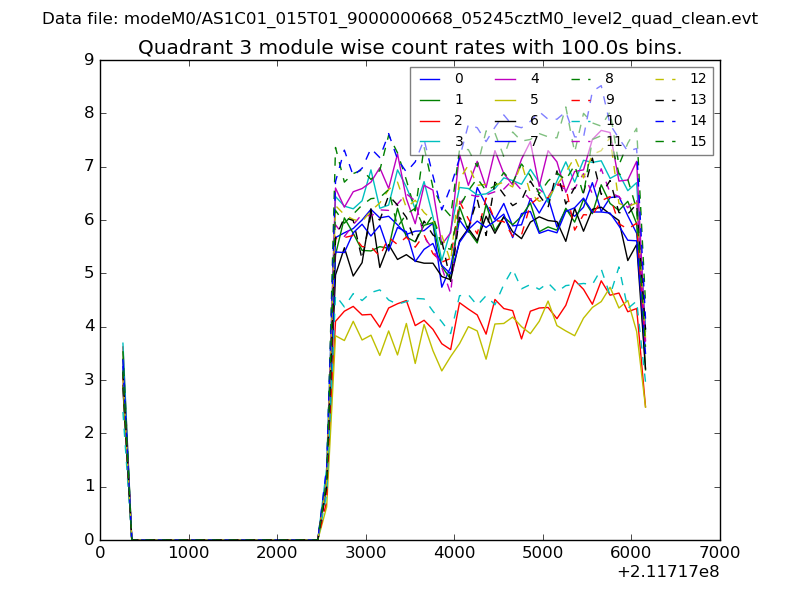
| Module-wise count rates for Quadrant C Data is divided into 100 sec bins |
 |
 |
| Module-wise count rates for Quadrant D Data is divided into 100 sec bins |
 |
 |
| Parameter | Plot |
|---|---|
| CZT HV Monitor | 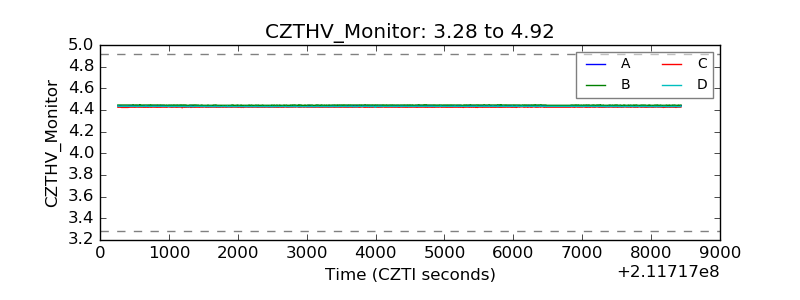 |
| D_VDD | 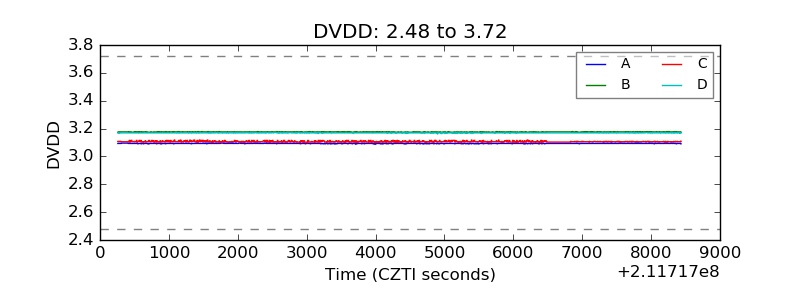 |
| Temperature 1 | 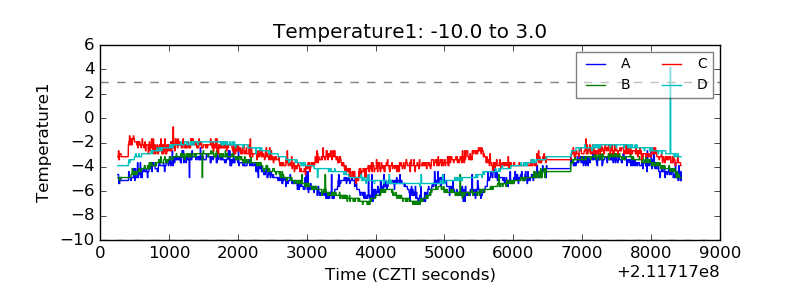 |
| Veto HV Monitor | 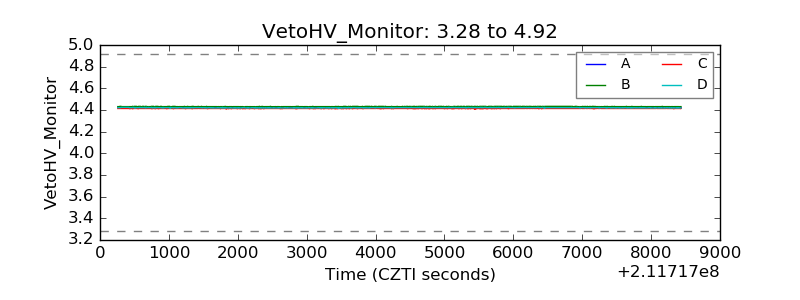 |
| Veto LLD | 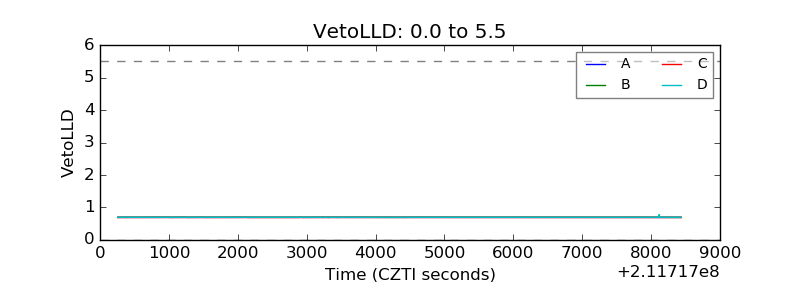 |
| Alpha Counter | 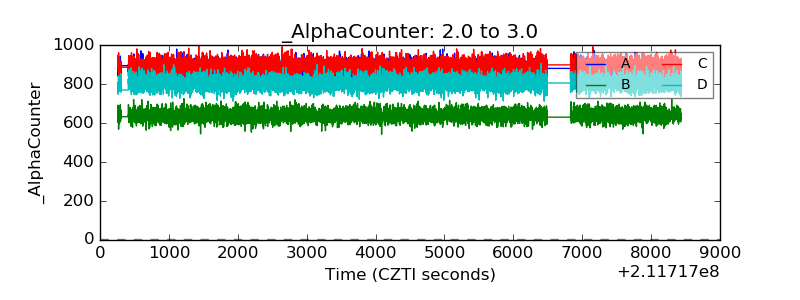 |
| _CPM_Rate | 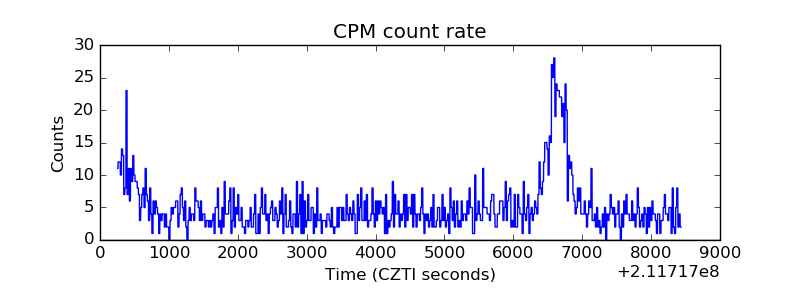 |
| CZT Counter | 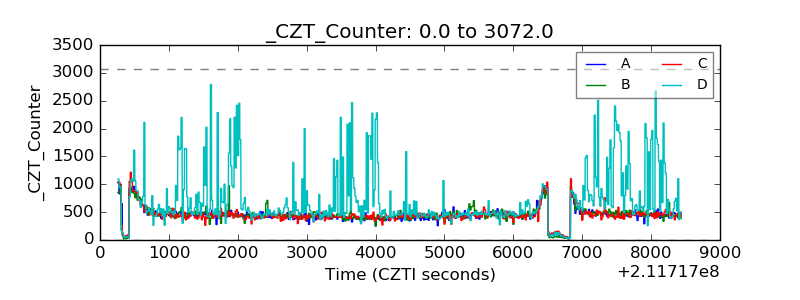 |
| +2.5 Volts monitor | 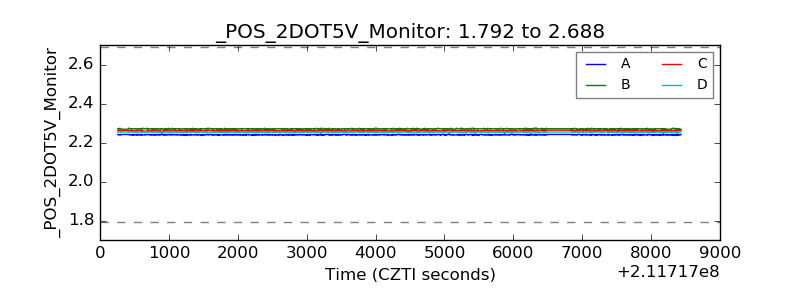 |
| +5 Volts monitor |  |
| _ROLL_ROT | 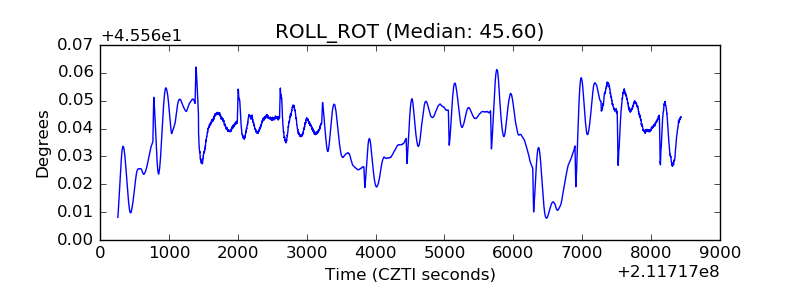 |
| _Roll_DEC | 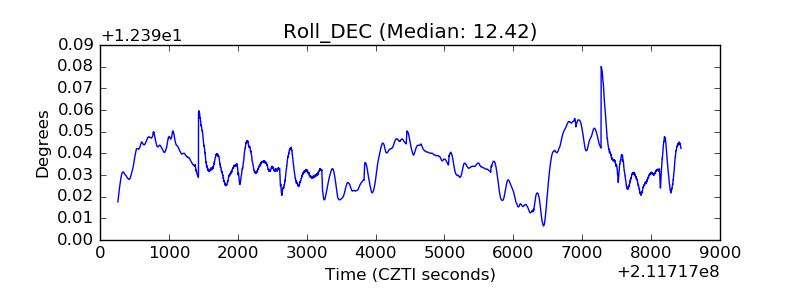 |
| _Roll_RA | 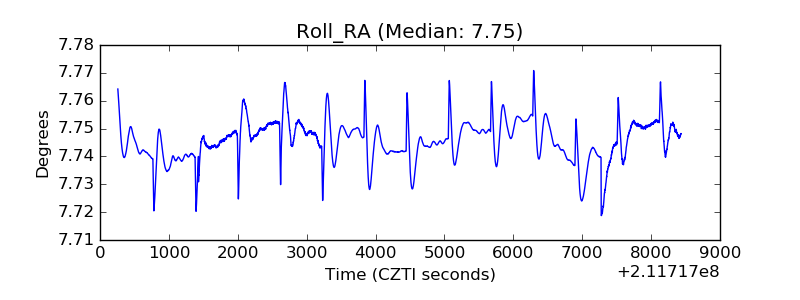 |
| Veto Counter | 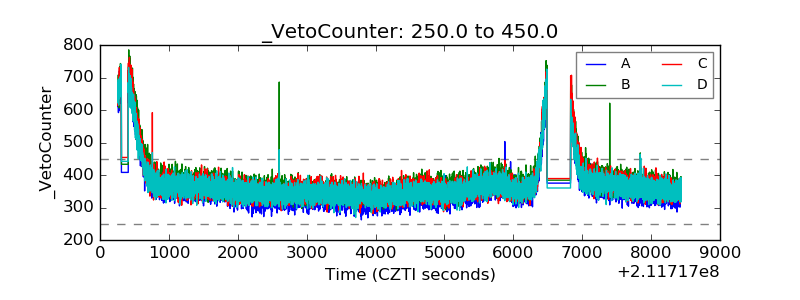 |