| Param | Original file | Final file |
|---|---|---|
| Filename | modeM0/AS1A02_028T01_9000000724_05604cztM0_level2.evt | modeM0/AS1A02_028T01_9000000724_05604cztM0_level2_quad_clean.evt |
| Size (bytes) | 484,482,240 | 87,992,640 |
| Size | 462.0 MB | 83.9 MB |
| Events in quadrant A | 3,224,542 | 555,832 |
| Events in quadrant B | 3,627,005 | 558,832 |
| Events in quadrant C | 3,264,510 | 549,976 |
| Events in quadrant D | 4,082,024 | 513,408 |
| Mode SS | |||
|---|---|---|---|
| Quadrant | BADHDUFLAG | Total packets | Discarded packets |
| A | 0 | 140 | 0 |
| B | 0 | 140 | 0 |
| C | 0 | 140 | 0 |
| D | 0 | 140 | 0 |
| Mode M0 | |||
|---|---|---|---|
| Quadrant | BADHDUFLAG | Total packets | Discarded packets |
| A | 0 | 14451 | 3 |
| B | 0 | 15351 | 2 |
| C | 0 | 14454 | 2 |
| D | 0 | 17226 | 2 |
| Mode M9 | |||
|---|---|---|---|
| Quadrant | BADHDUFLAG | Total packets | Discarded packets |
| A | 0 | 14 | 0 |
| B | 0 | 14 | 0 |
| C | 0 | 14 | 0 |
| D | 0 | 15 | 0 |
| Quadrant | Total seconds | Saturated seconds | Saturation percentage |
|---|---|---|---|
| A | 6991 | 67 | 0.958375% |
| B | 6991 | 68 | 0.972679% |
| C | 6991 | 59 | 0.843942% |
| D | 6991 | 295 | 4.219711% |
Noise dominated data is calculated using 1-second bins in cleaned event files. If a bin has >2000 counts, and if more than 50% of those come from <1% of pixels, then it is considered to be noise-dominated and hence unusable.
| Quadrant | # 1 sec bins | Bins with >0 counts | Bins with >2000 counts | High rate bins dominated by noise | Noise dominated (total time) | Noise dominated (detector-on time) | Marked lightcurve |
|---|---|---|---|---|---|---|---|
| A | 7671 | 6992 | 0 | 0 | 0.00% | 0.00% | 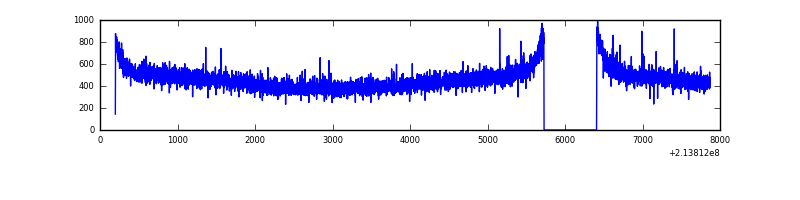 |
| B | 7671 | 6992 | 0 | 0 | 0.00% | 0.00% | 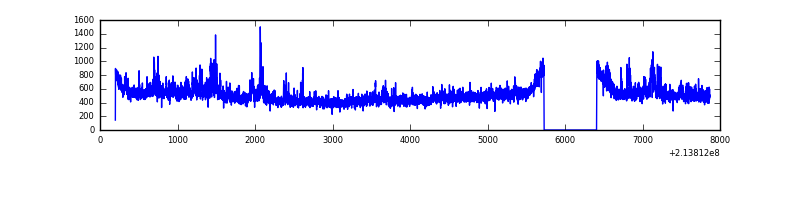 |
| C | 7671 | 6992 | 0 | 0 | 0.00% | 0.00% | 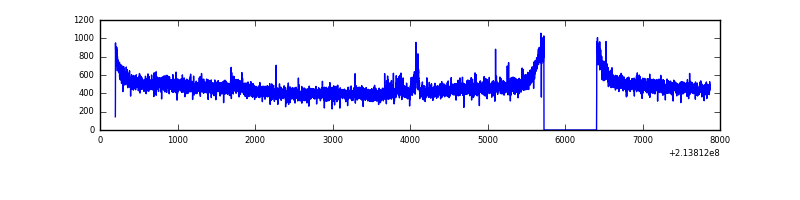 |
| D | 7671 | 6992 | 181 | 181 | 2.36% | 2.59% | 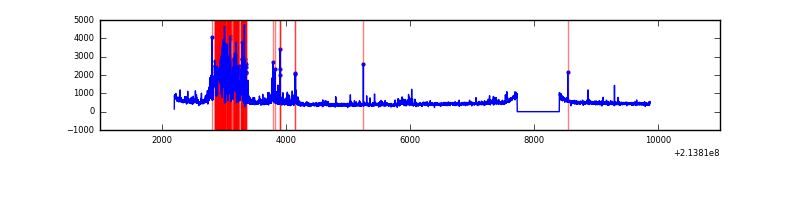 |
Top three noisy pixels from each quadrant. If the there are fewer than three noisy pixels in the level2.evt file, extra rows are filled as -1
| Pixel properties | Quadrant properties | ||||||
|---|---|---|---|---|---|---|---|
| Quadrant | DetID | PixID | Counts | Sigma | Mean | Median | Sigma |
| A | 12 | 194 | 8137 | 43.31 | 836 | 817 | 169.0 |
| A | 0 | 226 | 8131 | 43.27 | 836 | 817 | 169.0 |
| A | 13 | 14 | 5472 | 27.54 | 836 | 817 | 169.0 |
| B | 15 | 204 | 355689 | 2192.68 | 841 | 821 | 161.8 |
| B | 12 | 111 | 15301 | 89.47 | 841 | 821 | 161.8 |
| B | 0 | 219 | 13824 | 80.34 | 841 | 821 | 161.8 |
| C | 1 | 16 | 44184 | 228.93 | 818 | 822 | 189.4 |
| C | 7 | 247 | 26664 | 136.43 | 818 | 822 | 189.4 |
| C | 13 | 61 | 6496 | 29.96 | 818 | 822 | 189.4 |
| D | 2 | 63 | 718821 | 3673.06 | 807 | 782 | 195.5 |
| D | 2 | 136 | 257867 | 1315.09 | 807 | 782 | 195.5 |
| D | 13 | 238 | 26992 | 134.07 | 807 | 782 | 195.5 |
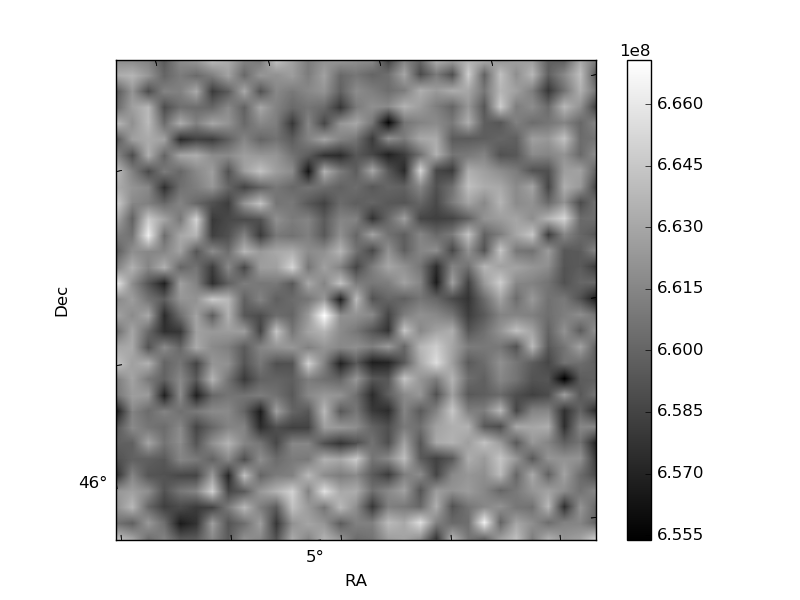
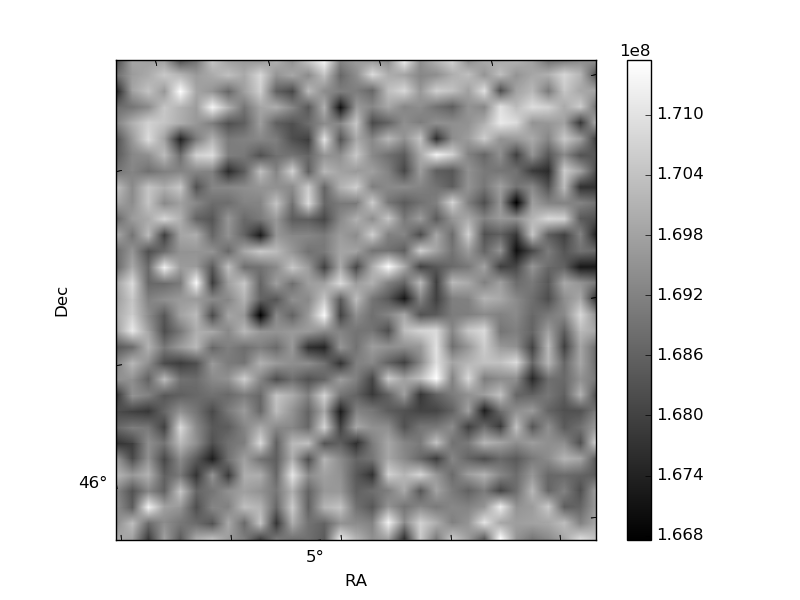
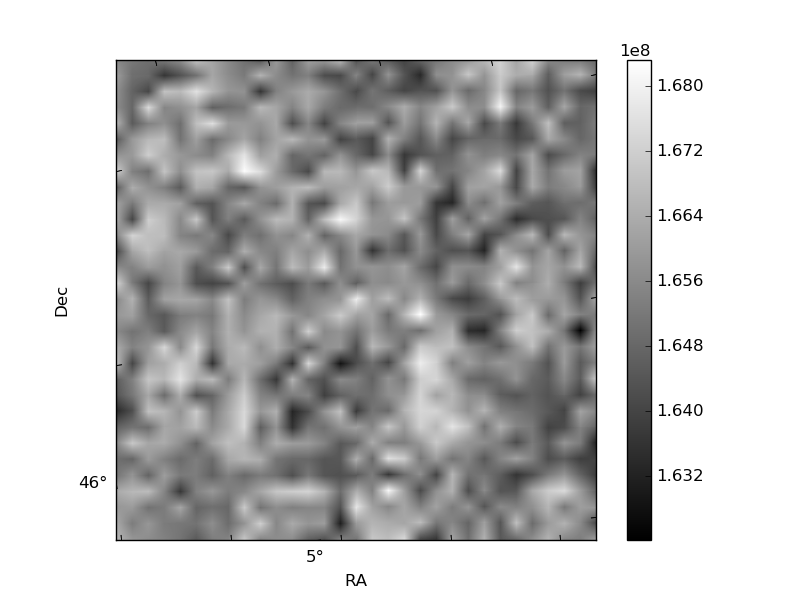
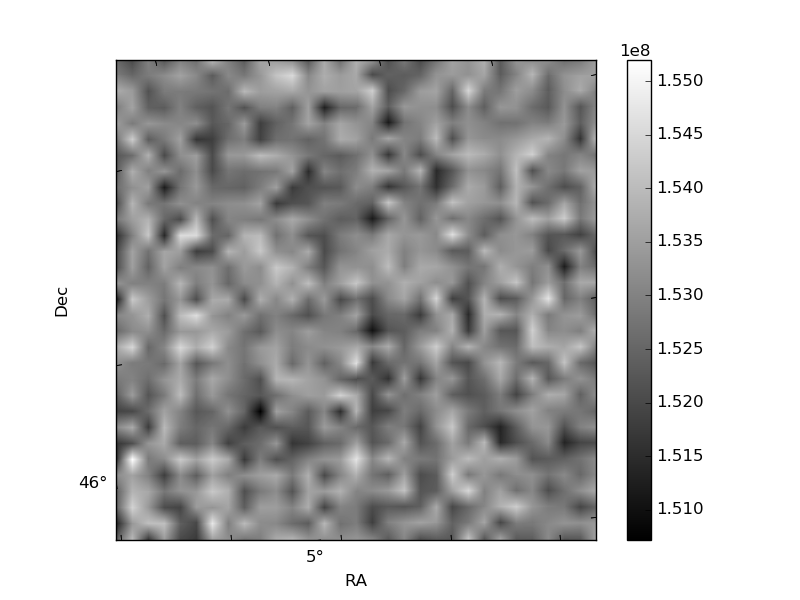
Histogram calculated using DETX and DETY for each event in the final _common_clean file
| Quadrant A | 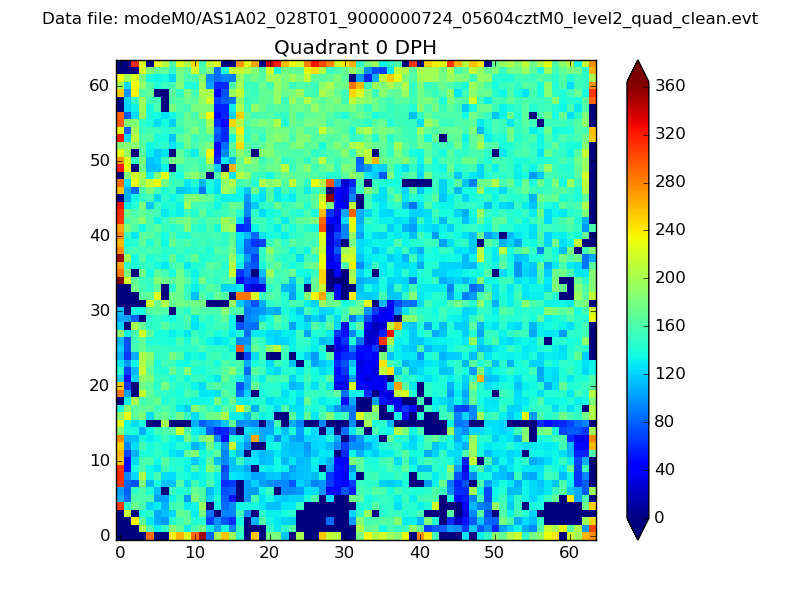 |
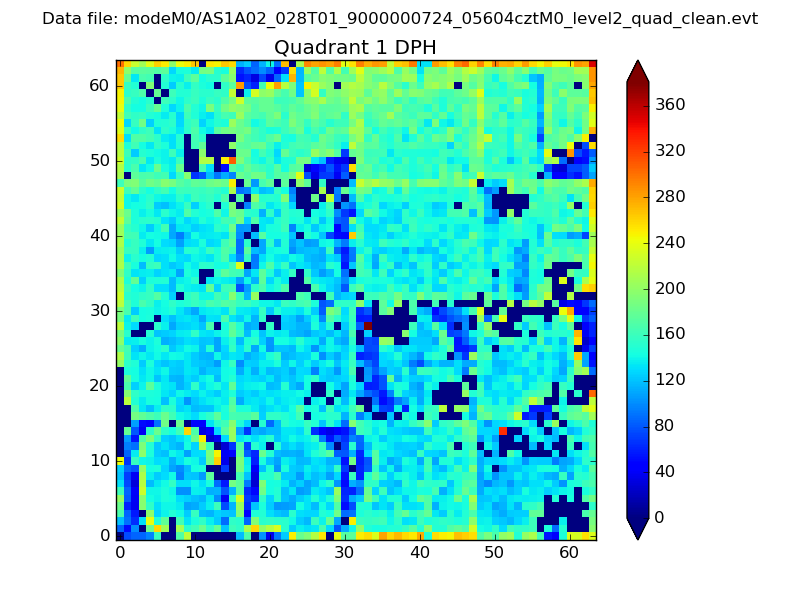 |
Quadrant B |
|---|---|---|---|
| Quadrant D | 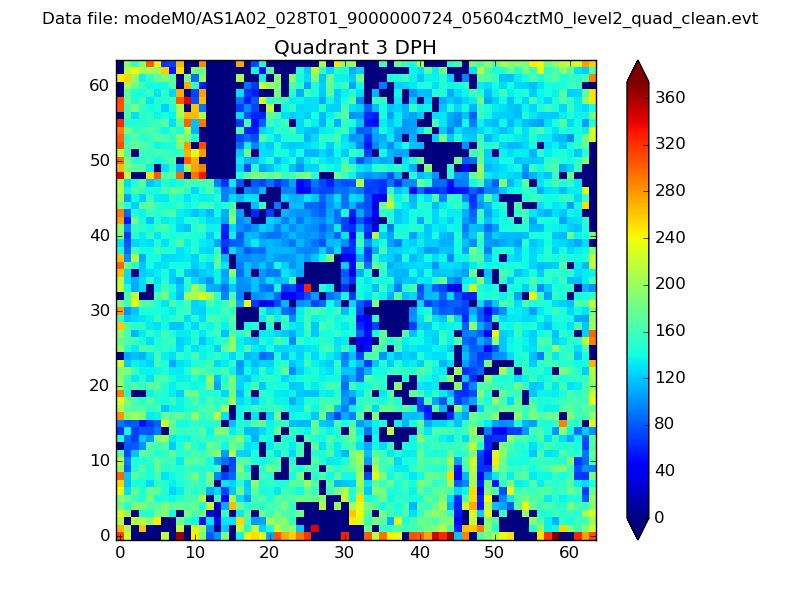 |
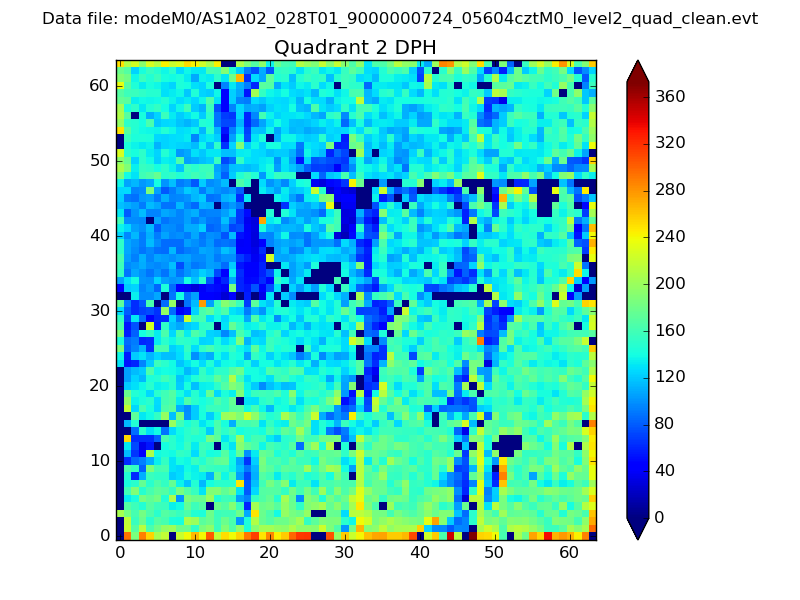 |
Quadrant C |
| Plot type | Count rate plots | Images |
|---|---|---|
| Comparison with Poisson distribution Blue bars denote a histogram of data divided into 1 sec bins. Red curve is a Poisson curve with rate = median count rate of data. |
 |
 |
| Quadrant-wise count rates Data is divided into 100 sec bins |
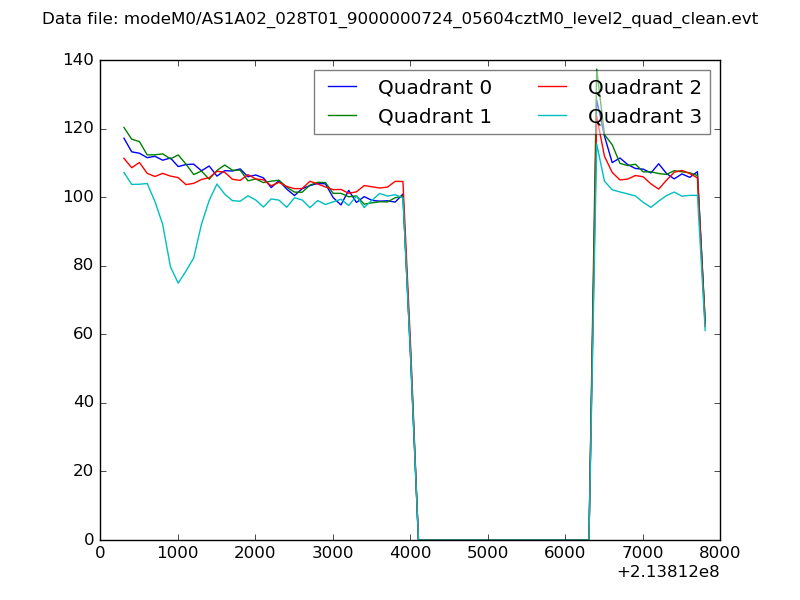 |
|
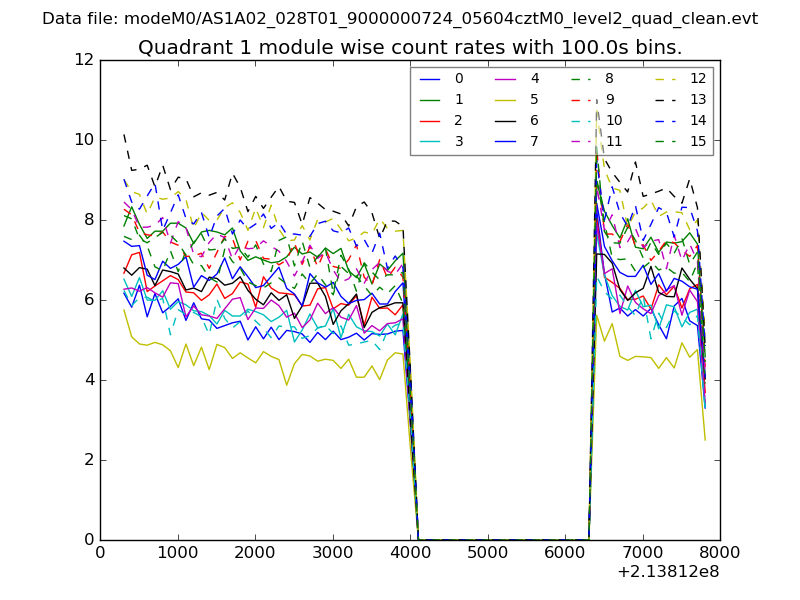
| Module-wise count rates for Quadrant A Data is divided into 100 sec bins |
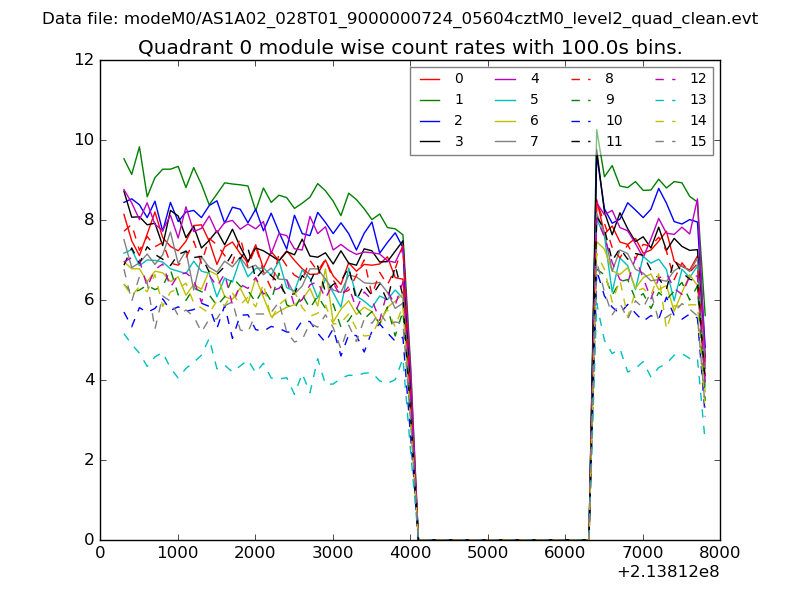 |
 |
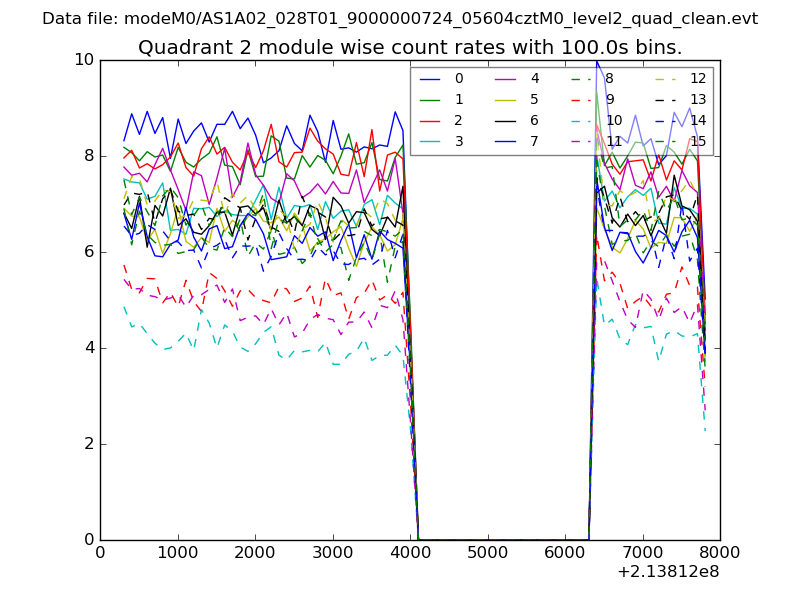
| Module-wise count rates for Quadrant B Data is divided into 100 sec bins |
 |
 |
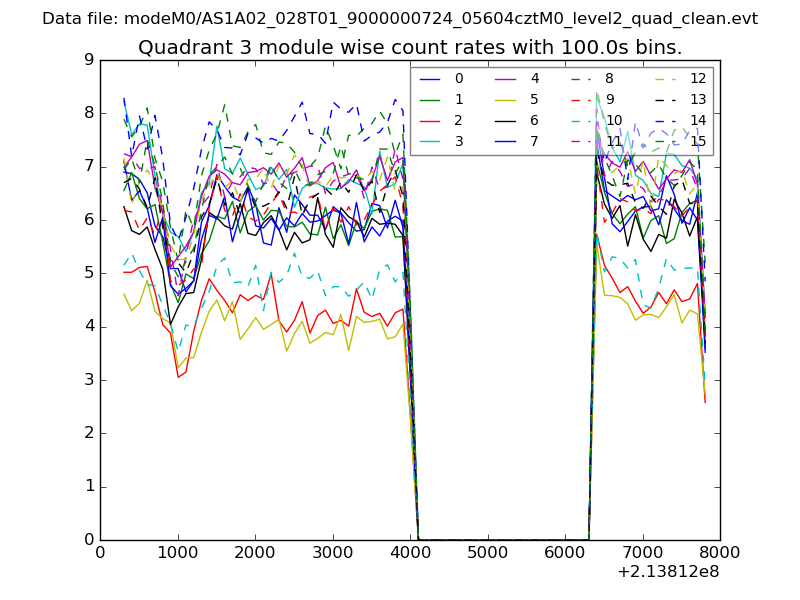
| Module-wise count rates for Quadrant C Data is divided into 100 sec bins |
 |
 |
| Module-wise count rates for Quadrant D Data is divided into 100 sec bins |
 |
 |
| Parameter | Plot |
|---|---|
| CZT HV Monitor | 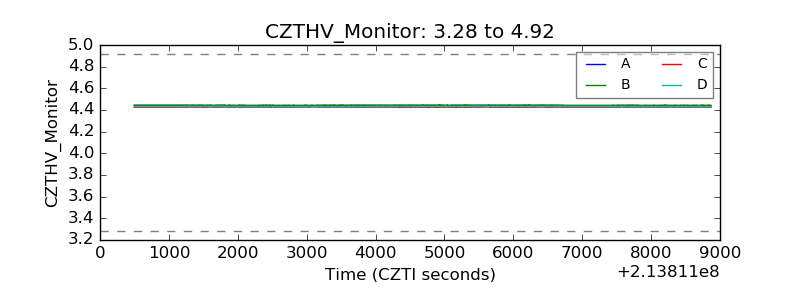 |
| D_VDD | 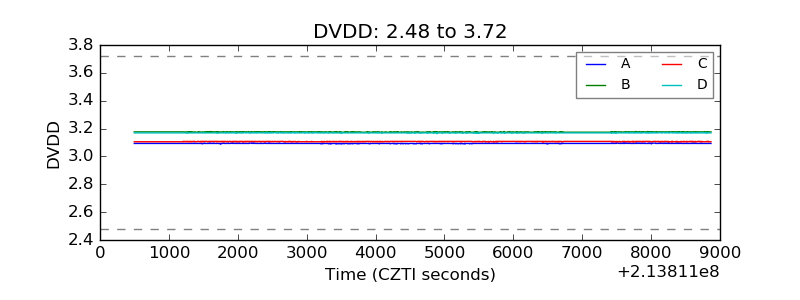 |
| Temperature 1 | 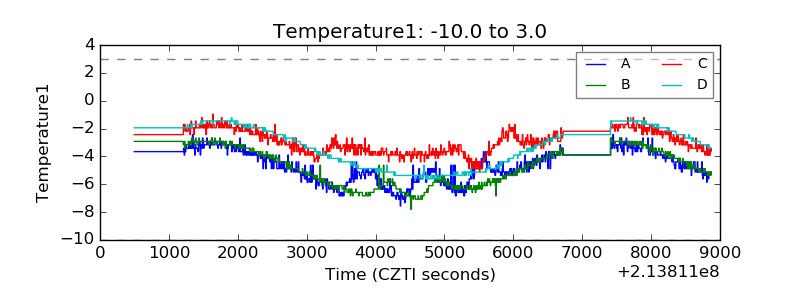 |
| Veto HV Monitor | 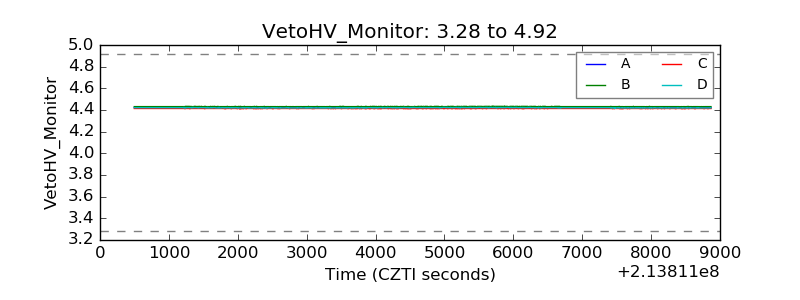 |
| Veto LLD | 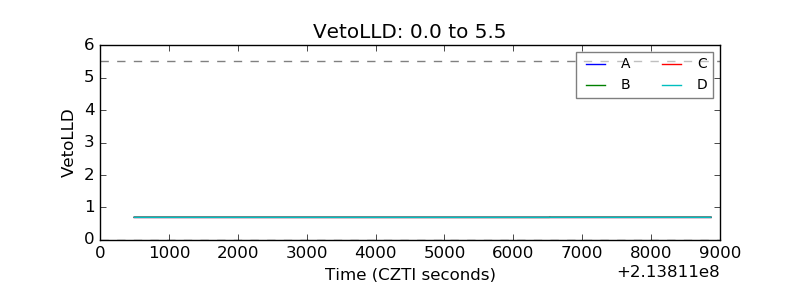 |
| Alpha Counter | 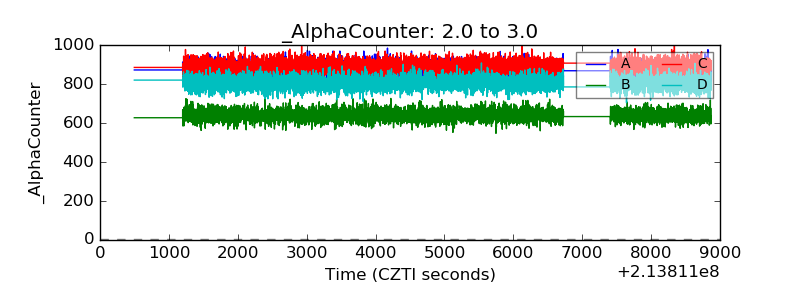 |
| _CPM_Rate | 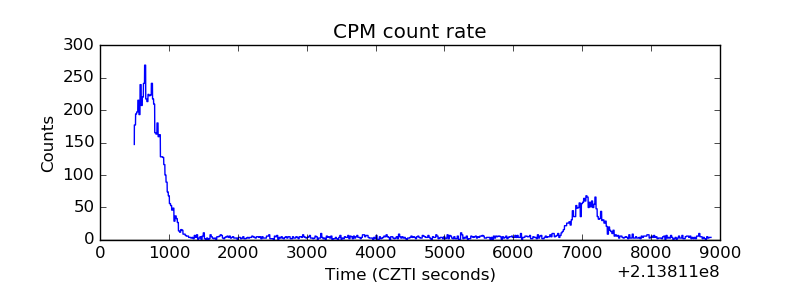 |
| CZT Counter | 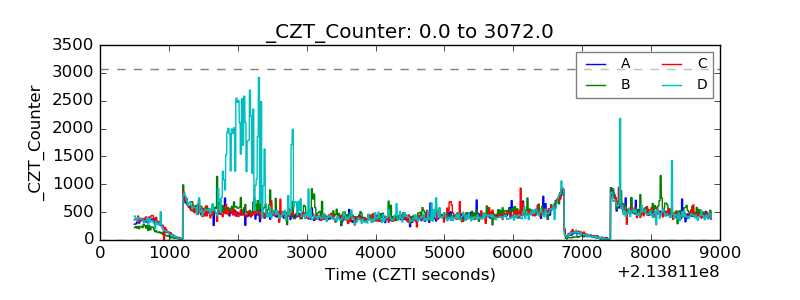 |
| +2.5 Volts monitor |  |
| +5 Volts monitor |  |
| _ROLL_ROT | 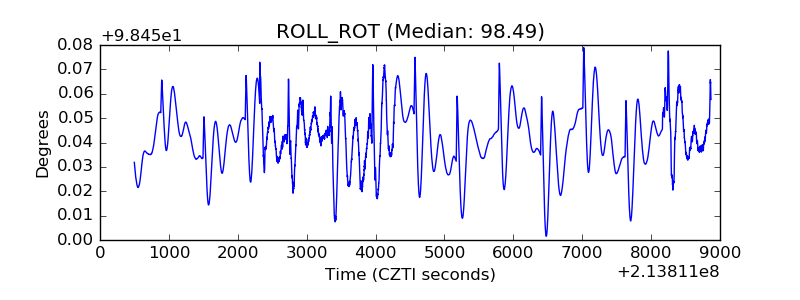 |
| _Roll_DEC | 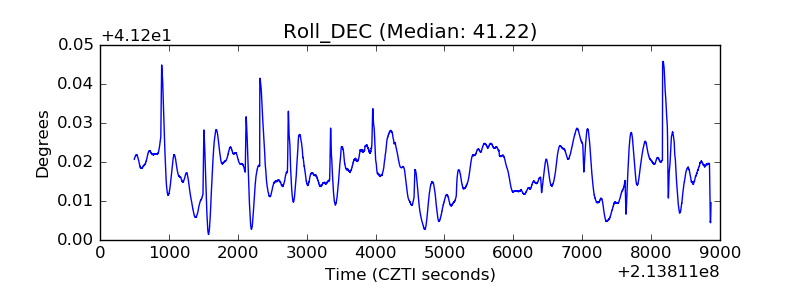 |
| _Roll_RA | 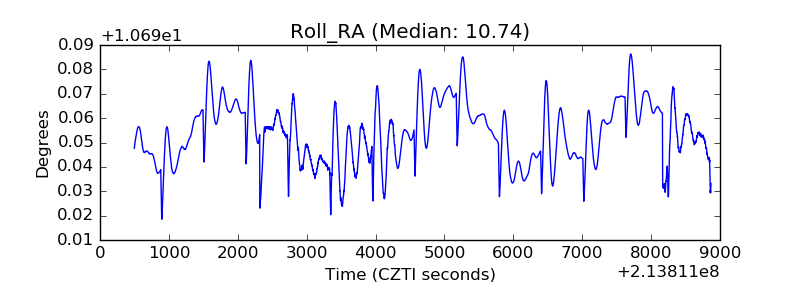 |
| Veto Counter | 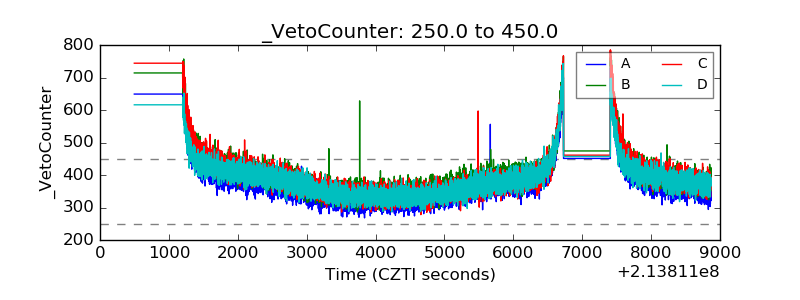 |