| Param | Original file | Final file |
|---|---|---|
| Filename | modeM0/AS1A02_006T01_9000000776_06025cztM0_level2.evt | modeM0/AS1A02_006T01_9000000776_06025cztM0_level2_quad_clean.evt |
| Size (bytes) | 314,228,160 | 68,408,640 |
| Size | 299.7 MB | 65.2 MB |
| Events in quadrant A | 2,594,003 | 406,961 |
| Events in quadrant B | 2,322,489 | 421,533 |
| Events in quadrant C | 2,134,560 | 417,374 |
| Events in quadrant D | 2,150,805 | 502,693 |
| Mode M9 | |||
|---|---|---|---|
| Quadrant | BADHDUFLAG | Total packets | Discarded packets |
| A | 0 | 4 | 1 |
| B | 0 | 4 | 0 |
| C | 0 | 5 | 1 |
| D | 0 | 5 | 2 |
| Mode SS | |||
|---|---|---|---|
| Quadrant | BADHDUFLAG | Total packets | Discarded packets |
| A | 0 | 154 | 56 |
| B | 0 | 154 | 62 |
| C | 0 | 152 | 62 |
| D | 0 | 150 | 63 |
| Mode M0 | |||
|---|---|---|---|
| Quadrant | BADHDUFLAG | Total packets | Discarded packets |
| A | 0 | 17856 | 7277 |
| B | 0 | 17118 | 7343 |
| C | 0 | 15965 | 6326 |
| D | 0 | 16129 | 6288 |
| Quadrant | Total seconds | Saturated seconds | Saturation percentage |
|---|---|---|---|
| A | 4515 | 216 | 4.784053% |
| B | 4486 | 227 | 5.060187% |
| C | 4608 | 187 | 4.058160% |
| D | 4660 | 160 | 3.433476% |
Noise dominated data is calculated using 1-second bins in cleaned event files. If a bin has >2000 counts, and if more than 50% of those come from <1% of pixels, then it is considered to be noise-dominated and hence unusable.
| Quadrant | # 1 sec bins | Bins with >0 counts | Bins with >2000 counts | High rate bins dominated by noise | Noise dominated (total time) | Noise dominated (detector-on time) | Marked lightcurve |
|---|---|---|---|---|---|---|---|
| A | 7767 | 5743 | 0 | 0 | 0.00% | 0.00% | 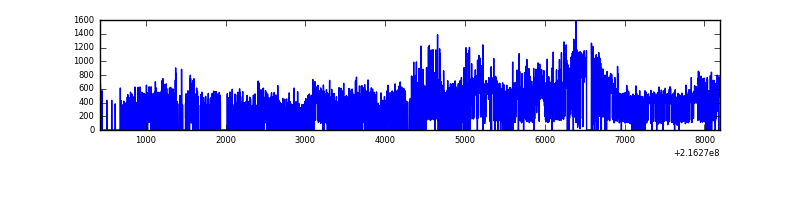 |
| B | 7767 | 5704 | 8 | 8 | 0.10% | 0.14% | 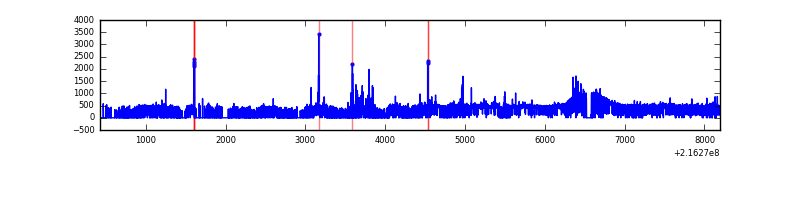 |
| C | 7767 | 5814 | 0 | 0 | 0.00% | 0.00% | 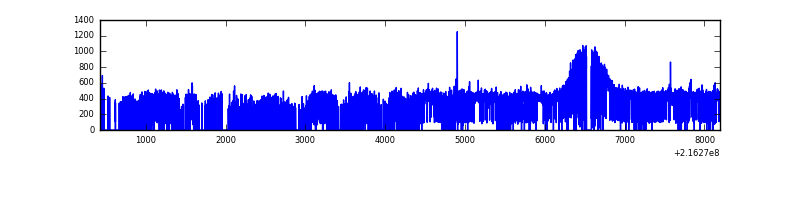 |
| D | 7767 | 5846 | 0 | 0 | 0.00% | 0.00% | 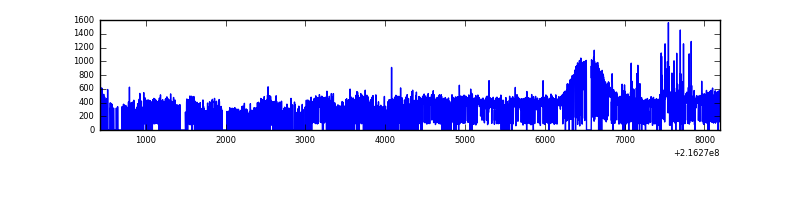 |
Top three noisy pixels from each quadrant. If the there are fewer than three noisy pixels in the level2.evt file, extra rows are filled as -1
| Pixel properties | Quadrant properties | ||||||
|---|---|---|---|---|---|---|---|
| Quadrant | DetID | PixID | Counts | Sigma | Mean | Median | Sigma |
| A | 13 | 34 | 515415 | 4561.33 | 538 | 524 | 112.9 |
| A | 0 | 226 | 5238 | 41.76 | 538 | 524 | 112.9 |
| A | 12 | 194 | 5137 | 40.87 | 538 | 524 | 112.9 |
| B | 3 | 64 | 100606 | 930.06 | 541 | 526 | 107.6 |
| B | 15 | 204 | 83394 | 770.1 | 541 | 526 | 107.6 |
| B | 4 | 172 | 12343 | 109.82 | 541 | 526 | 107.6 |
| C | 9 | 16 | 4857 | 33.98 | 541 | 544 | 126.9 |
| C | 8 | 128 | 4740 | 33.06 | 541 | 544 | 126.9 |
| C | 13 | 61 | 4290 | 29.52 | 541 | 544 | 126.9 |
| D | 2 | 63 | 40107 | 293.67 | 544 | 526 | 134.8 |
| D | 14 | 34 | 27812 | 202.45 | 544 | 526 | 134.8 |
| D | 8 | 195 | 21390 | 154.8 | 544 | 526 | 134.8 |
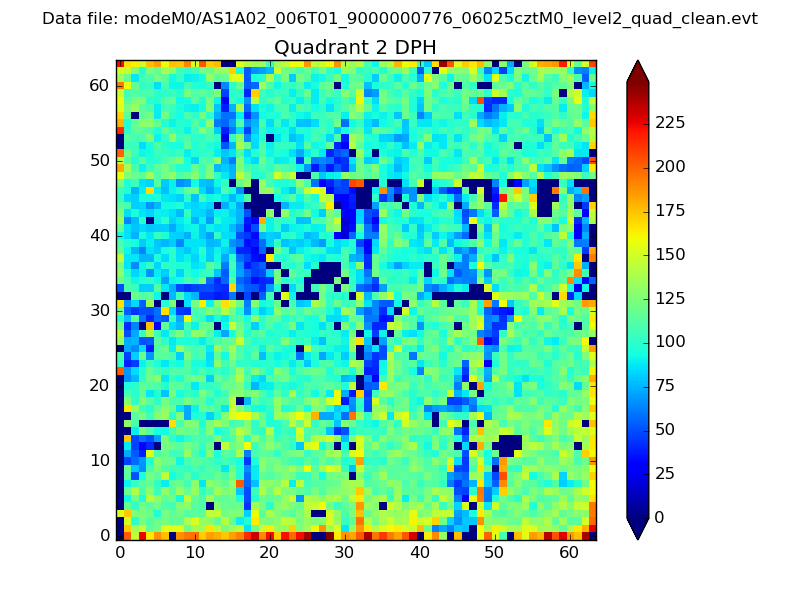
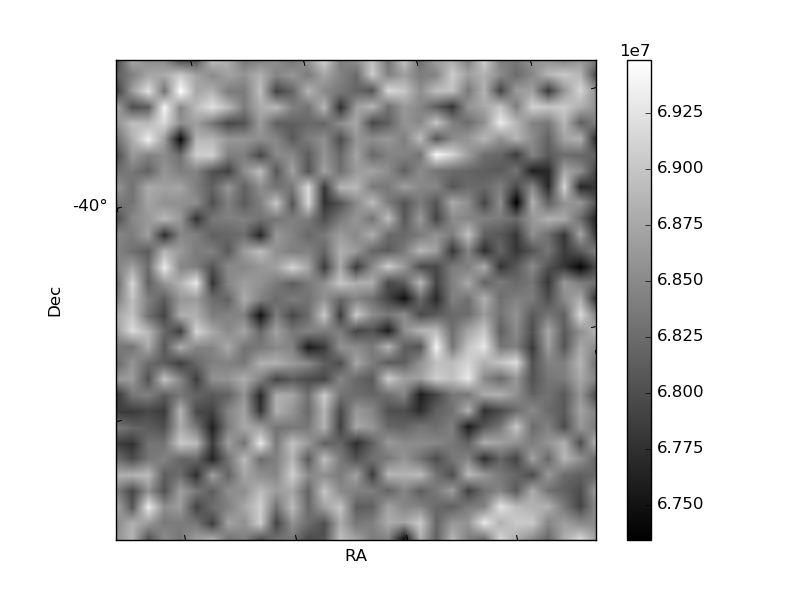
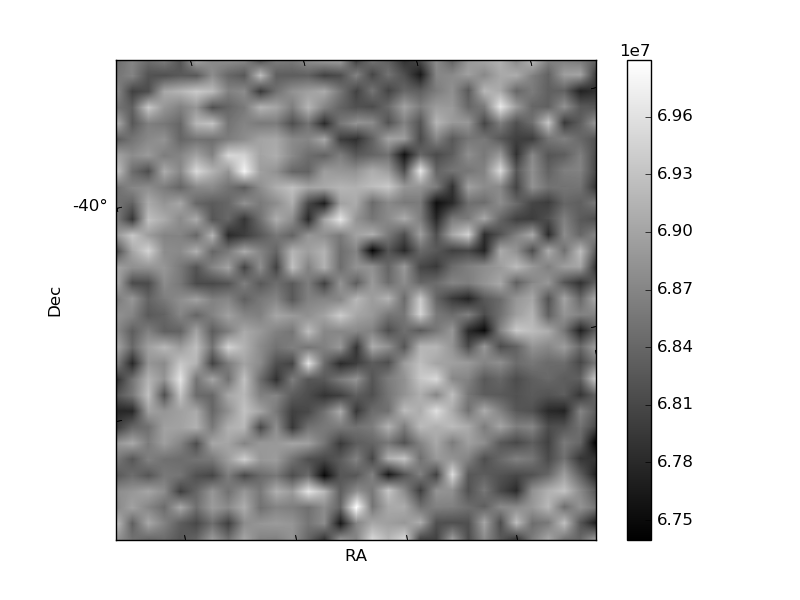
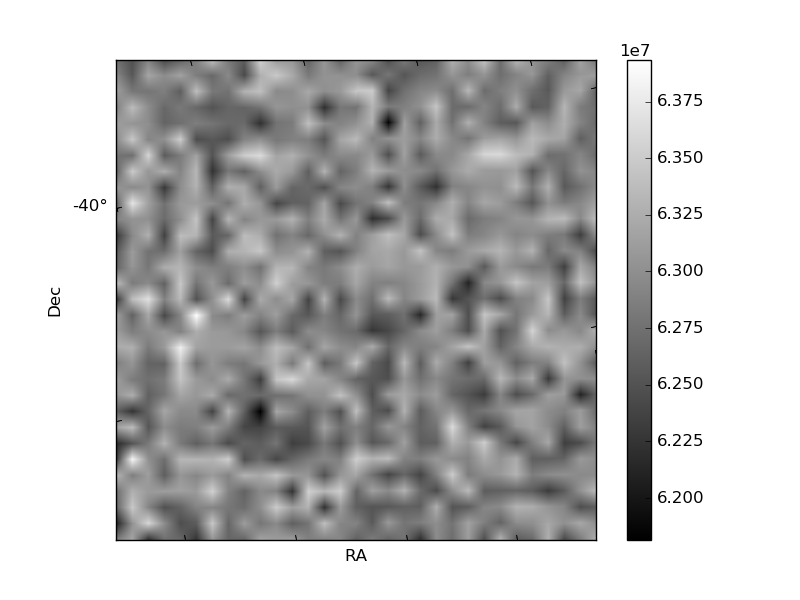
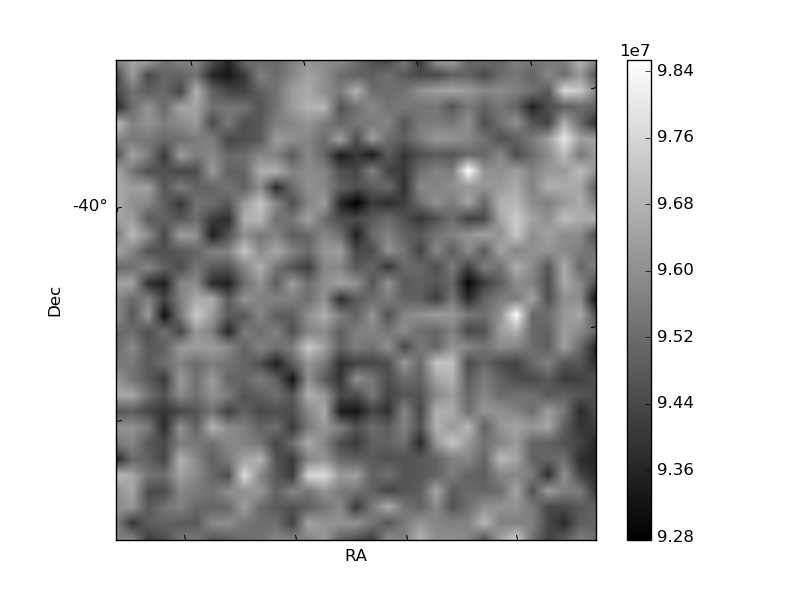
Histogram calculated using DETX and DETY for each event in the final _common_clean file
| Quadrant A | 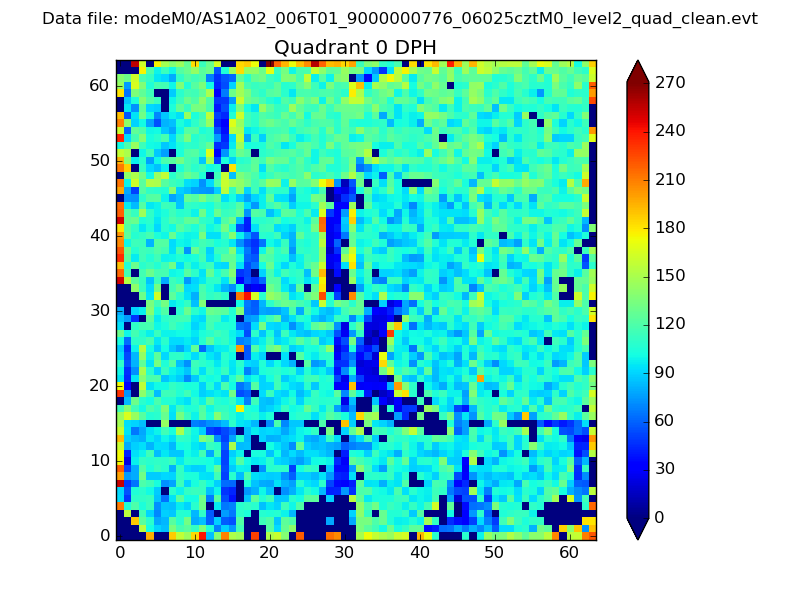 |
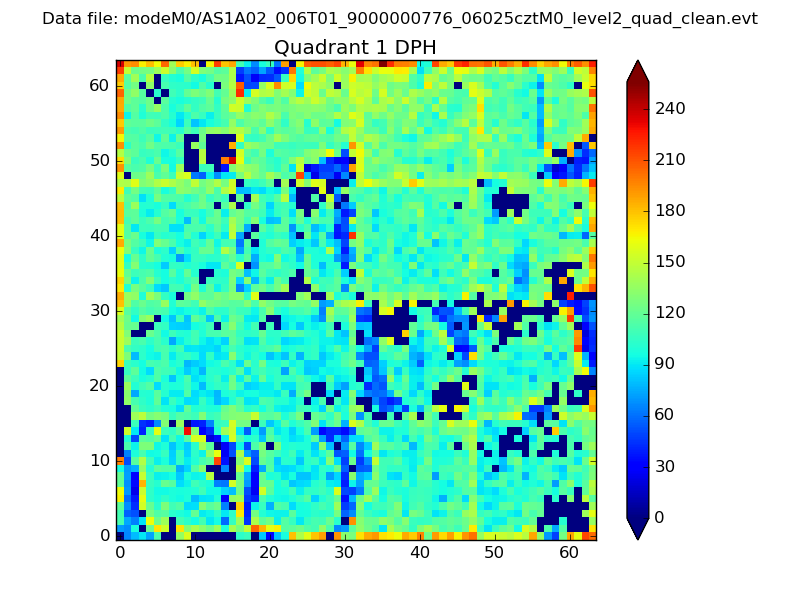 |
Quadrant B |
|---|---|---|---|
| Quadrant D | 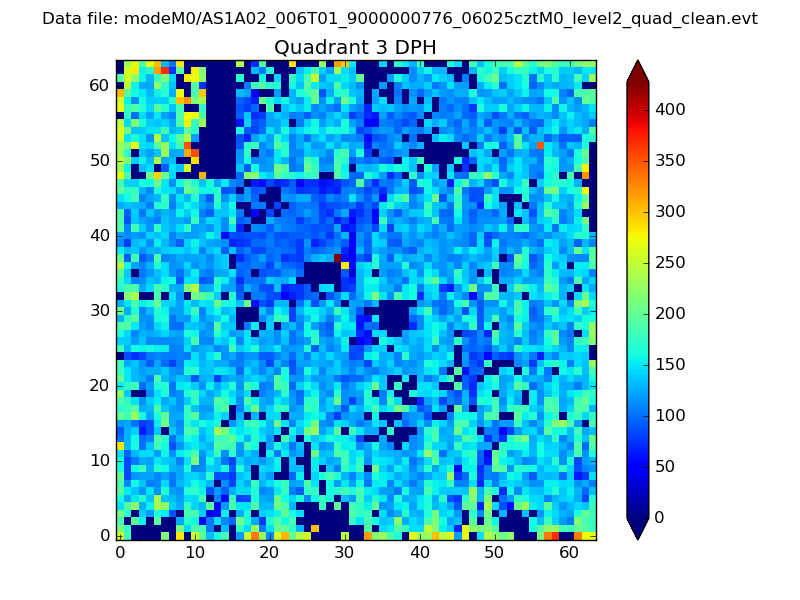 |
 |
Quadrant C |
| Plot type | Count rate plots | Images |
|---|---|---|
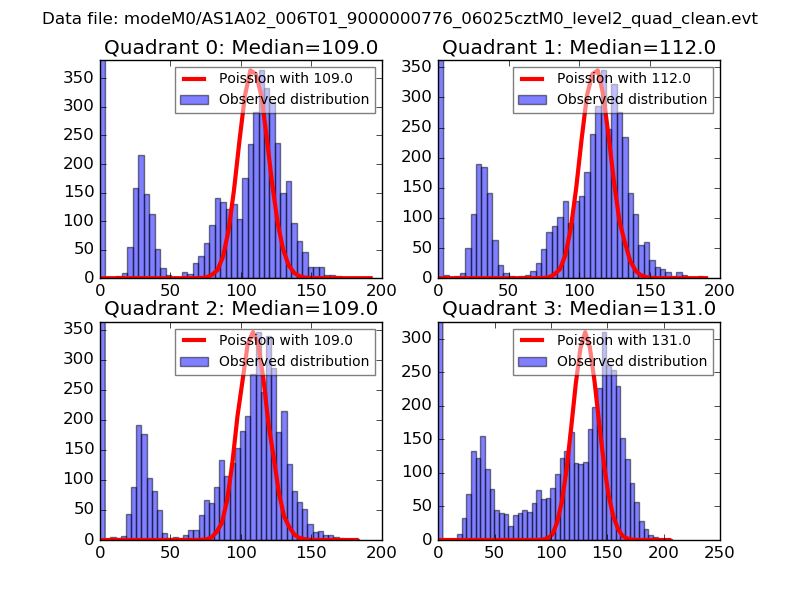
| Comparison with Poisson distribution Blue bars denote a histogram of data divided into 1 sec bins. Red curve is a Poisson curve with rate = median count rate of data. |
 |
 |
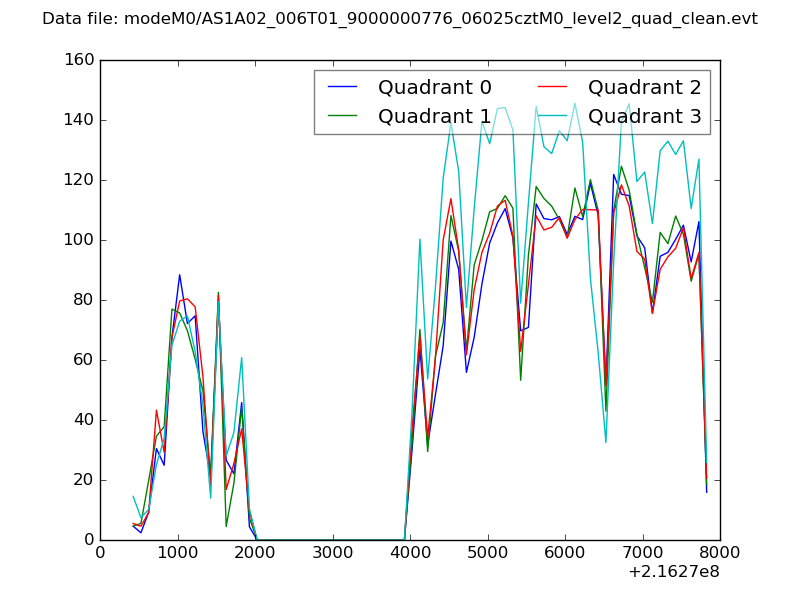
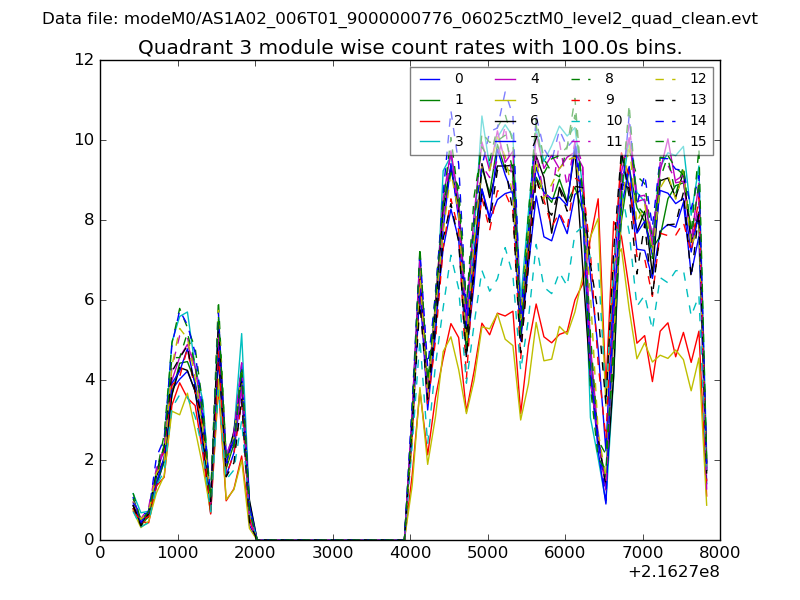
| Quadrant-wise count rates Data is divided into 100 sec bins |
 |
|
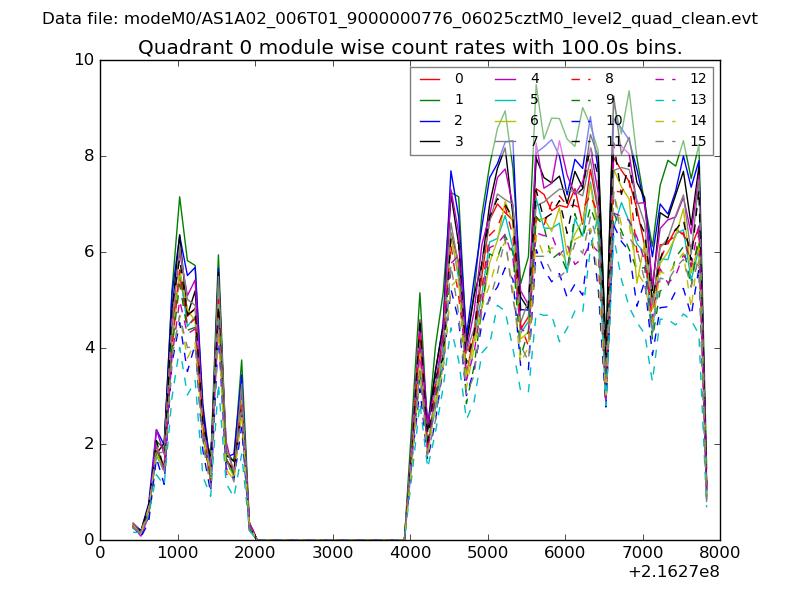
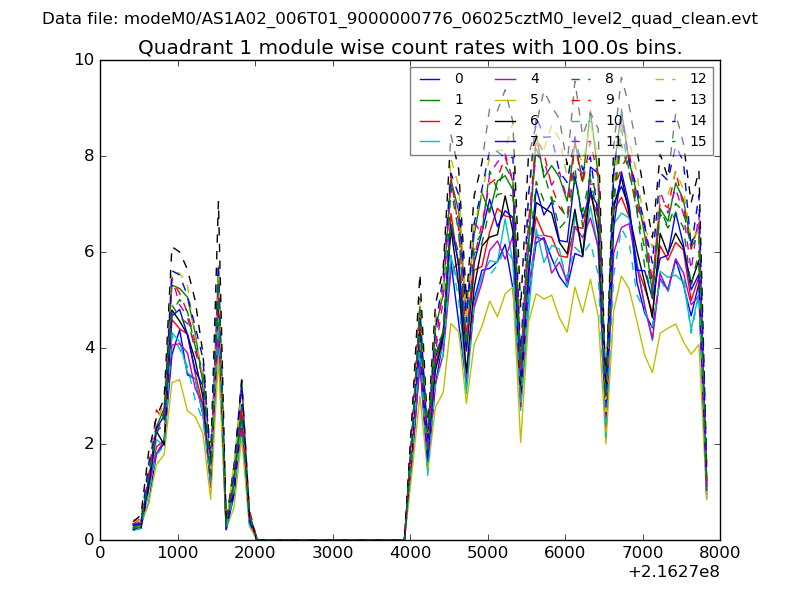
| Module-wise count rates for Quadrant A Data is divided into 100 sec bins |
 |
 |
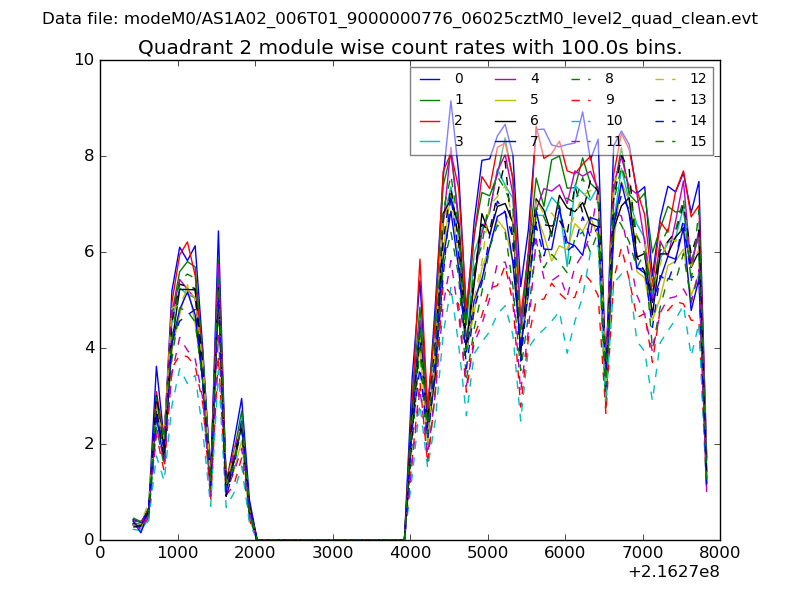
| Module-wise count rates for Quadrant B Data is divided into 100 sec bins |
 |
 |
| Module-wise count rates for Quadrant C Data is divided into 100 sec bins |
 |
 |
| Module-wise count rates for Quadrant D Data is divided into 100 sec bins |
 |
 |
| Parameter | Plot |
|---|---|
| CZT HV Monitor | 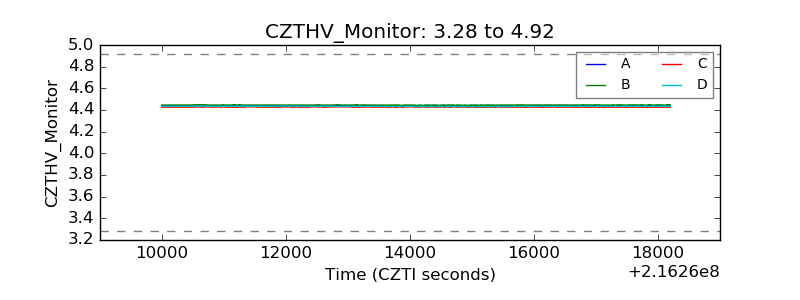 |
| D_VDD | 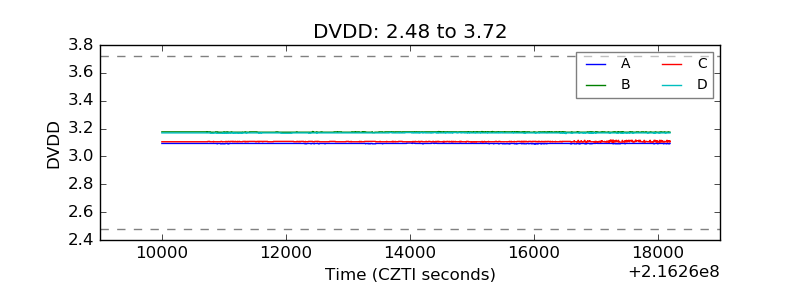 |
| Temperature 1 | 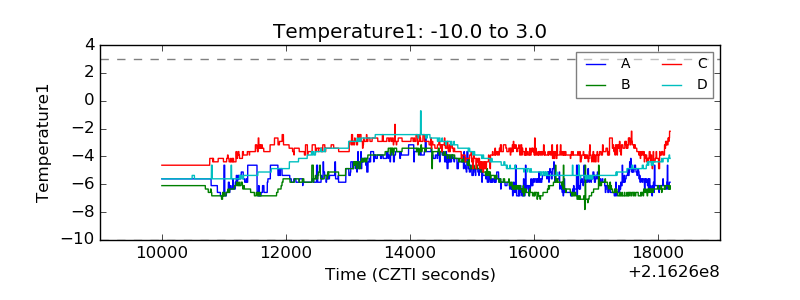 |
| Veto HV Monitor | 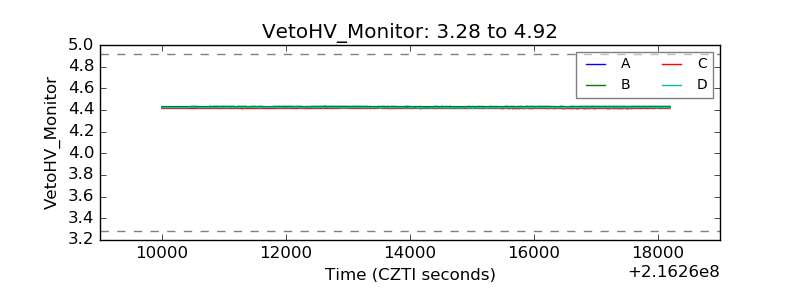 |
| Veto LLD | 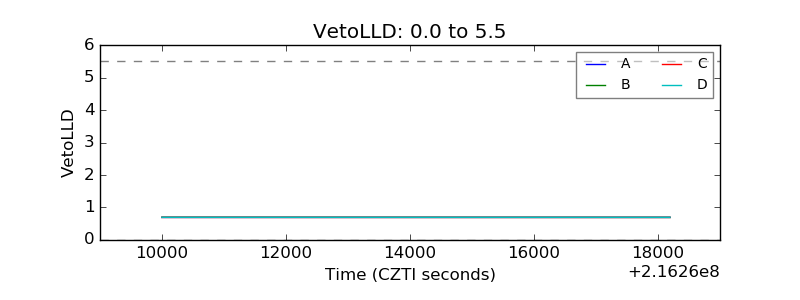 |
| Alpha Counter | 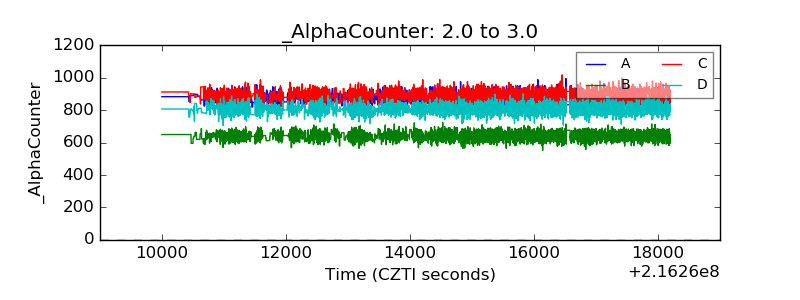 |
| _CPM_Rate | 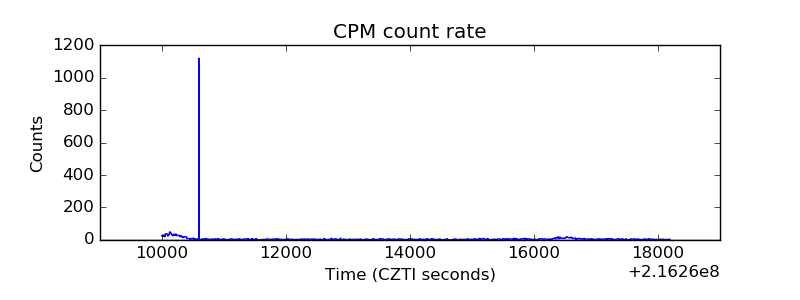 |
| CZT Counter | 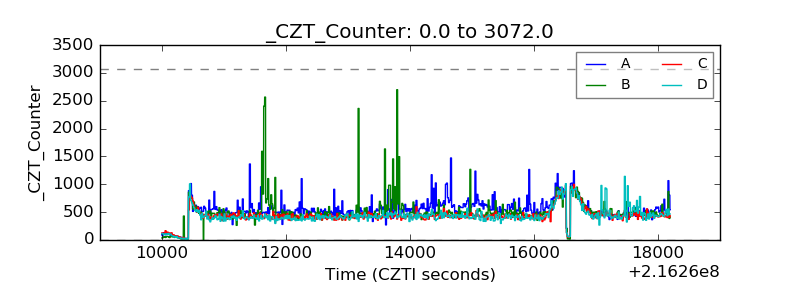 |
| +2.5 Volts monitor | 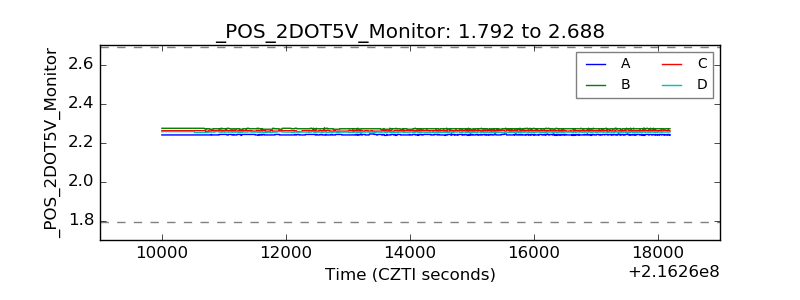 |
| +5 Volts monitor |  |
| _ROLL_ROT | 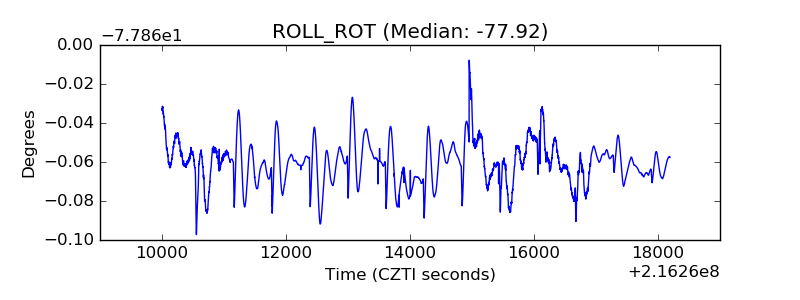 |
| _Roll_DEC |  |
| _Roll_RA | 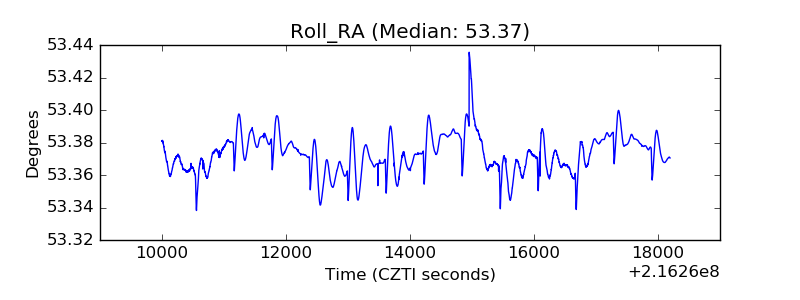 |
| Veto Counter | 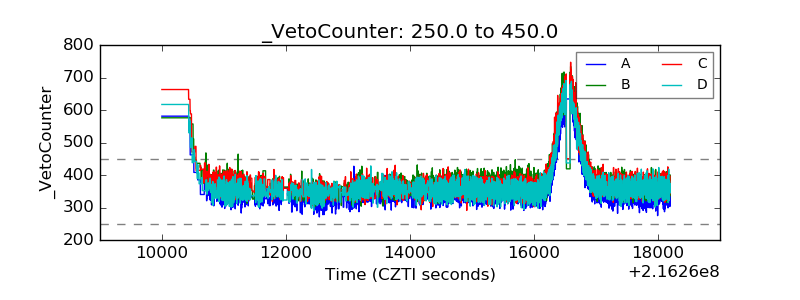 |