| Param | Original file | Final file |
|---|---|---|
| Filename | modeM0/AS1G06_103T01_9000000812_06221cztM0_level2.evt | modeM0/AS1G06_103T01_9000000812_06221cztM0_level2_quad_clean.evt |
| Size (bytes) | 291,222,720 | 64,154,880 |
| Size | 277.7 MB | 61.2 MB |
| Events in quadrant A | 2,141,782 | 409,250 |
| Events in quadrant B | 2,173,874 | 415,279 |
| Events in quadrant C | 2,058,323 | 407,079 |
| Events in quadrant D | 2,130,539 | 387,152 |
| Mode SS | |||
|---|---|---|---|
| Quadrant | BADHDUFLAG | Total packets | Discarded packets |
| A | 0 | 106 | 18 |
| B | 0 | 106 | 8 |
| C | 0 | 106 | 10 |
| D | 0 | 106 | 18 |
| Mode M9 | |||
|---|---|---|---|
| Quadrant | BADHDUFLAG | Total packets | Discarded packets |
| A | 0 | 12 | 0 |
| B | 0 | 12 | 1 |
| C | 0 | 12 | 3 |
| D | 0 | 13 | 1 |
| Mode M0 | |||
|---|---|---|---|
| Quadrant | BADHDUFLAG | Total packets | Discarded packets |
| A | 0 | 10712 | 1205 |
| B | 0 | 10735 | 1244 |
| C | 0 | 10529 | 1111 |
| D | 0 | 10779 | 1210 |
| Quadrant | Total seconds | Saturated seconds | Saturation percentage |
|---|---|---|---|
| A | 4609 | 79 | 1.714038% |
| B | 4592 | 66 | 1.437282% |
| C | 4630 | 38 | 0.820734% |
| D | 4597 | 48 | 1.044159% |
Noise dominated data is calculated using 1-second bins in cleaned event files. If a bin has >2000 counts, and if more than 50% of those come from <1% of pixels, then it is considered to be noise-dominated and hence unusable.
| Quadrant | # 1 sec bins | Bins with >0 counts | Bins with >2000 counts | High rate bins dominated by noise | Noise dominated (total time) | Noise dominated (detector-on time) | Marked lightcurve |
|---|---|---|---|---|---|---|---|
| A | 5170 | 4961 | 0 | 0 | 0.00% | 0.00% | 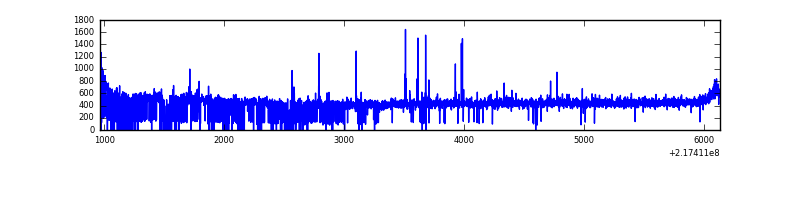 |
| B | 5170 | 4968 | 1 | 1 | 0.02% | 0.02% | 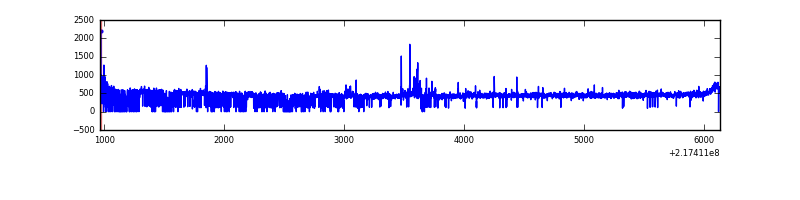 |
| C | 5170 | 4995 | 0 | 0 | 0.00% | 0.00% | 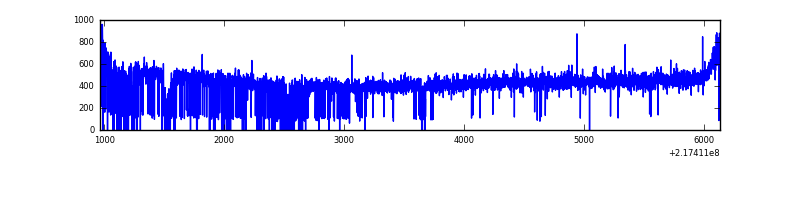 |
| D | 5170 | 4976 | 1 | 1 | 0.02% | 0.02% | 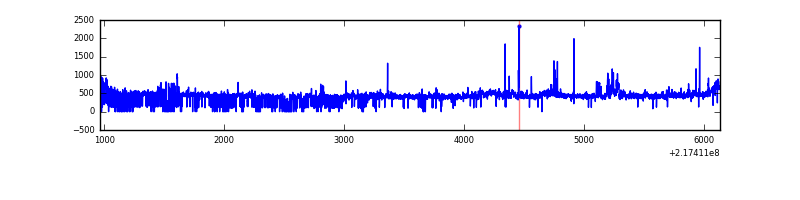 |
Top three noisy pixels from each quadrant. If the there are fewer than three noisy pixels in the level2.evt file, extra rows are filled as -1
| Pixel properties | Quadrant properties | ||||||
|---|---|---|---|---|---|---|---|
| Quadrant | DetID | PixID | Counts | Sigma | Mean | Median | Sigma |
| A | 0 | 31 | 34123 | 301.87 | 539 | 527 | 111.3 |
| A | 8 | 15 | 18337 | 160.03 | 539 | 527 | 111.3 |
| A | 15 | 236 | 6098 | 50.06 | 539 | 527 | 111.3 |
| B | 10 | 246 | 23078 | 214.41 | 541 | 527 | 105.2 |
| B | 0 | 219 | 15581 | 143.13 | 541 | 527 | 105.2 |
| B | 15 | 204 | 13516 | 123.5 | 541 | 527 | 105.2 |
| C | 1 | 16 | 4358 | 31.56 | 525 | 528 | 121.3 |
| C | 13 | 61 | 4133 | 29.71 | 525 | 528 | 121.3 |
| C | 9 | 54 | 2270 | 14.35 | 525 | 528 | 121.3 |
| D | 2 | 63 | 113100 | 872.13 | 524 | 508 | 129.1 |
| D | 2 | 136 | 17880 | 134.56 | 524 | 508 | 129.1 |
| D | 7 | 55 | 9866 | 72.49 | 524 | 508 | 129.1 |
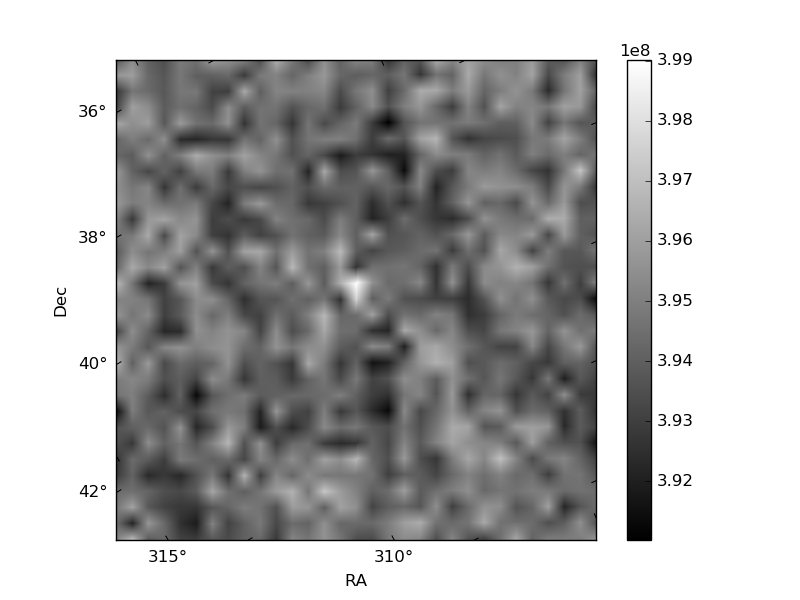
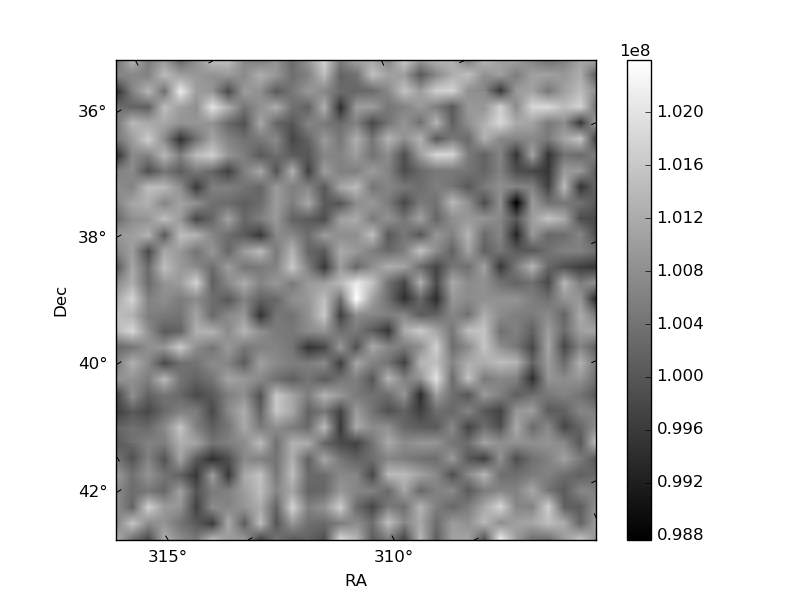
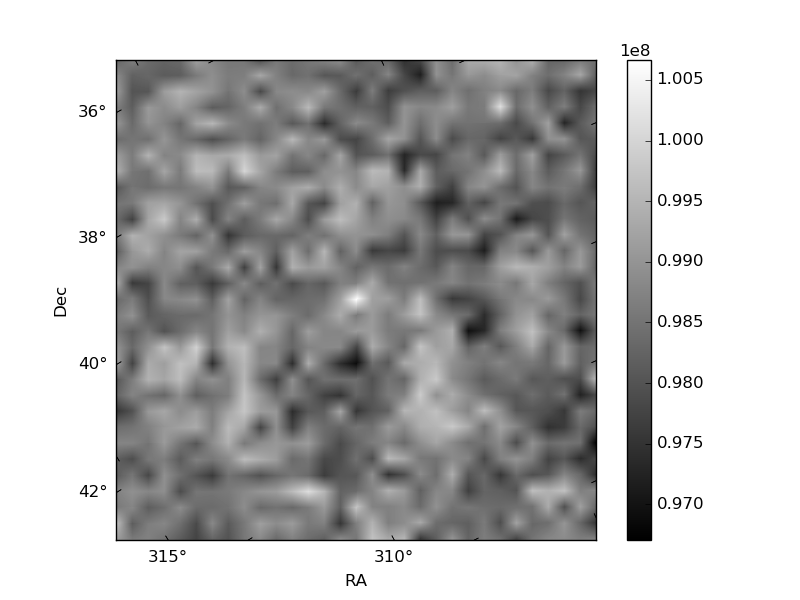
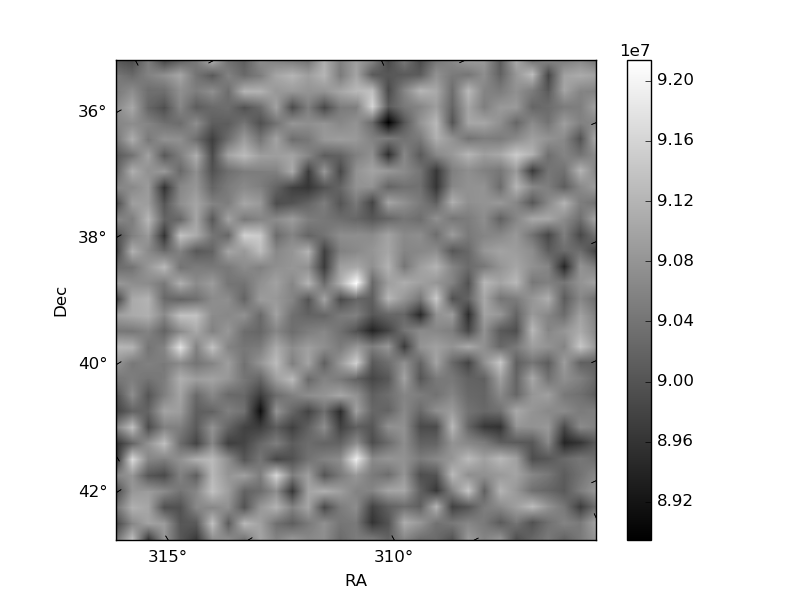
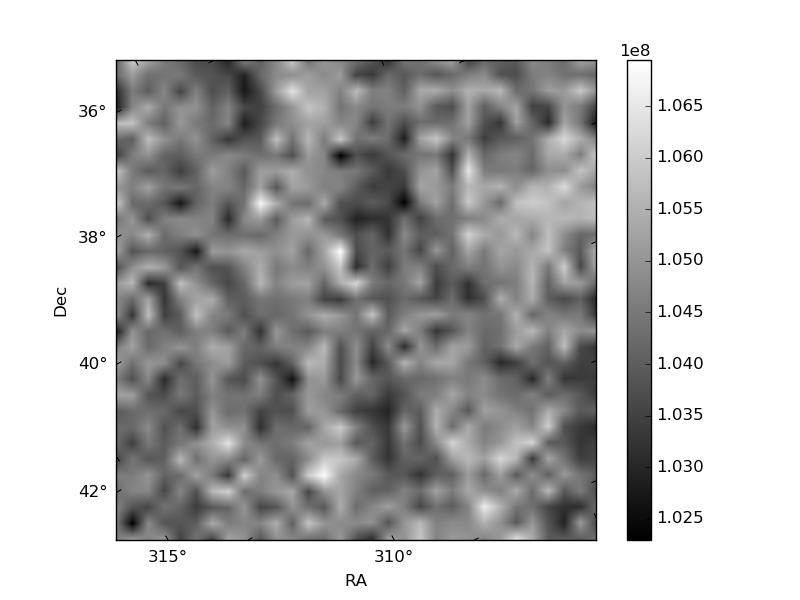
Histogram calculated using DETX and DETY for each event in the final _common_clean file
| Quadrant A | 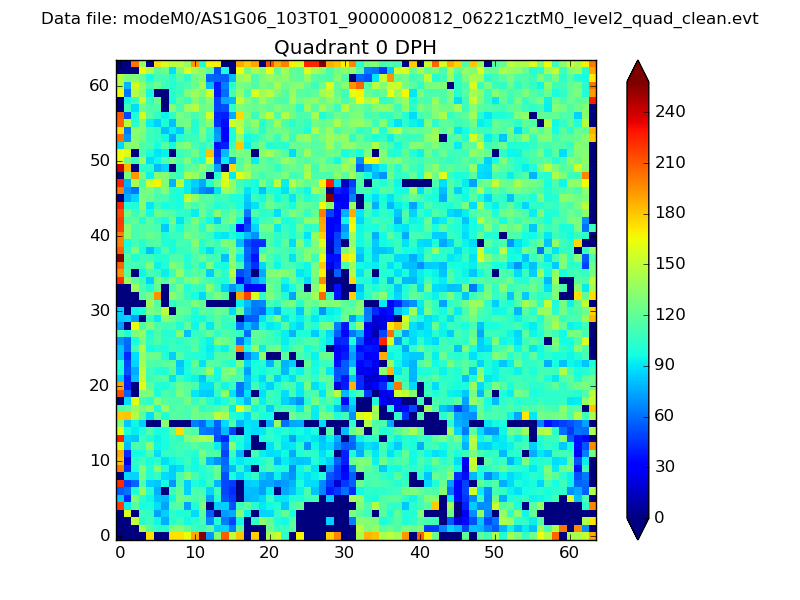 |
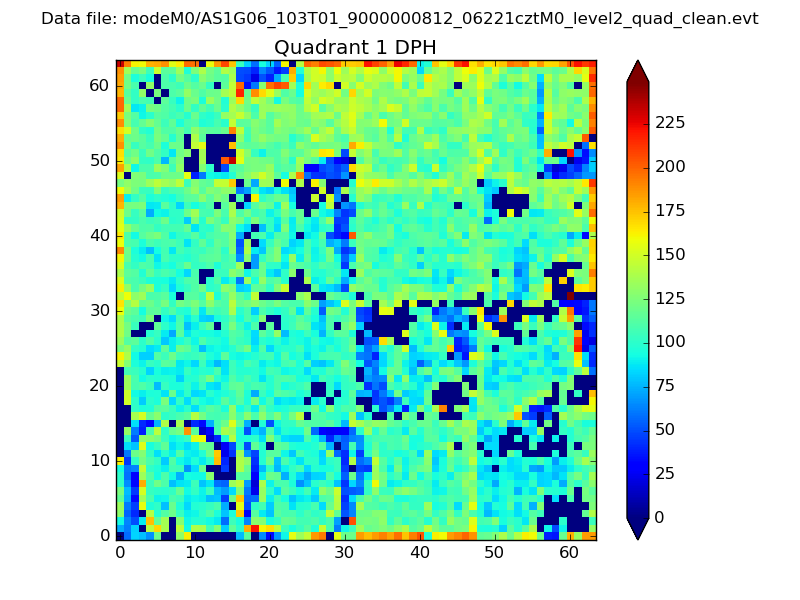 |
Quadrant B |
|---|---|---|---|
| Quadrant D | 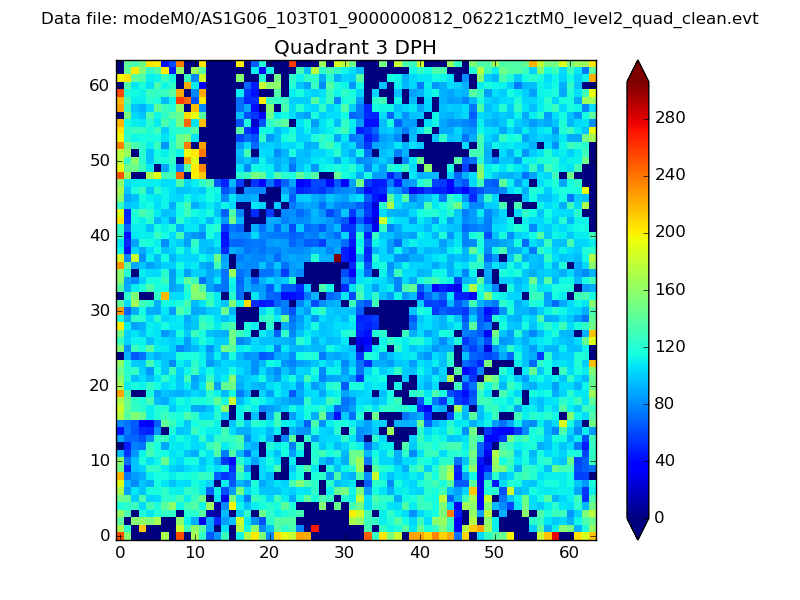 |
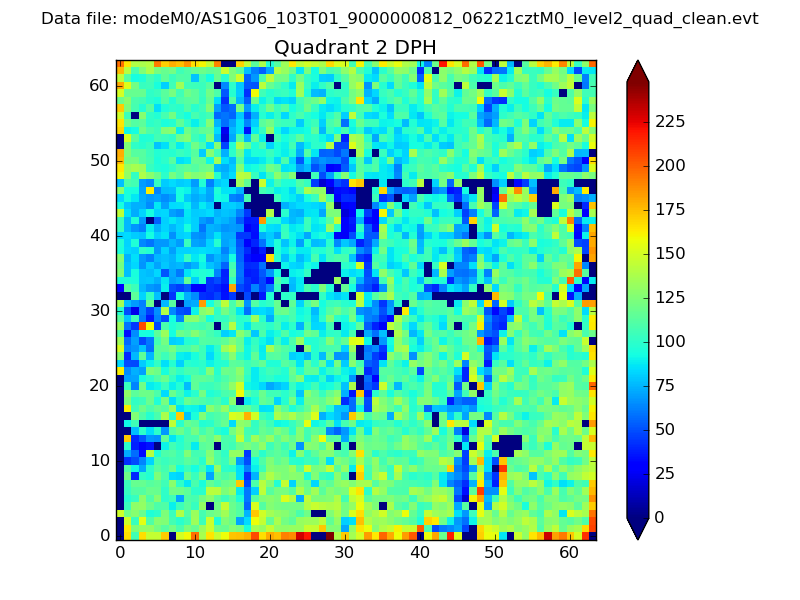 |
Quadrant C |
| Plot type | Count rate plots | Images |
|---|---|---|
| Comparison with Poisson distribution Blue bars denote a histogram of data divided into 1 sec bins. Red curve is a Poisson curve with rate = median count rate of data. |
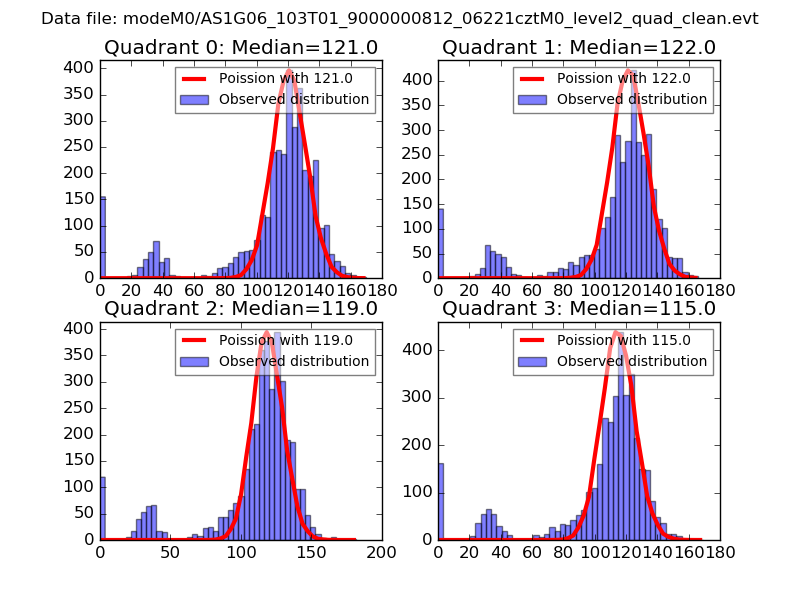 |
 |
| Quadrant-wise count rates Data is divided into 100 sec bins |
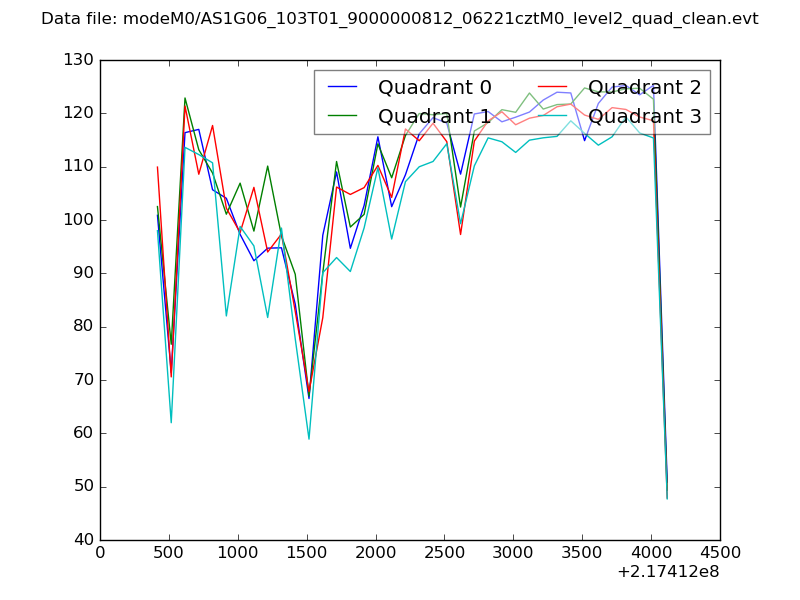 |
|
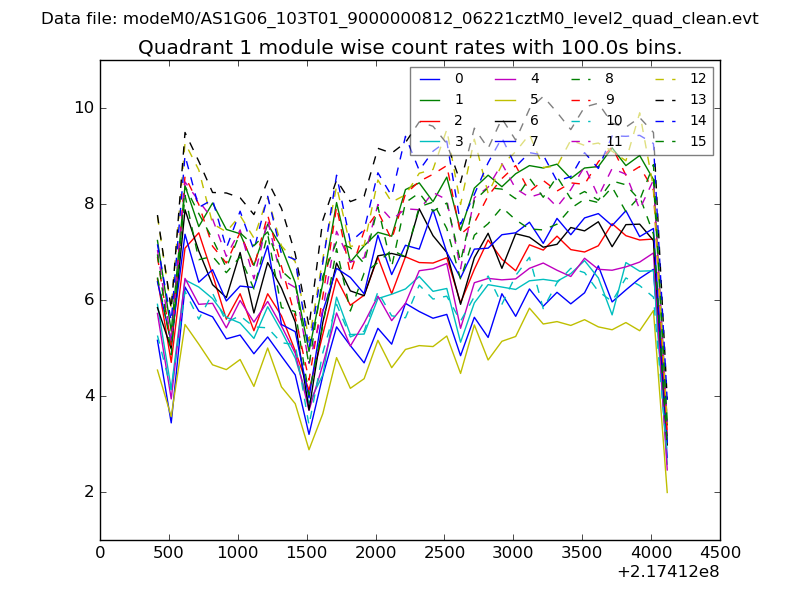
| Module-wise count rates for Quadrant A Data is divided into 100 sec bins |
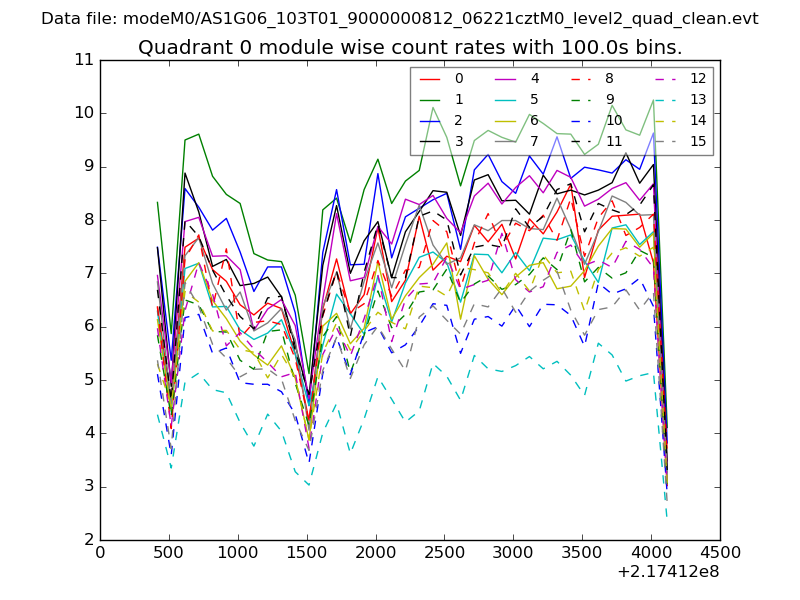 |
 |
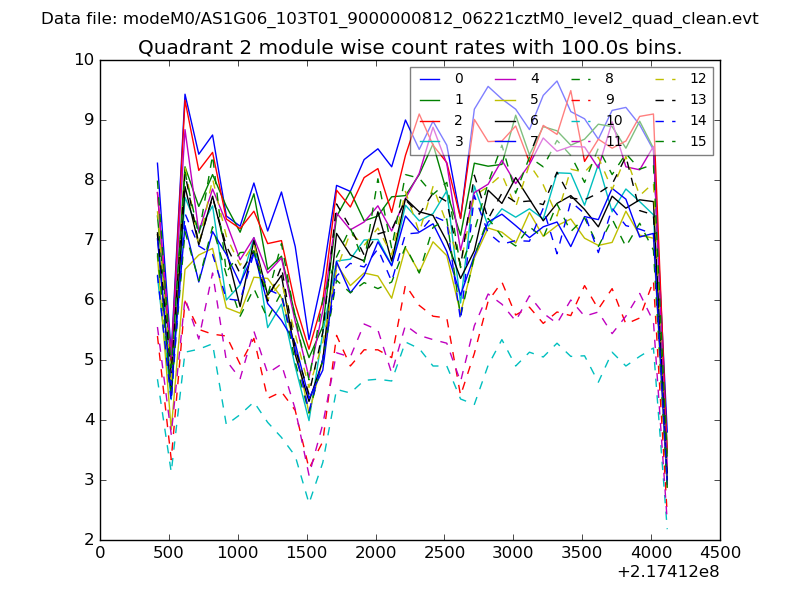
| Module-wise count rates for Quadrant B Data is divided into 100 sec bins |
 |
 |
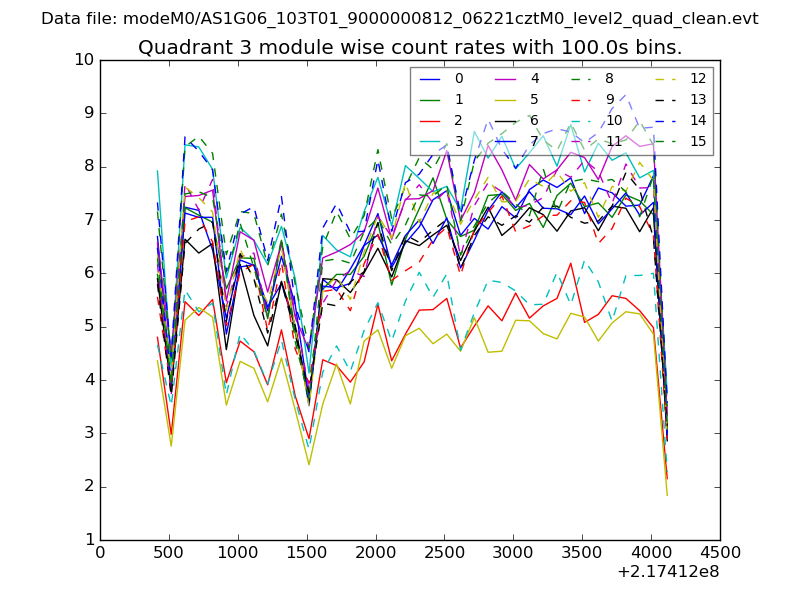
| Module-wise count rates for Quadrant C Data is divided into 100 sec bins |
 |
 |
| Module-wise count rates for Quadrant D Data is divided into 100 sec bins |
 |
 |
| Parameter | Plot |
|---|---|
| CZT HV Monitor | 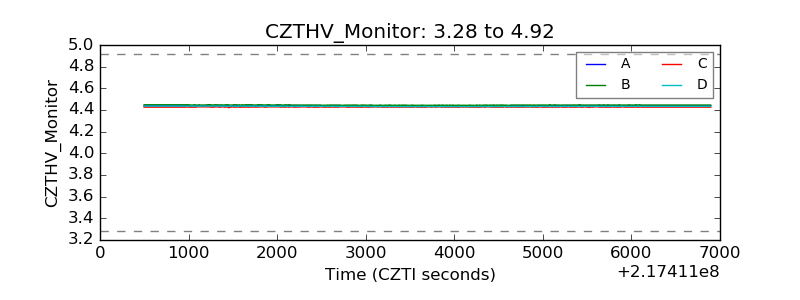 |
| D_VDD | 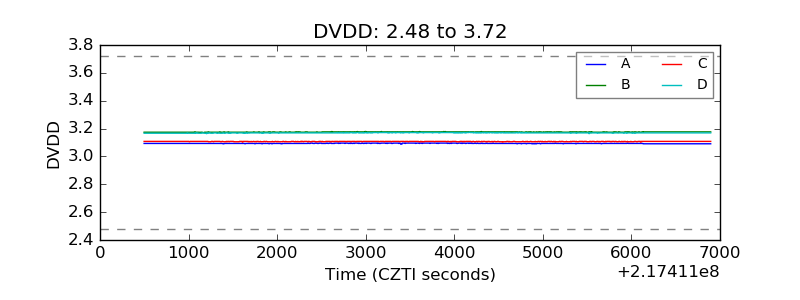 |
| Temperature 1 | 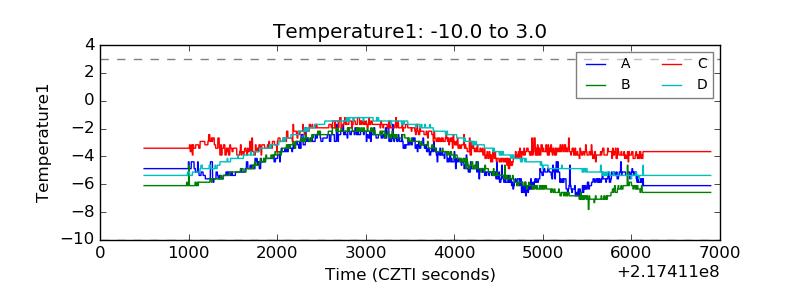 |
| Veto HV Monitor | 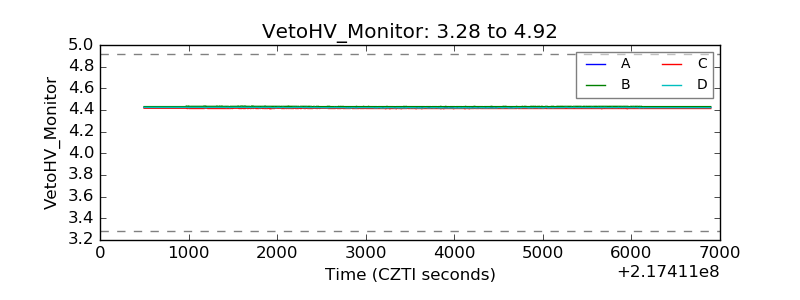 |
| Veto LLD | 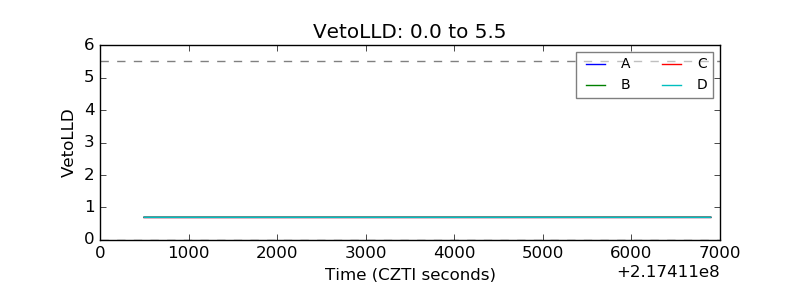 |
| Alpha Counter | 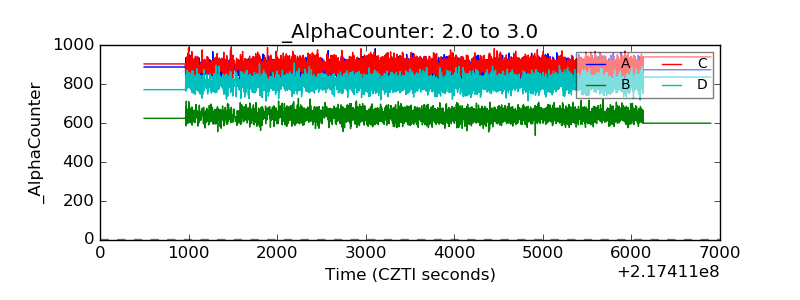 |
| _CPM_Rate | 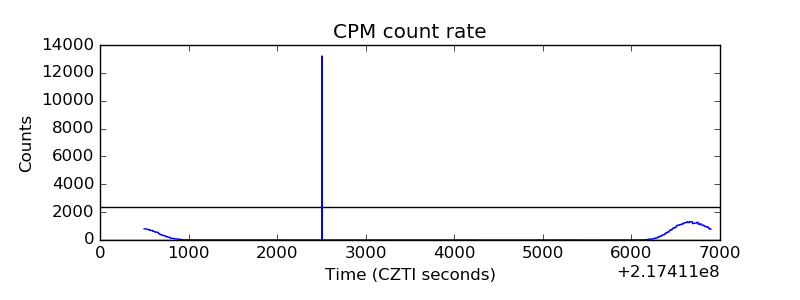 |
| CZT Counter | 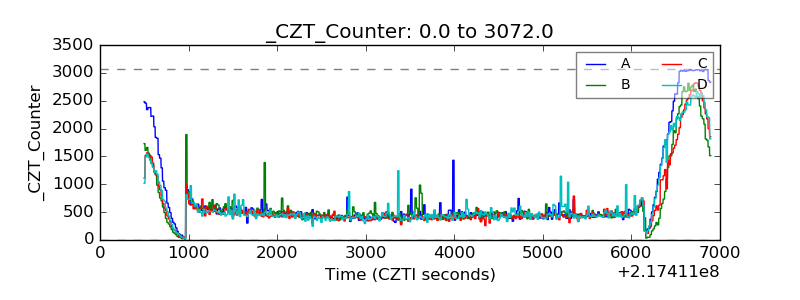 |
| +2.5 Volts monitor |  |
| +5 Volts monitor |  |
| _ROLL_ROT |  |
| _Roll_DEC |  |
| _Roll_RA | 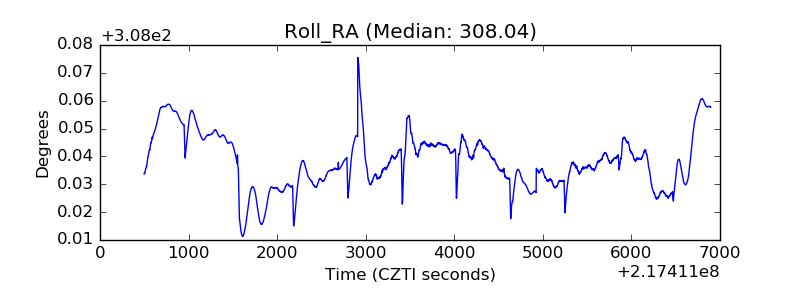 |
| Veto Counter | 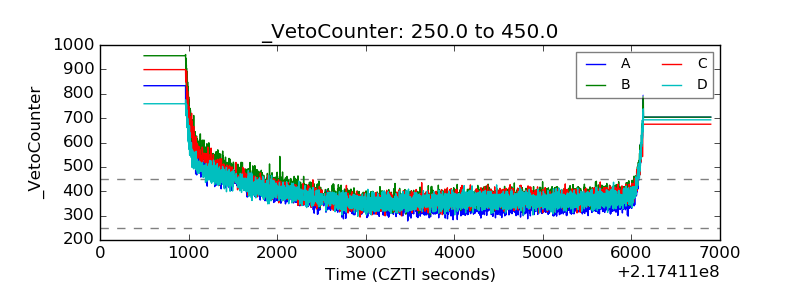 |