| Param | Original file | Final file |
|---|---|---|
| Filename | modeM0/AS1A02_151T01_9000000818_06232cztM0_level2.evt | modeM0/AS1A02_151T01_9000000818_06232cztM0_level2_quad_clean.evt |
| Size (bytes) | 40,109,760 | 5,777,280 |
| Size | 38.3 MB | 5.5 MB |
| Events in quadrant A | 293,474 | 34,525 |
| Events in quadrant B | 283,079 | 33,209 |
| Events in quadrant C | 279,469 | 34,492 |
| Events in quadrant D | 315,822 | 24,142 |
| Mode SS | |||
|---|---|---|---|
| Quadrant | BADHDUFLAG | Total packets | Discarded packets |
| A | 0 | 35 | 23 |
| B | 0 | 35 | 19 |
| C | 0 | 36 | 22 |
| D | 0 | 35 | 19 |
| Mode M9 | |||
|---|---|---|---|
| Quadrant | BADHDUFLAG | Total packets | Discarded packets |
| A | 0 | 7 | 3 |
| B | 0 | 7 | 2 |
| C | 0 | 7 | 2 |
| D | 0 | 7 | 2 |
| Mode M0 | |||
|---|---|---|---|
| Quadrant | BADHDUFLAG | Total packets | Discarded packets |
| A | 0 | 3286 | 2056 |
| B | 0 | 3411 | 2209 |
| C | 0 | 3209 | 1992 |
| D | 0 | 4076 | 2806 |
| Quadrant | Total seconds | Saturated seconds | Saturation percentage |
|---|---|---|---|
| A | 591 | 20 | 3.384095% |
| B | 580 | 19 | 3.275862% |
| C | 596 | 17 | 2.852349% |
| D | 511 | 19 | 3.718200% |
Noise dominated data is calculated using 1-second bins in cleaned event files. If a bin has >2000 counts, and if more than 50% of those come from <1% of pixels, then it is considered to be noise-dominated and hence unusable.
| Quadrant | # 1 sec bins | Bins with >0 counts | Bins with >2000 counts | High rate bins dominated by noise | Noise dominated (total time) | Noise dominated (detector-on time) | Marked lightcurve |
|---|---|---|---|---|---|---|---|
| A | 2330 | 854 | 0 | 0 | 0.00% | 0.00% | 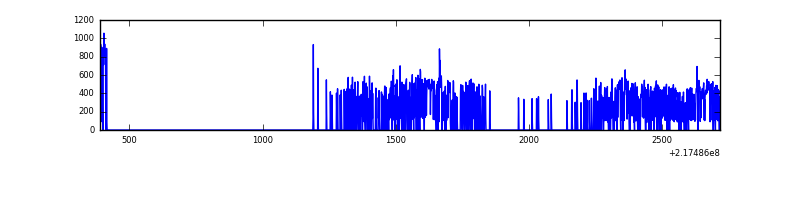 |
| B | 2330 | 825 | 0 | 0 | 0.00% | 0.00% |  |
| C | 2328 | 840 | 0 | 0 | 0.00% | 0.00% |  |
| D | 2330 | 733 | 0 | 0 | 0.00% | 0.00% | 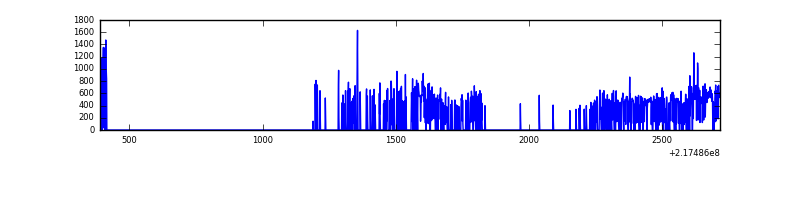 |
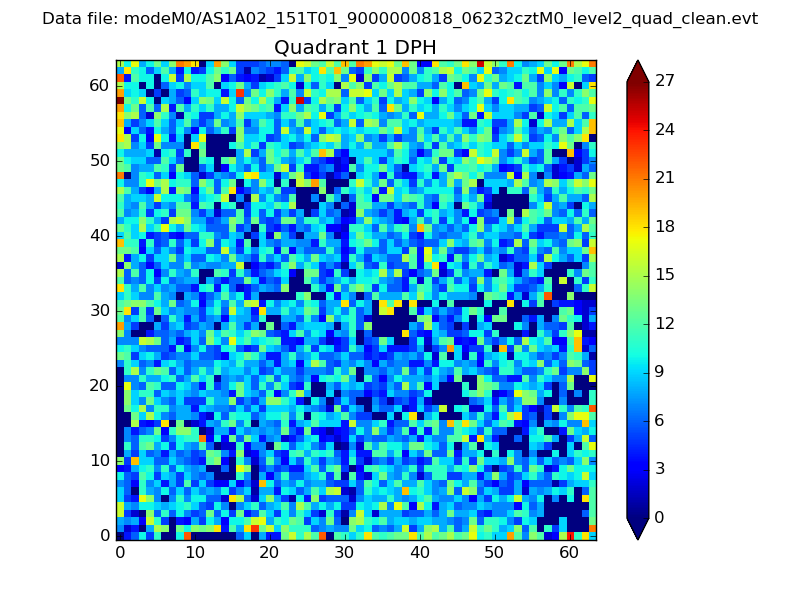
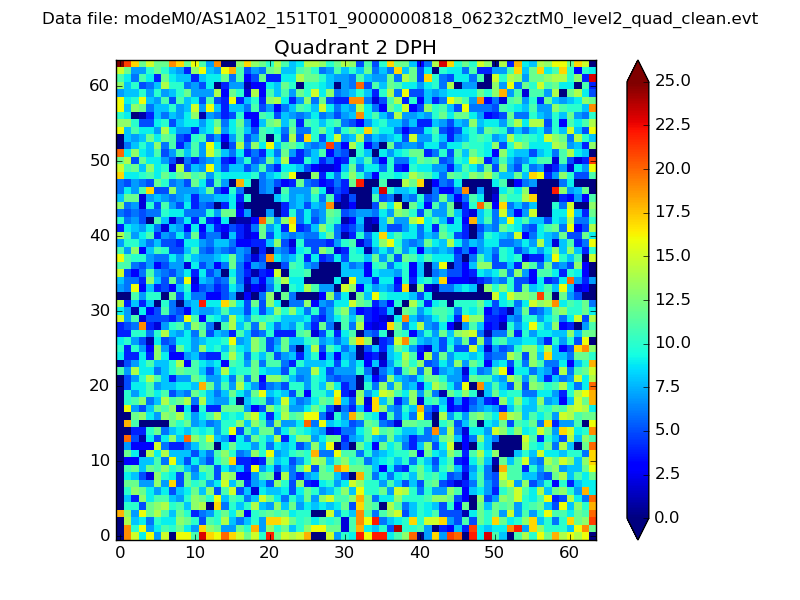
Top three noisy pixels from each quadrant. If the there are fewer than three noisy pixels in the level2.evt file, extra rows are filled as -1
| Pixel properties | Quadrant properties | ||||||
|---|---|---|---|---|---|---|---|
| Quadrant | DetID | PixID | Counts | Sigma | Mean | Median | Sigma |
| A | 8 | 15 | 10005 | 591.36 | 70 | 68 | 16.8 |
| A | 15 | 236 | 8646 | 510.49 | 70 | 68 | 16.8 |
| A | 15 | 239 | 1277 | 71.95 | 70 | 68 | 16.8 |
| B | 4 | 81 | 5914 | 372.54 | 70 | 68 | 15.7 |
| B | 3 | 64 | 4124 | 258.47 | 70 | 68 | 15.7 |
| B | 12 | 111 | 1434 | 87.05 | 70 | 68 | 15.7 |
| C | 13 | 61 | 549 | 25.81 | 71 | 71 | 18.5 |
| C | 12 | 222 | 304 | 12.58 | 71 | 71 | 18.5 |
| C | 9 | 54 | 218 | 7.94 | 71 | 71 | 18.5 |
| D | 2 | 63 | 78568 | 4672.55 | 60 | 58 | 16.8 |
| D | 2 | 136 | 3120 | 182.24 | 60 | 58 | 16.8 |
| D | 12 | 110 | 2567 | 149.32 | 60 | 58 | 16.8 |
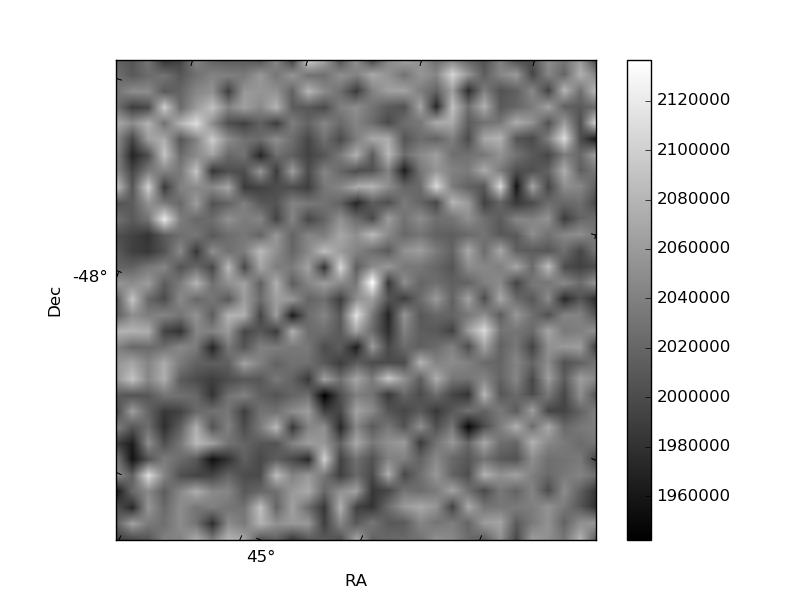
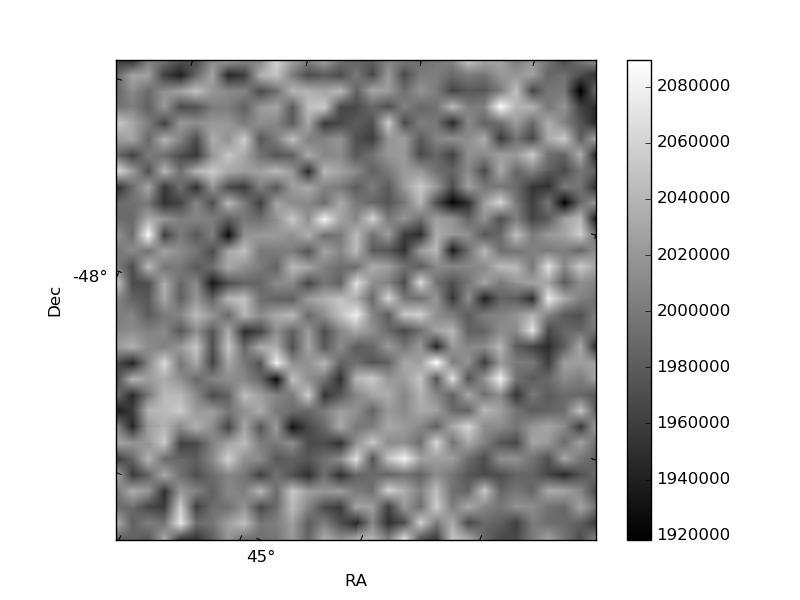
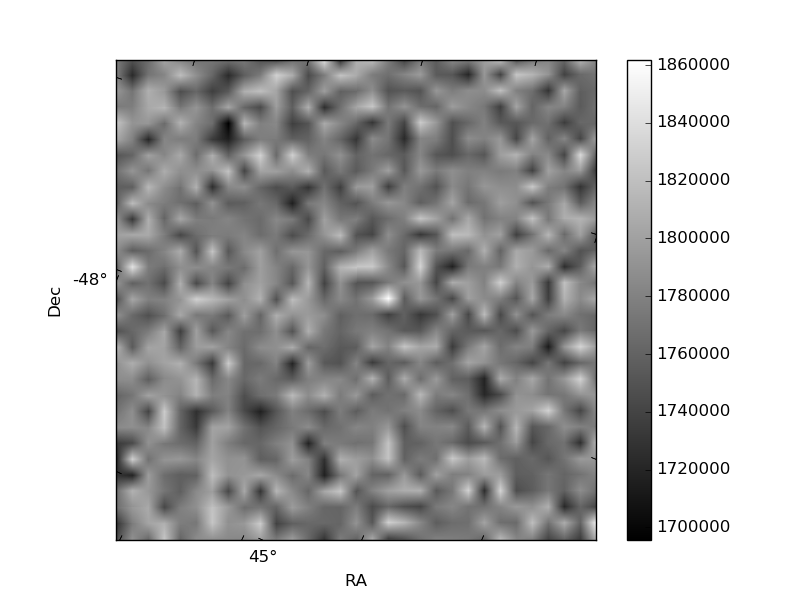
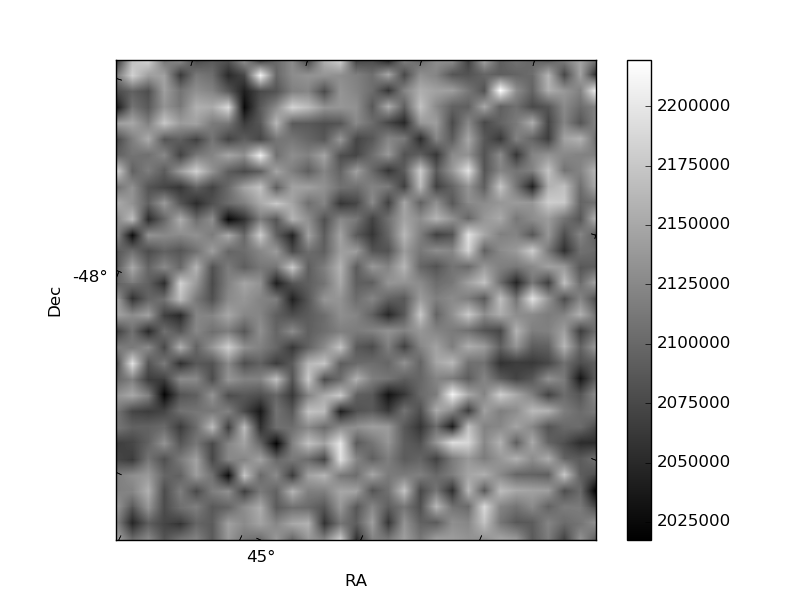
Histogram calculated using DETX and DETY for each event in the final _common_clean file
| Quadrant A | 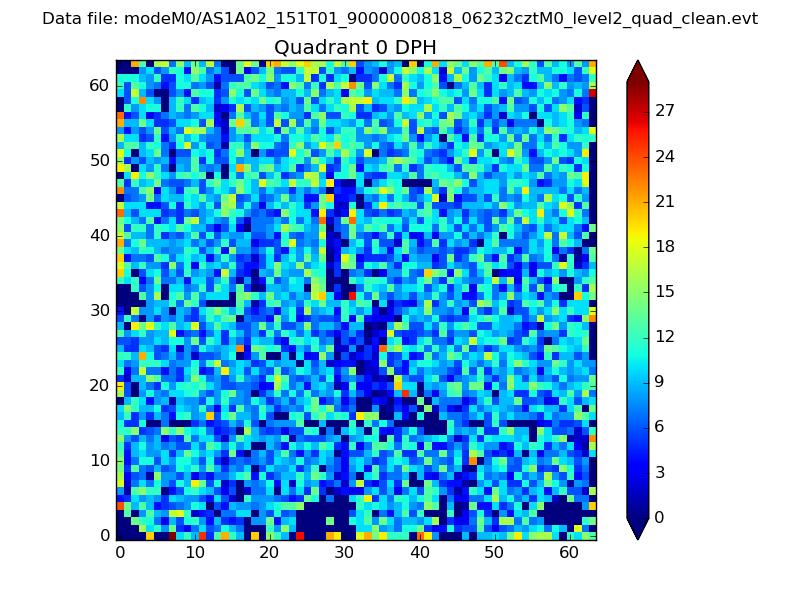 |
 |
Quadrant B |
|---|---|---|---|
| Quadrant D | 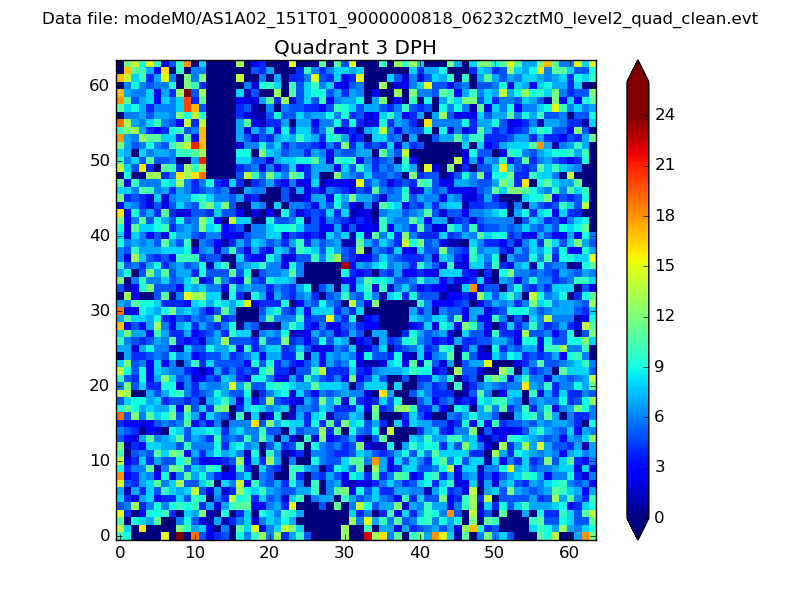 |
 |
Quadrant C |
| Plot type | Count rate plots | Images |
|---|---|---|
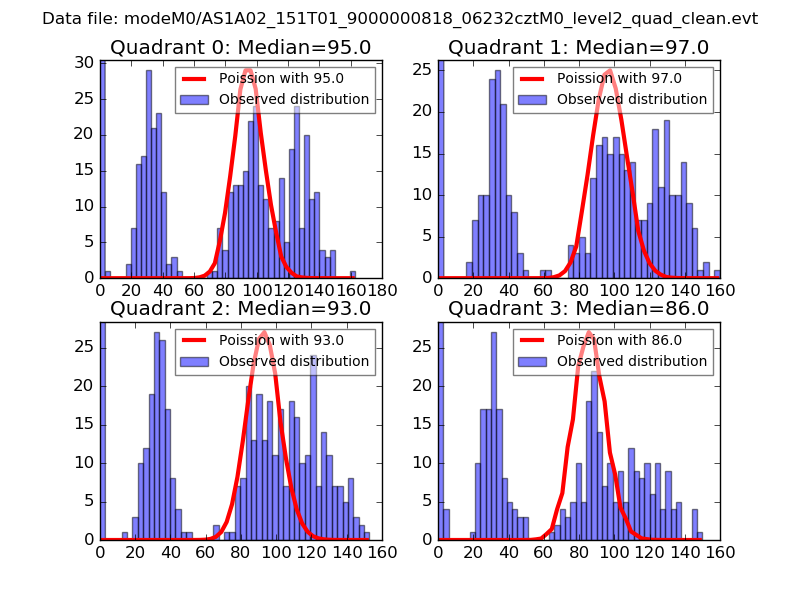
| Comparison with Poisson distribution Blue bars denote a histogram of data divided into 1 sec bins. Red curve is a Poisson curve with rate = median count rate of data. |
 |
 |
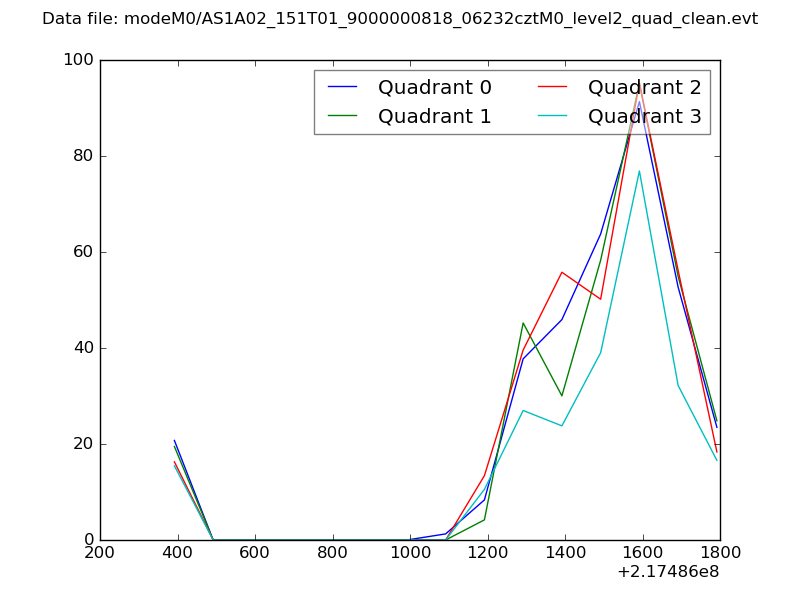
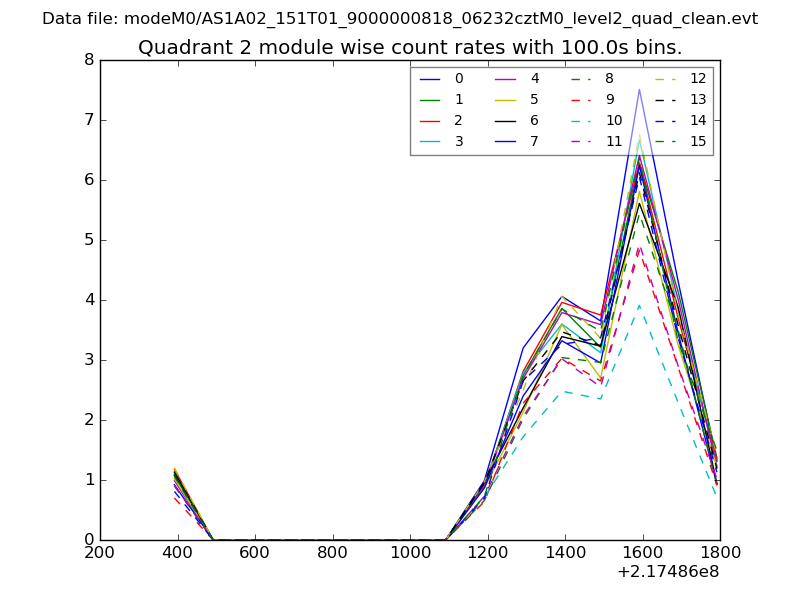
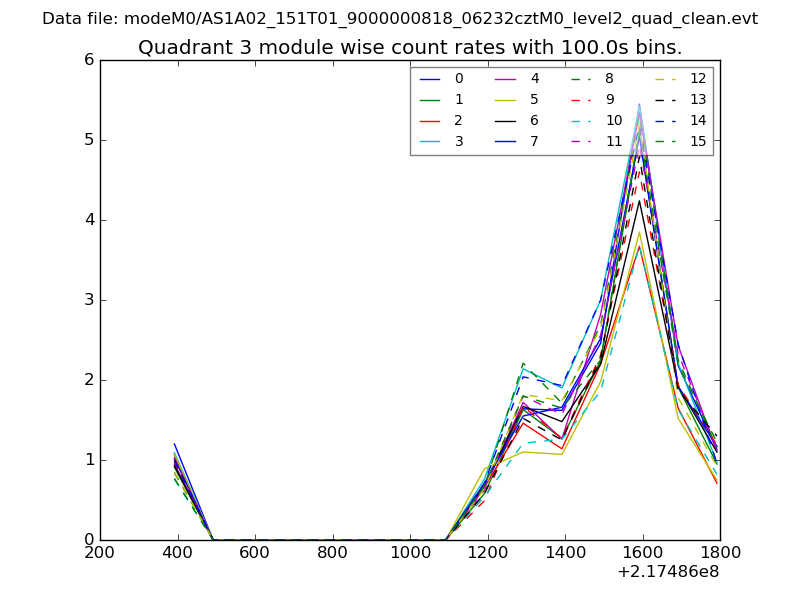
| Quadrant-wise count rates Data is divided into 100 sec bins |
 |
|
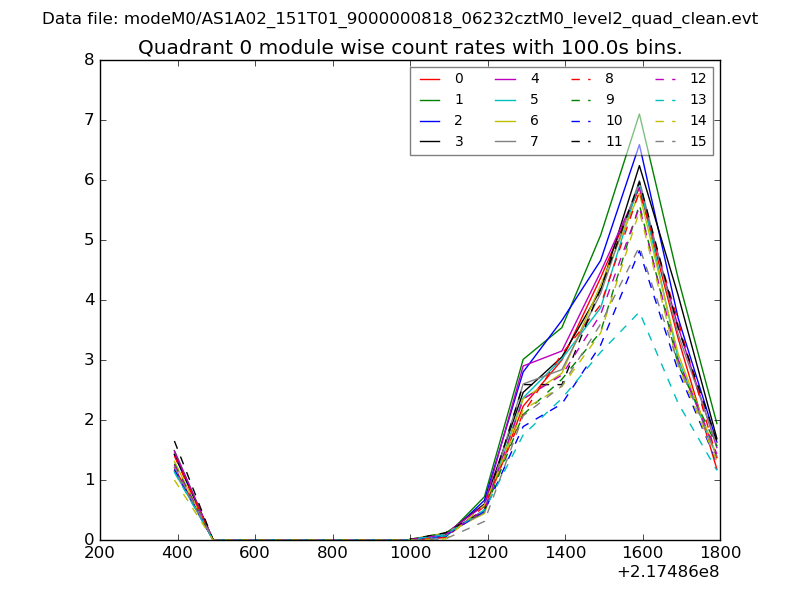
| Module-wise count rates for Quadrant A Data is divided into 100 sec bins |
 |
 |
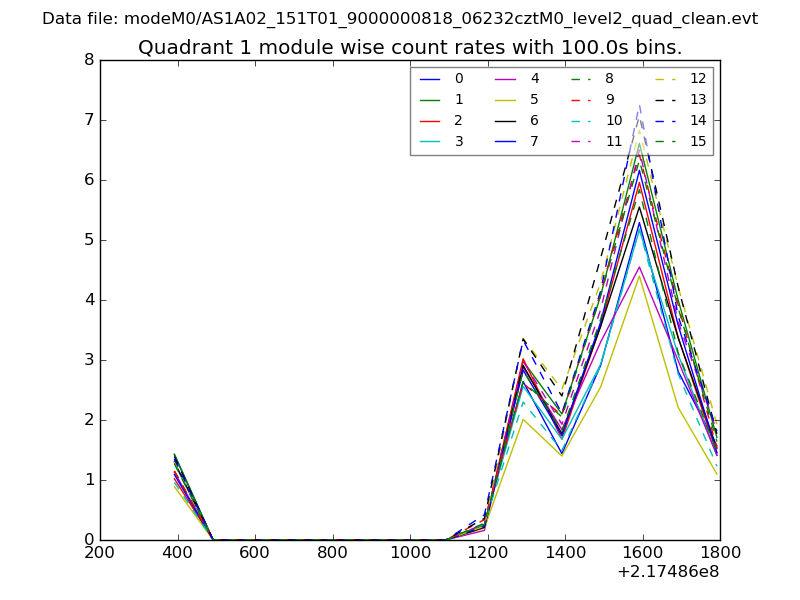
| Module-wise count rates for Quadrant B Data is divided into 100 sec bins |
 |
 |
| Module-wise count rates for Quadrant C Data is divided into 100 sec bins |
 |
 |
| Module-wise count rates for Quadrant D Data is divided into 100 sec bins |
 |
 |
| Parameter | Plot |
|---|---|
| CZT HV Monitor | 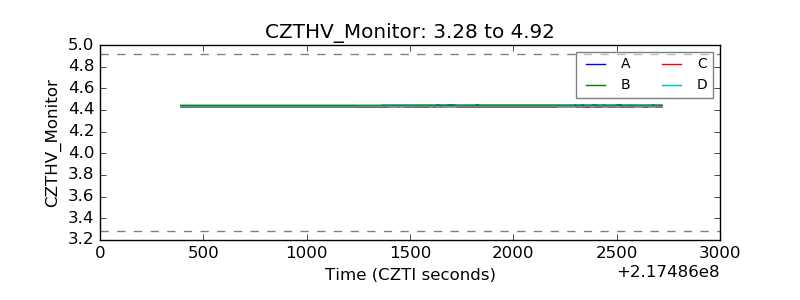 |
| D_VDD | 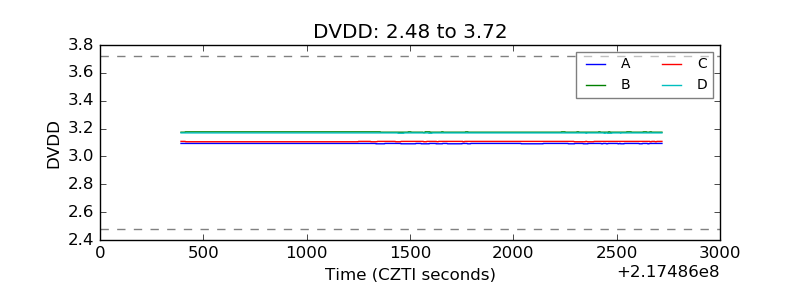 |
| Temperature 1 | 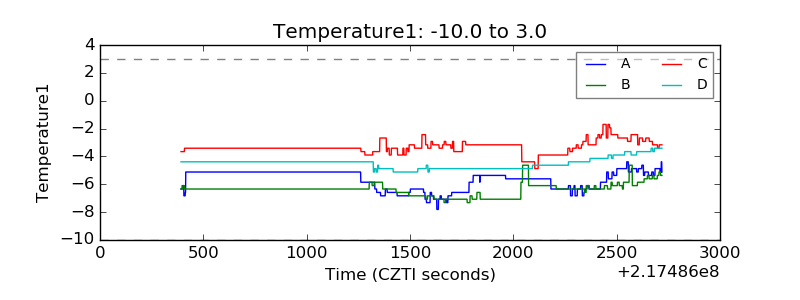 |
| Veto HV Monitor | 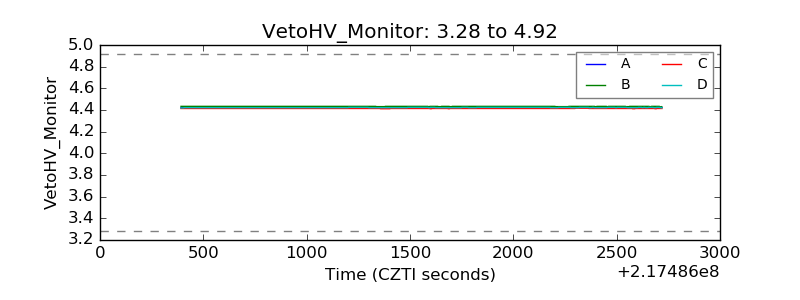 |
| Veto LLD | 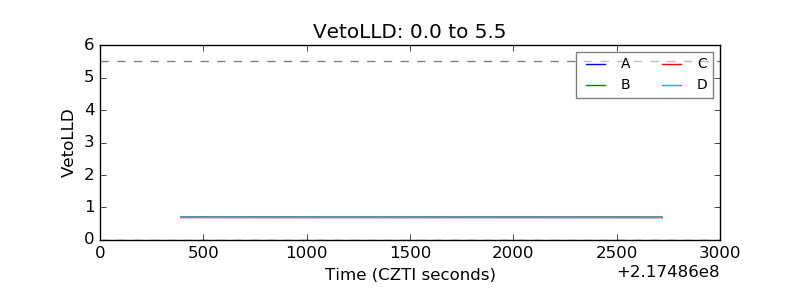 |
| Alpha Counter | 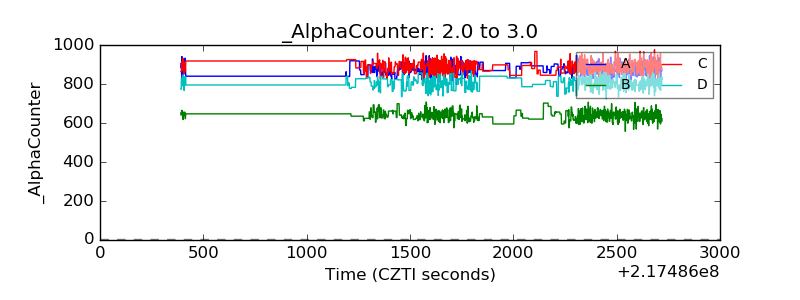 |
| _CPM_Rate | 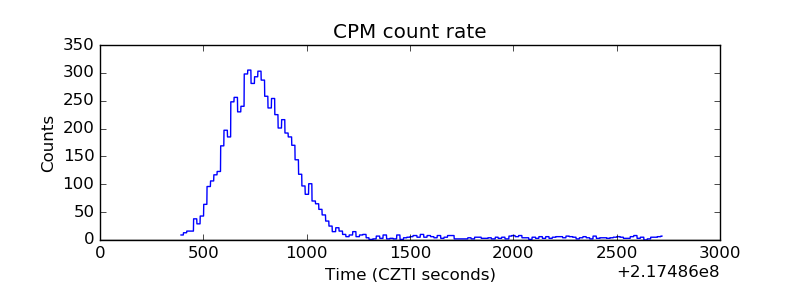 |
| CZT Counter | 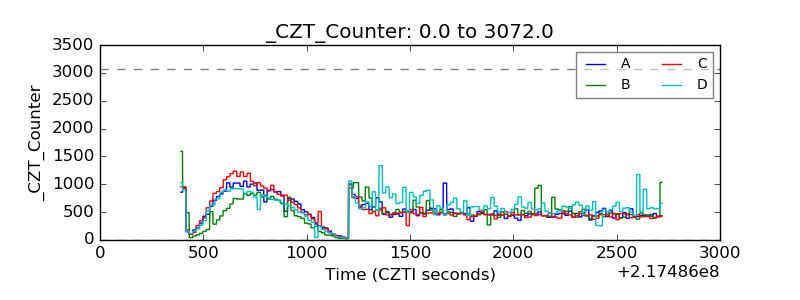 |
| +2.5 Volts monitor |  |
| +5 Volts monitor |  |
| _ROLL_ROT | 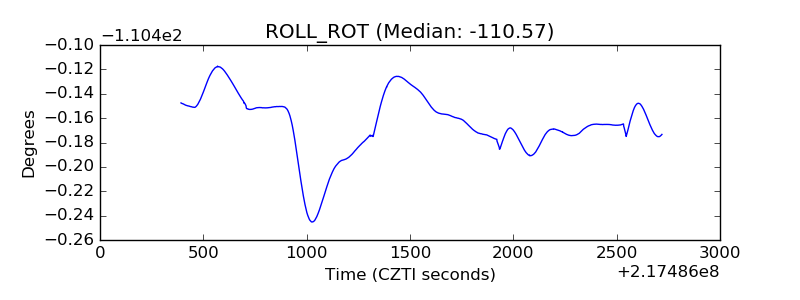 |
| _Roll_DEC | 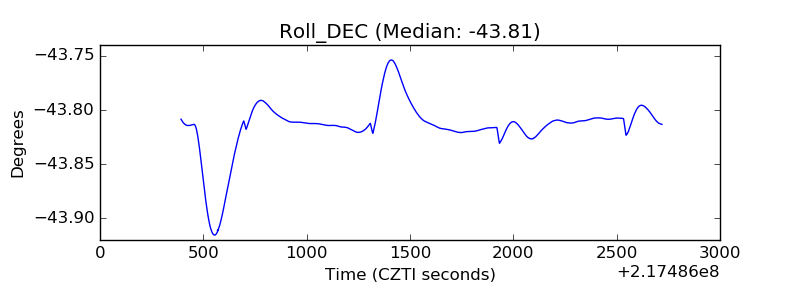 |
| _Roll_RA | 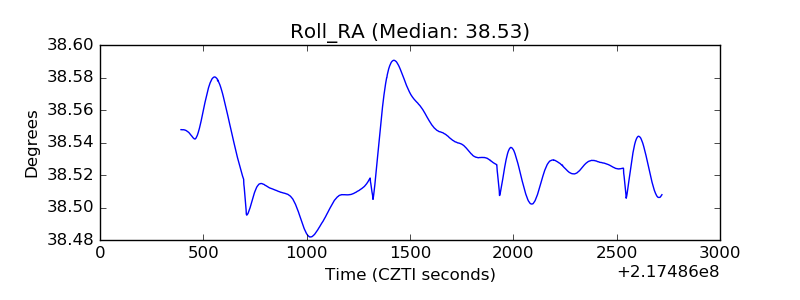 |
| Veto Counter | 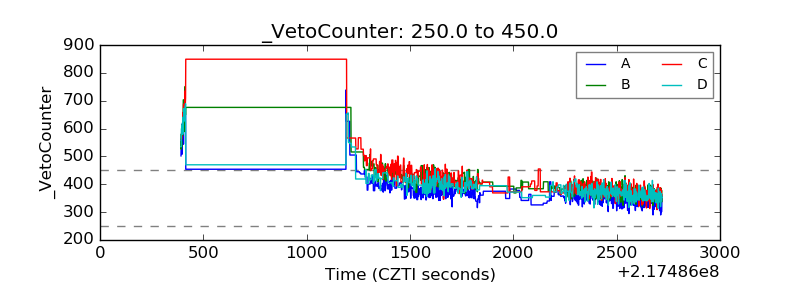 |