| Param | Original file | Final file |
|---|---|---|
| Filename | modeM0/AS1A02_082T01_9000000898_06630cztM0_level2.evt | modeM0/AS1A02_082T01_9000000898_06630cztM0_level2_quad_clean.evt |
| Size (bytes) | 492,505,920 | 87,877,440 |
| Size | 469.7 MB | 83.8 MB |
| Events in quadrant A | 3,055,384 | 560,575 |
| Events in quadrant B | 3,259,558 | 569,522 |
| Events in quadrant C | 2,998,242 | 556,851 |
| Events in quadrant D | 5,165,302 | 524,840 |
| Mode M9 | |||
|---|---|---|---|
| Quadrant | BADHDUFLAG | Total packets | Discarded packets |
| A | 0 | 23 | 0 |
| B | 0 | 23 | 0 |
| C | 0 | 23 | 0 |
| D | 0 | 24 | 0 |
| Mode M0 | |||
|---|---|---|---|
| Quadrant | BADHDUFLAG | Total packets | Discarded packets |
| A | 0 | 13356 | 3 |
| B | 0 | 13724 | 2 |
| C | 0 | 13248 | 2 |
| D | 0 | 19917 | 2 |
| Mode SS | |||
|---|---|---|---|
| Quadrant | BADHDUFLAG | Total packets | Discarded packets |
| A | 0 | 130 | 0 |
| B | 0 | 130 | 0 |
| C | 0 | 130 | 0 |
| D | 0 | 130 | 0 |
| Quadrant | Total seconds | Saturated seconds | Saturation percentage |
|---|---|---|---|
| A | 6445 | 36 | 0.558573% |
| B | 6445 | 47 | 0.729247% |
| C | 6445 | 24 | 0.372382% |
| D | 6445 | 251 | 3.894492% |
Noise dominated data is calculated using 1-second bins in cleaned event files. If a bin has >2000 counts, and if more than 50% of those come from <1% of pixels, then it is considered to be noise-dominated and hence unusable.
| Quadrant | # 1 sec bins | Bins with >0 counts | Bins with >2000 counts | High rate bins dominated by noise | Noise dominated (total time) | Noise dominated (detector-on time) | Marked lightcurve |
|---|---|---|---|---|---|---|---|
| A | 7690 | 6446 | 0 | 0 | 0.00% | 0.00% | 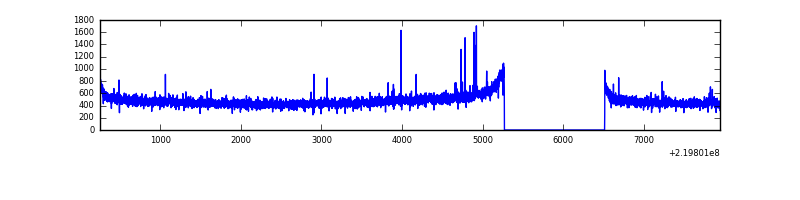 |
| B | 7690 | 6446 | 1 | 1 | 0.01% | 0.02% |  |
| C | 7690 | 6446 | 0 | 0 | 0.00% | 0.00% |  |
| D | 7690 | 6446 | 180 | 180 | 2.34% | 2.79% |  |
Top three noisy pixels from each quadrant. If the there are fewer than three noisy pixels in the level2.evt file, extra rows are filled as -1
| Pixel properties | Quadrant properties | ||||||
|---|---|---|---|---|---|---|---|
| Quadrant | DetID | PixID | Counts | Sigma | Mean | Median | Sigma |
| A | 8 | 15 | 63184 | 399.96 | 777 | 760 | 156.1 |
| A | 0 | 226 | 7208 | 41.31 | 777 | 760 | 156.1 |
| A | 12 | 194 | 7020 | 40.11 | 777 | 760 | 156.1 |
| B | 0 | 219 | 123313 | 818.44 | 787 | 768 | 149.7 |
| B | 0 | 198 | 54718 | 360.32 | 787 | 768 | 149.7 |
| B | 12 | 111 | 15986 | 101.64 | 787 | 768 | 149.7 |
| C | 12 | 4 | 9832 | 50.95 | 766 | 771 | 177.9 |
| C | 13 | 61 | 6113 | 30.04 | 766 | 771 | 177.9 |
| C | 3 | 202 | 2026 | 7.06 | 766 | 771 | 177.9 |
| D | 8 | 195 | 1416061 | 7788.44 | 746 | 723 | 181.7 |
| D | 2 | 33 | 810278 | 4454.88 | 746 | 723 | 181.7 |
| D | 2 | 14 | 81519 | 444.61 | 746 | 723 | 181.7 |
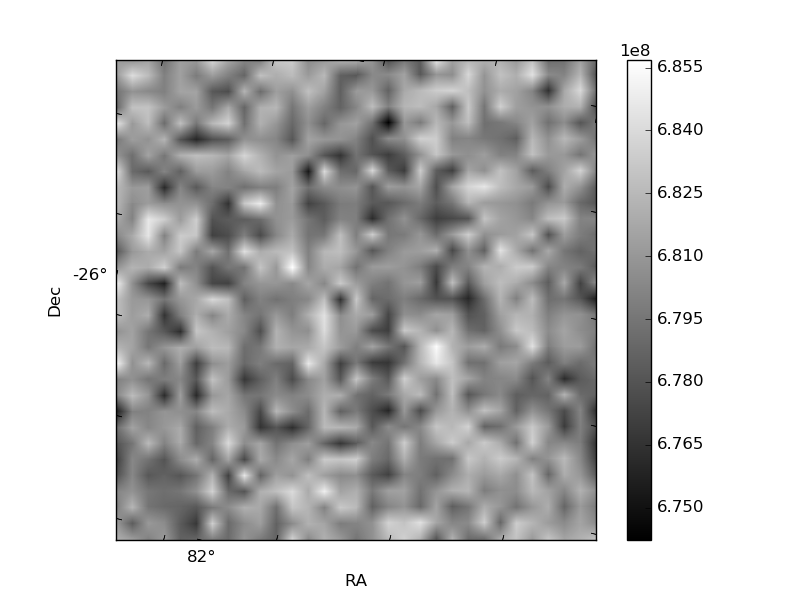
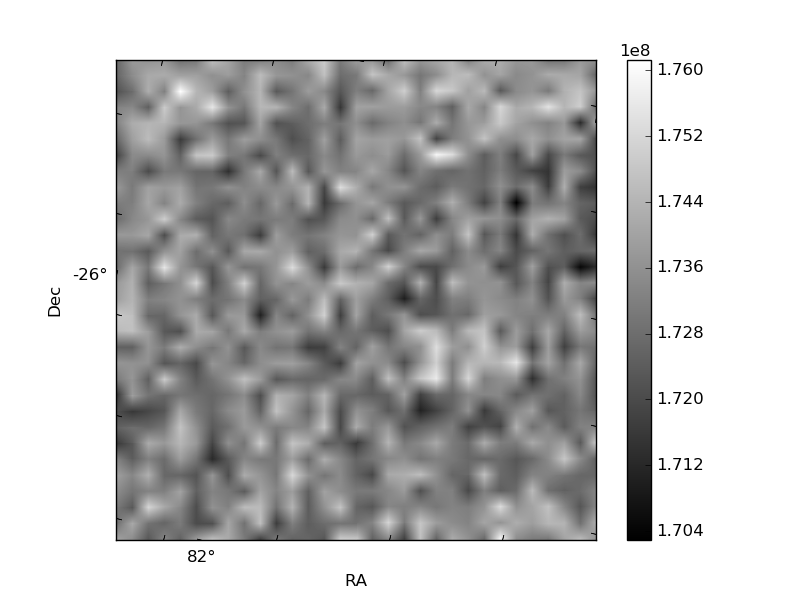
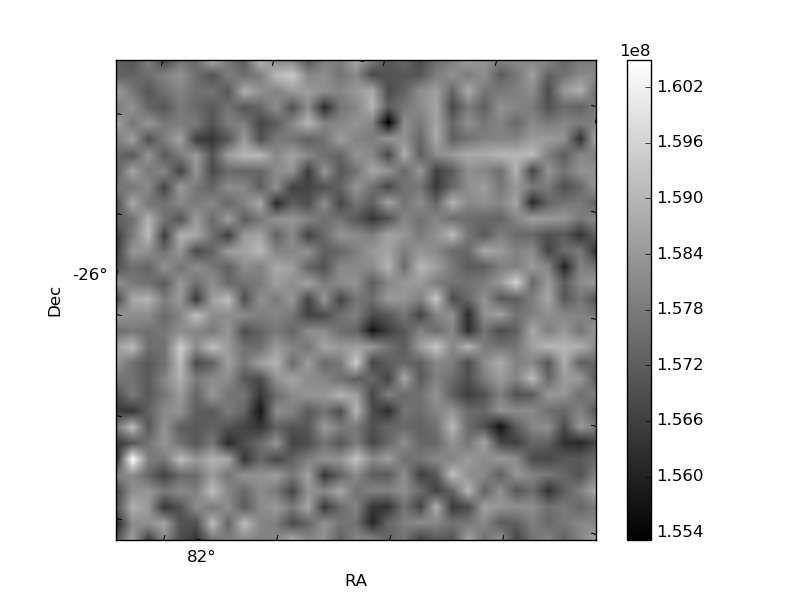
Histogram calculated using DETX and DETY for each event in the final _common_clean file
| Quadrant A | 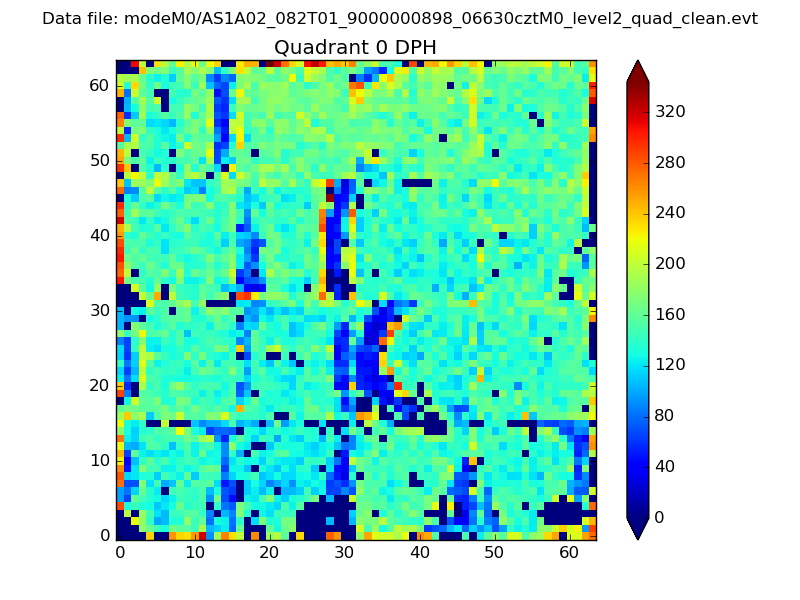 |
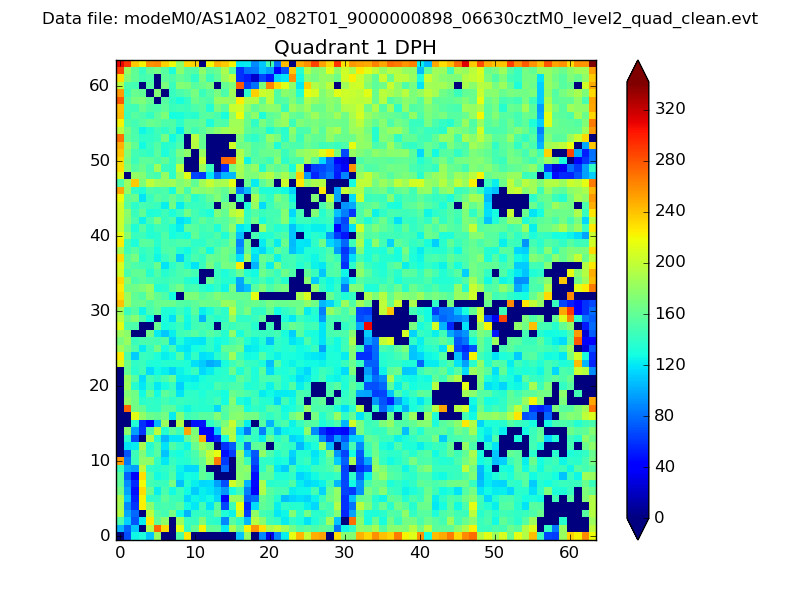 |
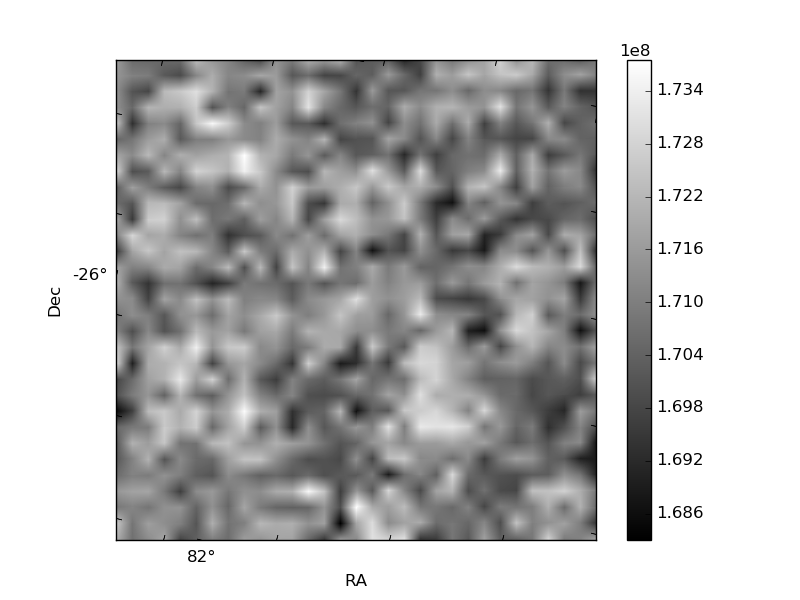
Quadrant B |
|---|---|---|---|
| Quadrant D |  |
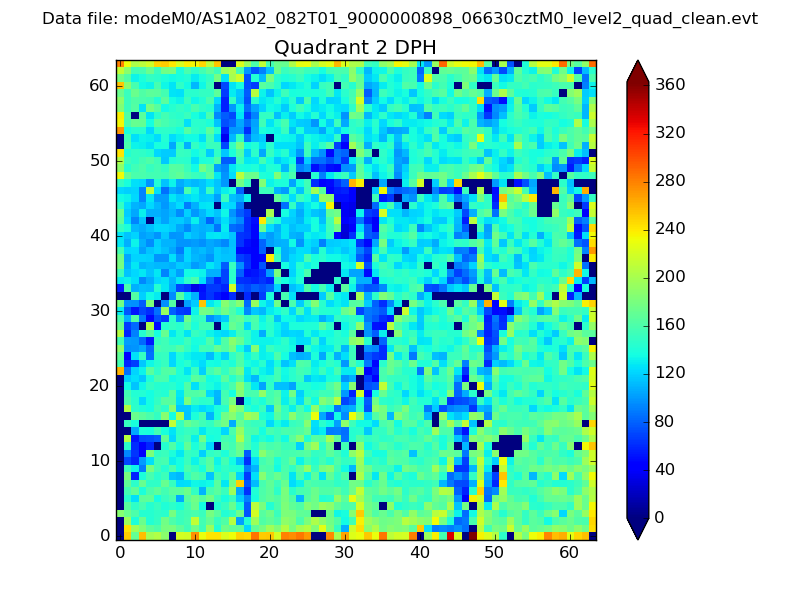 |
Quadrant C |
| Plot type | Count rate plots | Images |
|---|---|---|
| Comparison with Poisson distribution Blue bars denote a histogram of data divided into 1 sec bins. Red curve is a Poisson curve with rate = median count rate of data. |
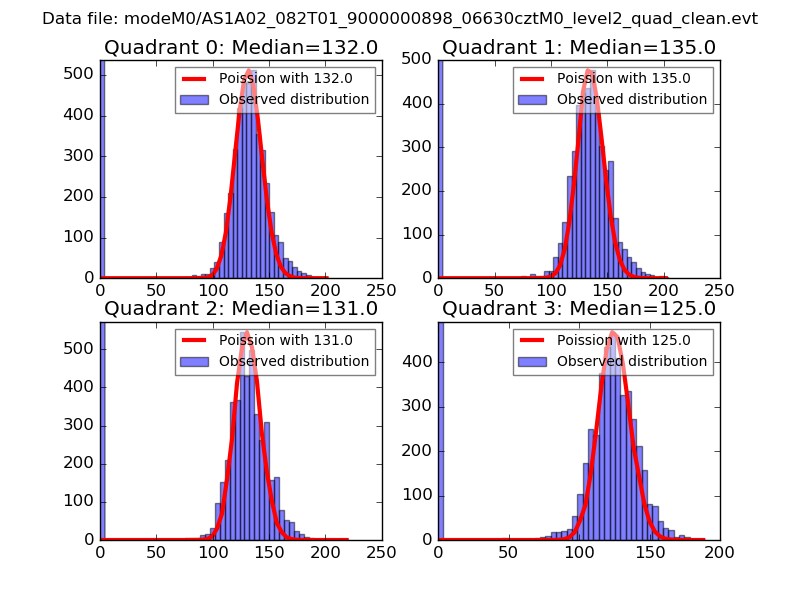 |
 |
| Quadrant-wise count rates Data is divided into 100 sec bins |
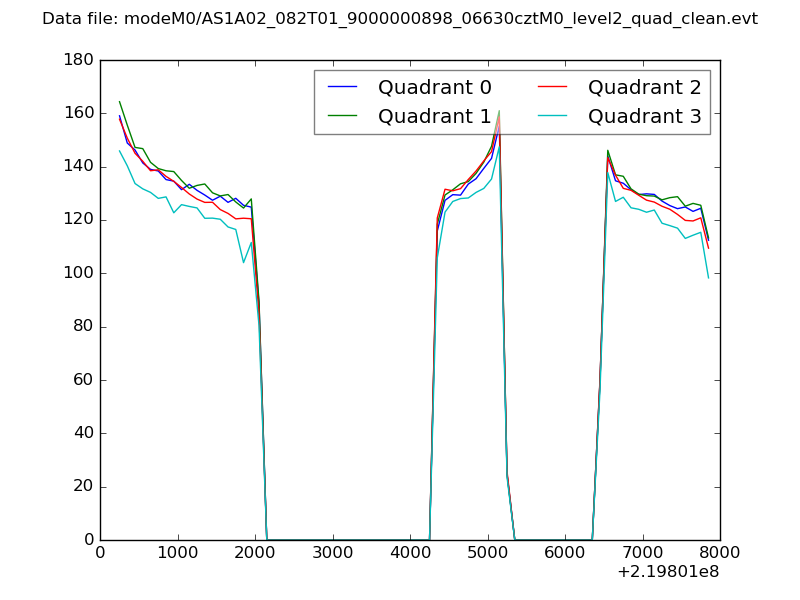 |
|
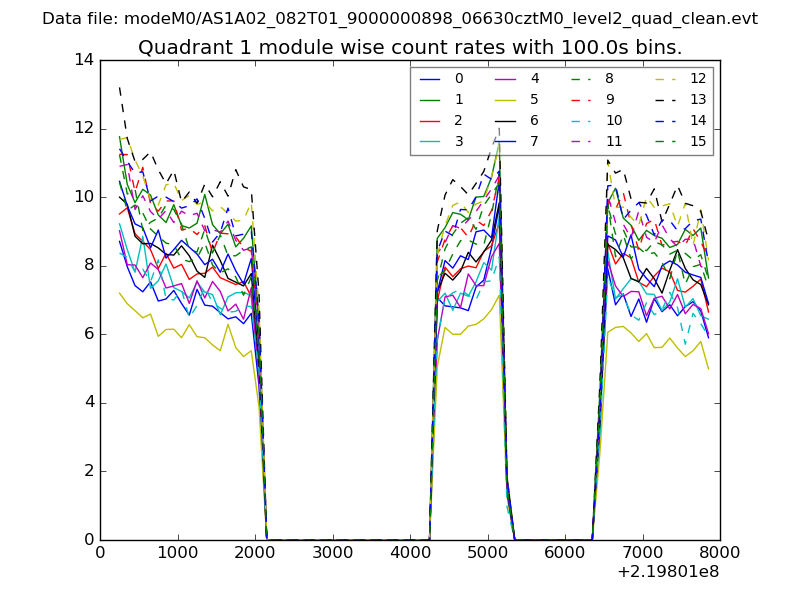
| Module-wise count rates for Quadrant A Data is divided into 100 sec bins |
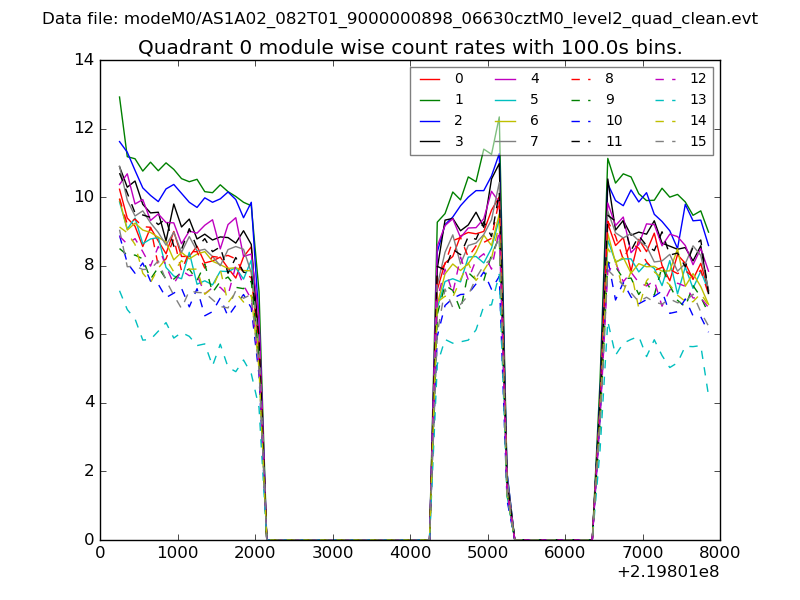 |
 |
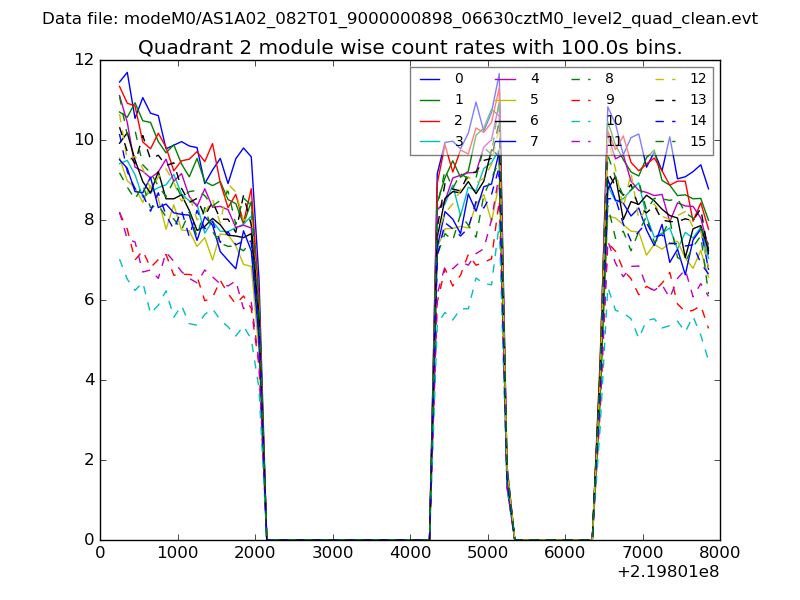
| Module-wise count rates for Quadrant B Data is divided into 100 sec bins |
 |
 |
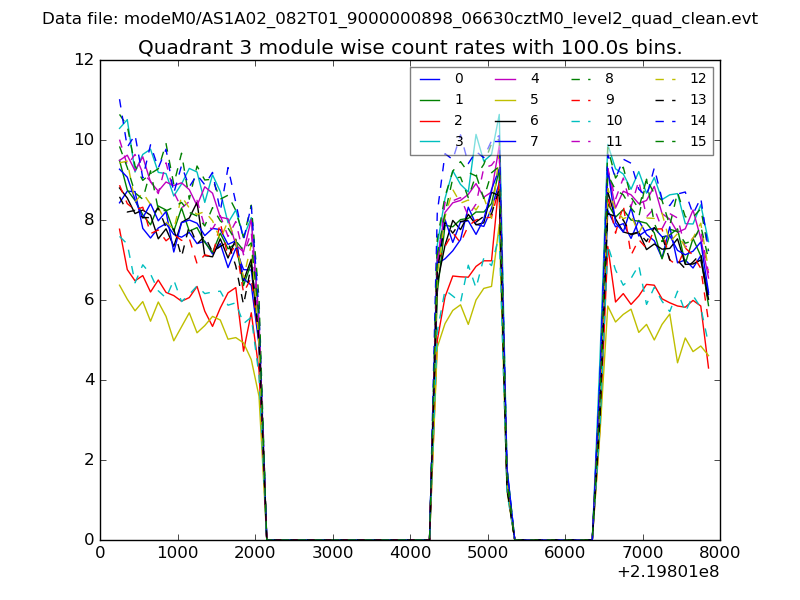
| Module-wise count rates for Quadrant C Data is divided into 100 sec bins |
 |
 |
| Module-wise count rates for Quadrant D Data is divided into 100 sec bins |
 |
 |
| Parameter | Plot |
|---|---|
| CZT HV Monitor | 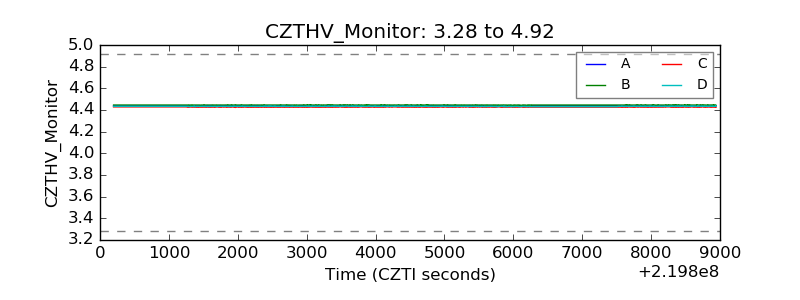 |
| D_VDD | 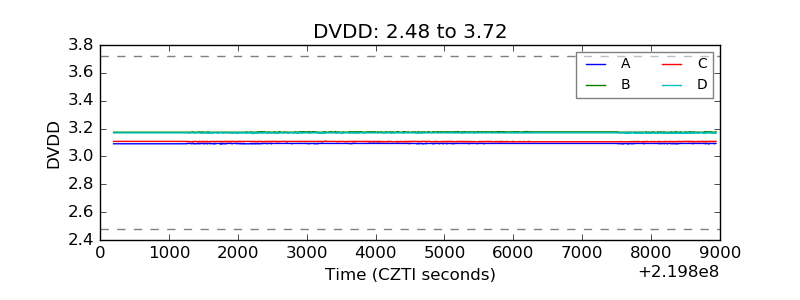 |
| Temperature 1 | 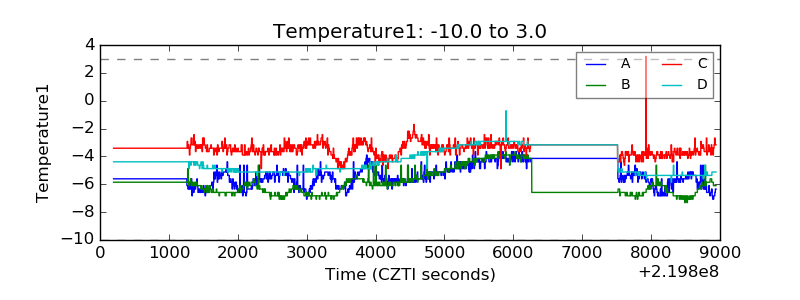 |
| Veto HV Monitor | 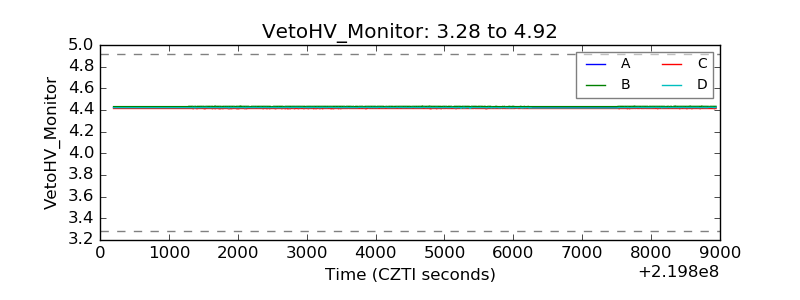 |
| Veto LLD | 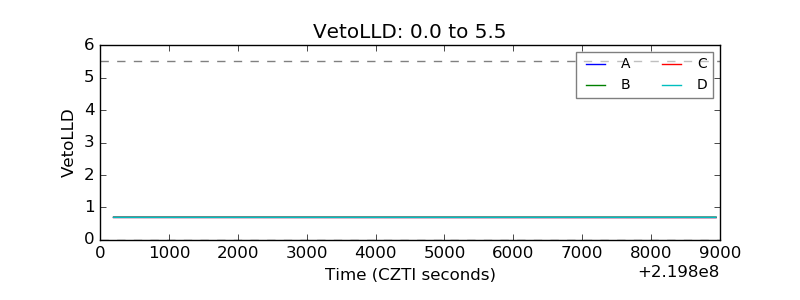 |
| Alpha Counter | 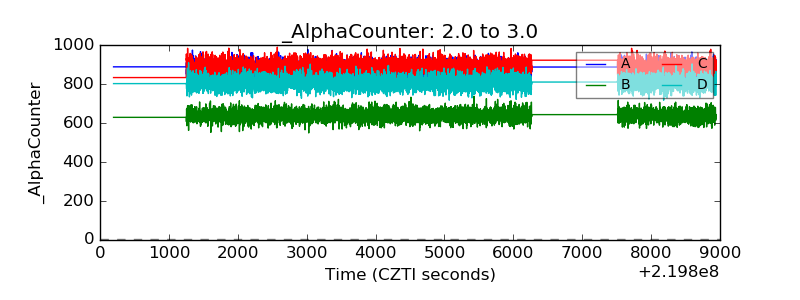 |
| _CPM_Rate | 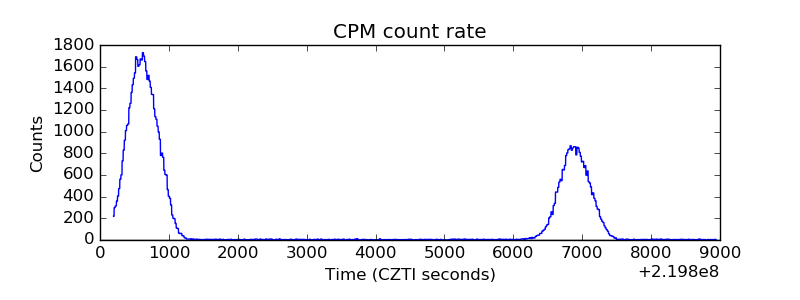 |
| CZT Counter | 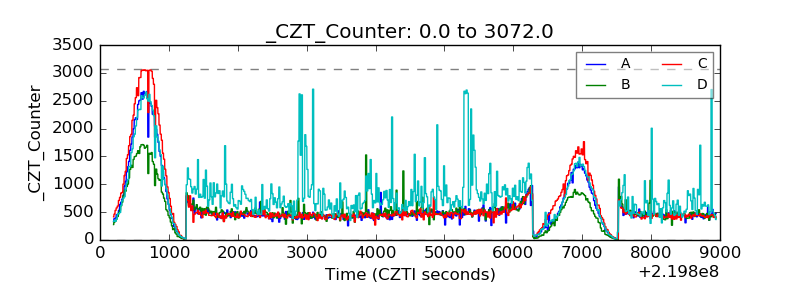 |
| +2.5 Volts monitor |  |
| +5 Volts monitor |  |
| _ROLL_ROT | 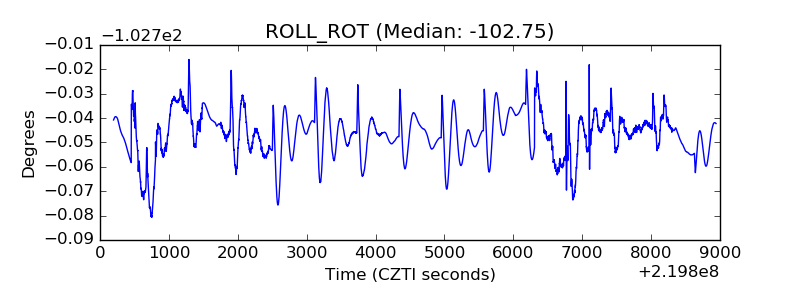 |
| _Roll_DEC | 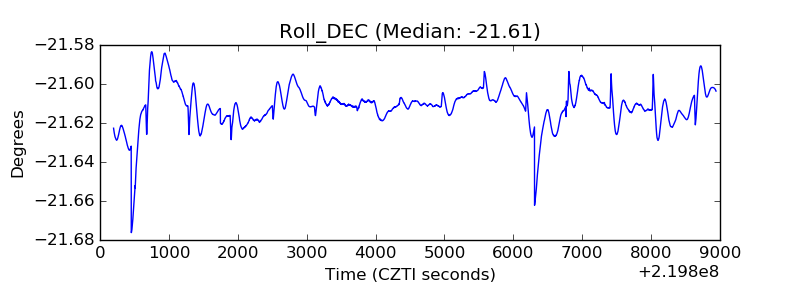 |
| _Roll_RA | 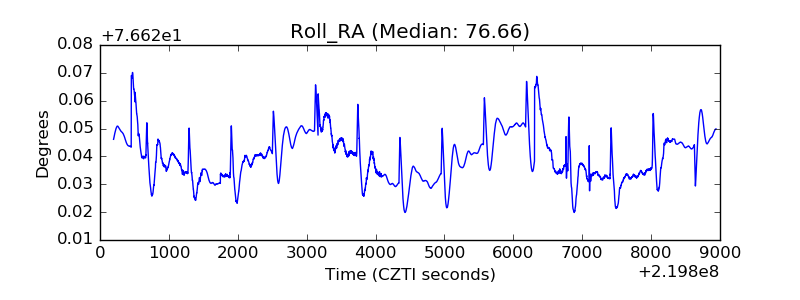 |
| Veto Counter | 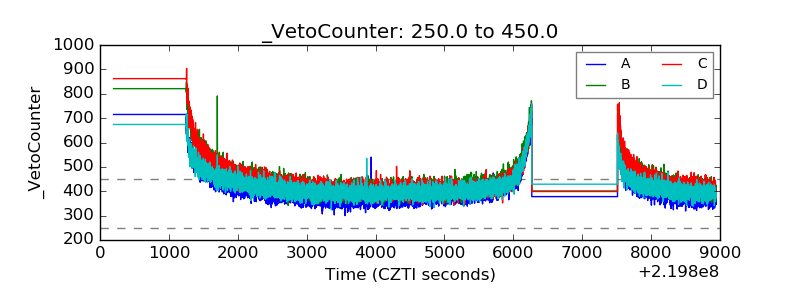 |