| Param | Original file | Final file |
|---|---|---|
| Filename | modeM0/AS1G06_157T02_9000001008_07353cztM0_level2.evt | modeM0/AS1G06_157T02_9000001008_07353cztM0_level2_quad_clean.evt |
| Size (bytes) | 507,179,520 | 101,831,040 |
| Size | 483.7 MB | 97.1 MB |
| Events in quadrant A | 3,145,317 | 653,650 |
| Events in quadrant B | 3,343,196 | 678,930 |
| Events in quadrant C | 4,052,112 | 665,649 |
| Events in quadrant D | 4,367,644 | 621,593 |
| Mode M0 | |||
|---|---|---|---|
| Quadrant | BADHDUFLAG | Total packets | Discarded packets |
| A | 0 | 13894 | 3 |
| B | 0 | 14488 | 2 |
| C | 0 | 16708 | 2 |
| D | 0 | 17537 | 2 |
| Mode SS | |||
|---|---|---|---|
| Quadrant | BADHDUFLAG | Total packets | Discarded packets |
| A | 0 | 138 | 0 |
| B | 0 | 138 | 0 |
| C | 0 | 138 | 0 |
| D | 0 | 138 | 0 |
| Mode M9 | |||
|---|---|---|---|
| Quadrant | BADHDUFLAG | Total packets | Discarded packets |
| A | 0 | 26 | 0 |
| B | 0 | 26 | 0 |
| C | 0 | 26 | 0 |
| D | 0 | 26 | 0 |
| Quadrant | Total seconds | Saturated seconds | Saturation percentage |
|---|---|---|---|
| A | 6655 | 42 | 0.631104% |
| B | 6655 | 66 | 0.991736% |
| C | 6655 | 73 | 1.096920% |
| D | 6655 | 261 | 3.921863% |
Noise dominated data is calculated using 1-second bins in cleaned event files. If a bin has >2000 counts, and if more than 50% of those come from <1% of pixels, then it is considered to be noise-dominated and hence unusable.
| Quadrant | # 1 sec bins | Bins with >0 counts | Bins with >2000 counts | High rate bins dominated by noise | Noise dominated (total time) | Noise dominated (detector-on time) | Marked lightcurve |
|---|---|---|---|---|---|---|---|
| A | 9340 | 6657 | 0 | 0 | 0.00% | 0.00% | 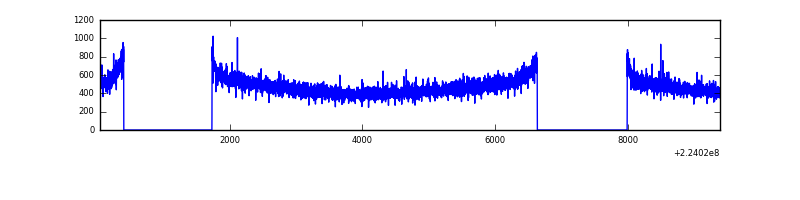 |
| B | 9340 | 6657 | 0 | 0 | 0.00% | 0.00% | 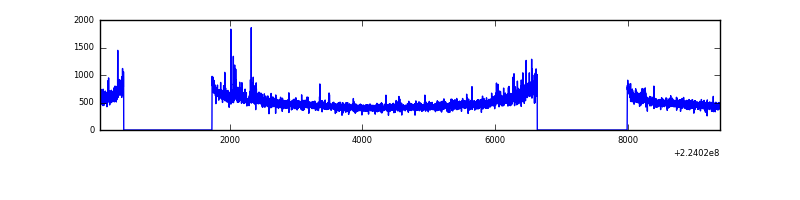 |
| C | 9340 | 6657 | 0 | 0 | 0.00% | 0.00% | 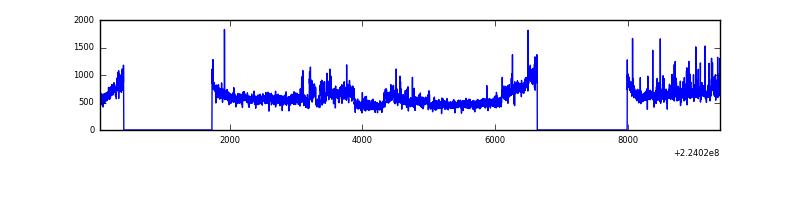 |
| D | 9340 | 6657 | 158 | 158 | 1.69% | 2.37% | 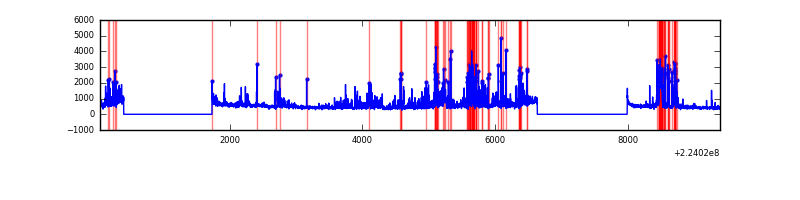 |
Top three noisy pixels from each quadrant. If the there are fewer than three noisy pixels in the level2.evt file, extra rows are filled as -1
| Pixel properties | Quadrant properties | ||||||
|---|---|---|---|---|---|---|---|
| Quadrant | DetID | PixID | Counts | Sigma | Mean | Median | Sigma |
| A | 0 | 226 | 7971 | 43.04 | 815 | 799 | 166.6 |
| A | 12 | 194 | 7204 | 38.44 | 815 | 799 | 166.6 |
| A | 15 | 239 | 6576 | 34.67 | 815 | 799 | 166.6 |
| B | 0 | 214 | 100520 | 630.22 | 833 | 814 | 158.2 |
| B | 12 | 111 | 15974 | 95.82 | 833 | 814 | 158.2 |
| B | 4 | 81 | 14514 | 86.59 | 833 | 814 | 158.2 |
| C | 9 | 68 | 900815 | 4831.35 | 807 | 812 | 186.3 |
| C | 13 | 61 | 6235 | 29.11 | 807 | 812 | 186.3 |
| C | 1 | 16 | 3152 | 12.56 | 807 | 812 | 186.3 |
| D | 1 | 52 | 856382 | 4396.48 | 789 | 765 | 194.6 |
| D | 2 | 216 | 202696 | 1037.6 | 789 | 765 | 194.6 |
| D | 14 | 34 | 138897 | 709.77 | 789 | 765 | 194.6 |
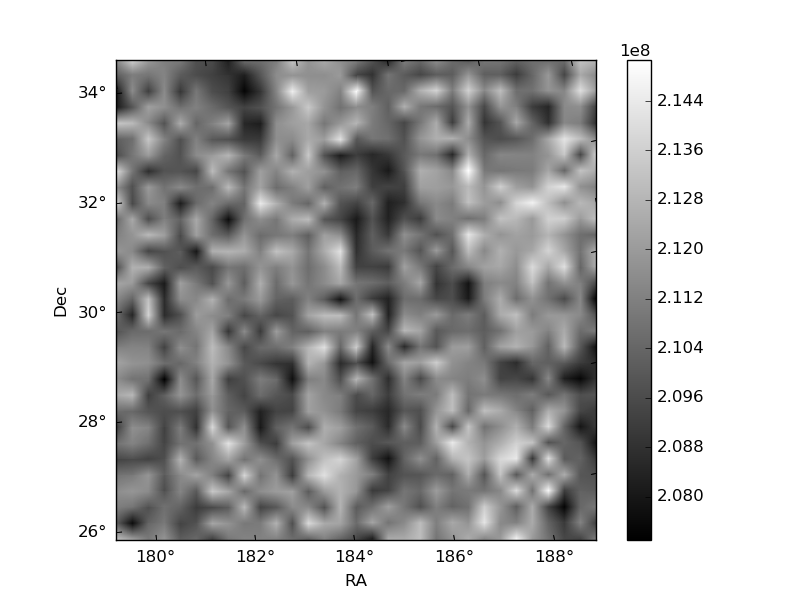
Histogram calculated using DETX and DETY for each event in the final _common_clean file
| Quadrant A | 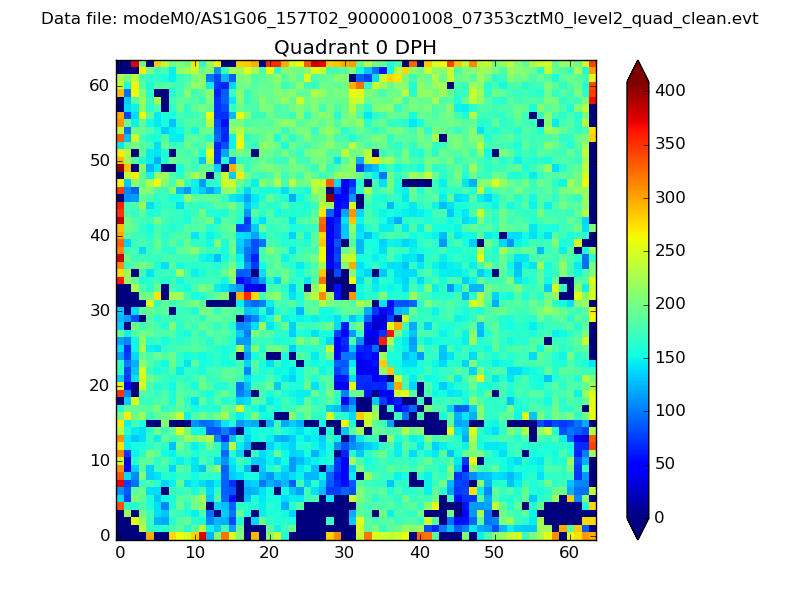 |
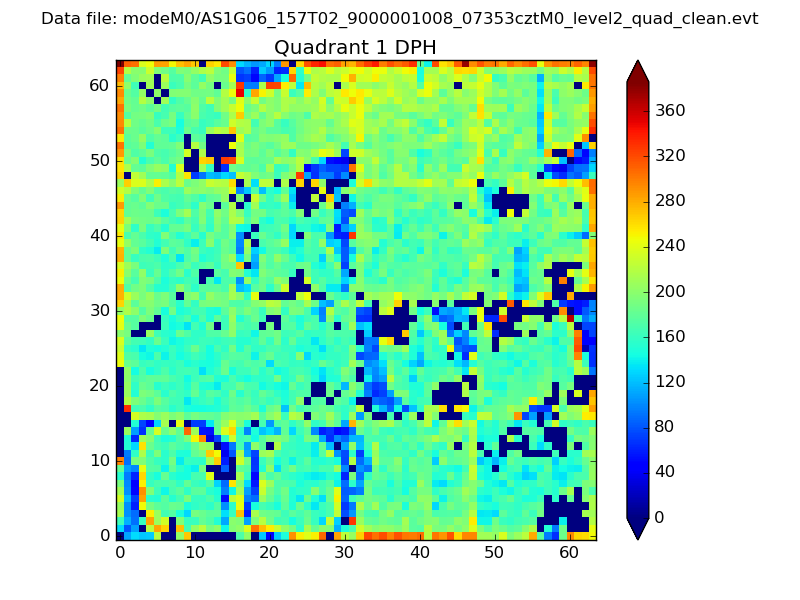 |
Quadrant B |
|---|---|---|---|
| Quadrant D | 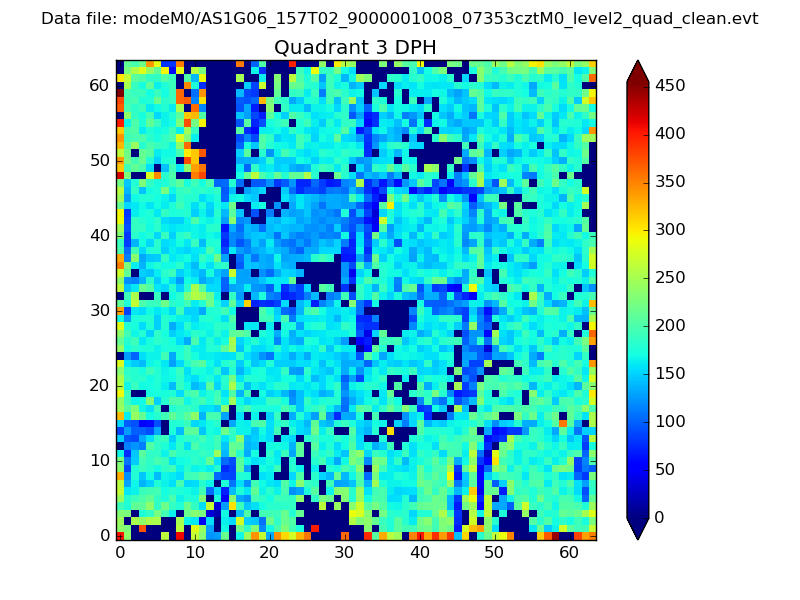 |
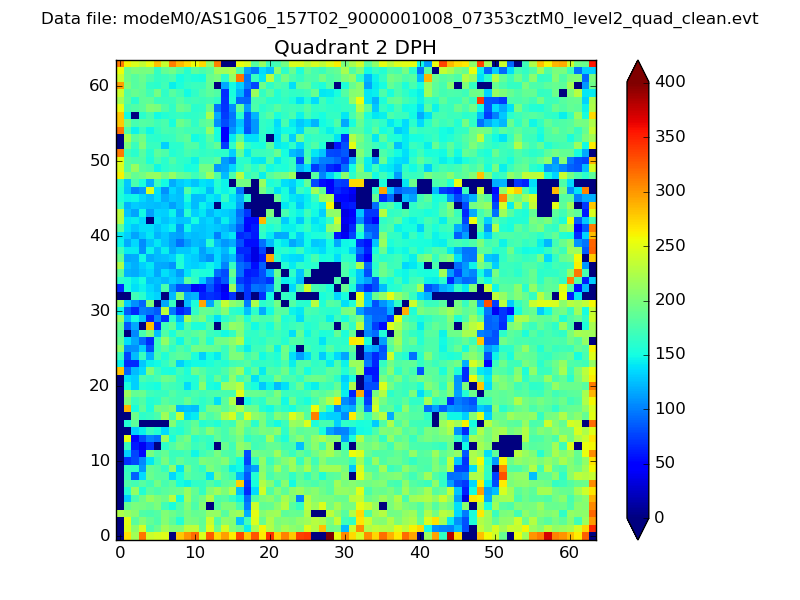 |
Quadrant C |
| Plot type | Count rate plots | Images |
|---|---|---|
| Comparison with Poisson distribution Blue bars denote a histogram of data divided into 1 sec bins. Red curve is a Poisson curve with rate = median count rate of data. |
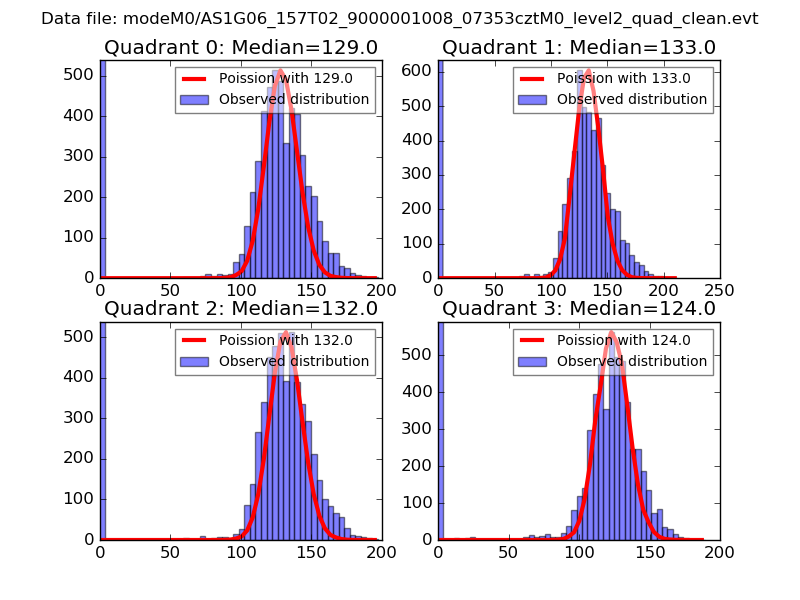 |
 |
| Quadrant-wise count rates Data is divided into 100 sec bins |
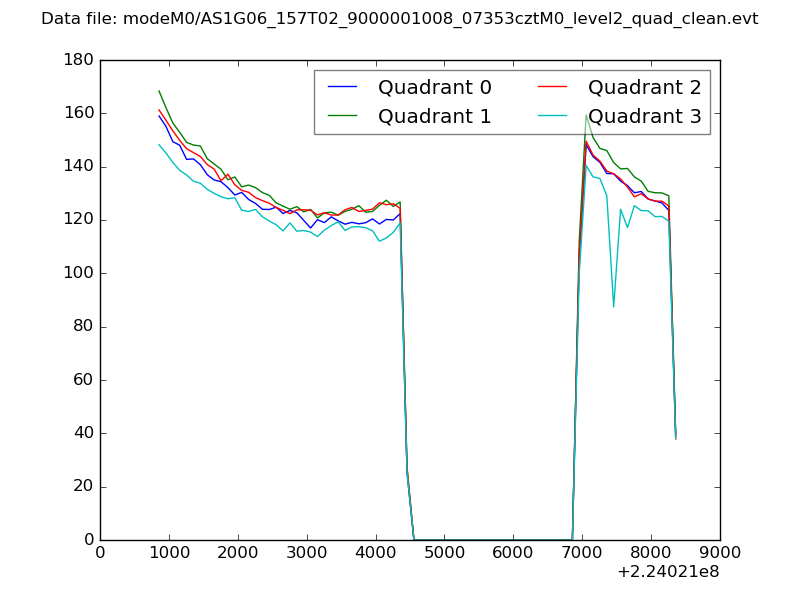 |
|
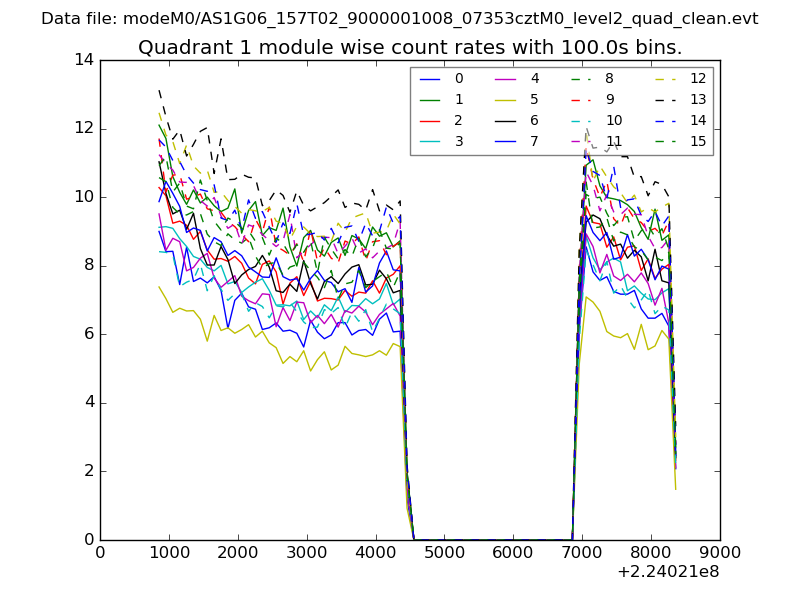
| Module-wise count rates for Quadrant A Data is divided into 100 sec bins |
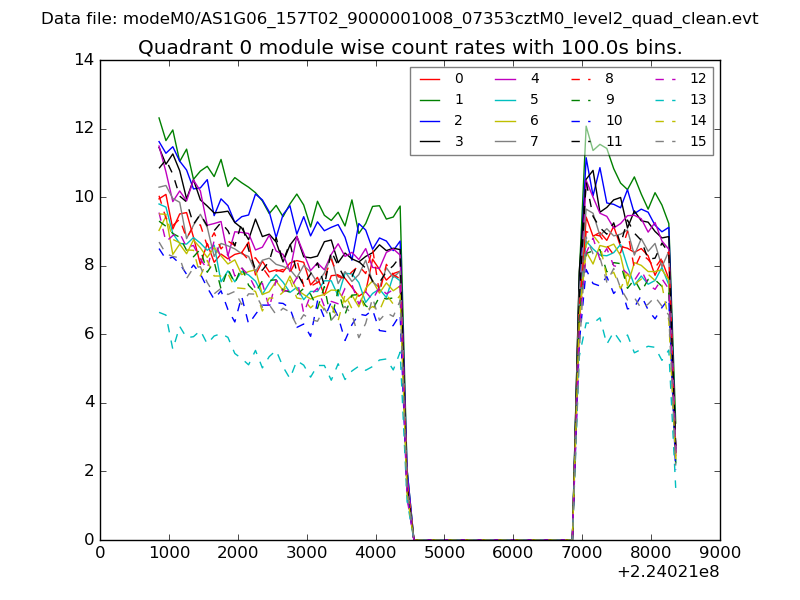 |
 |
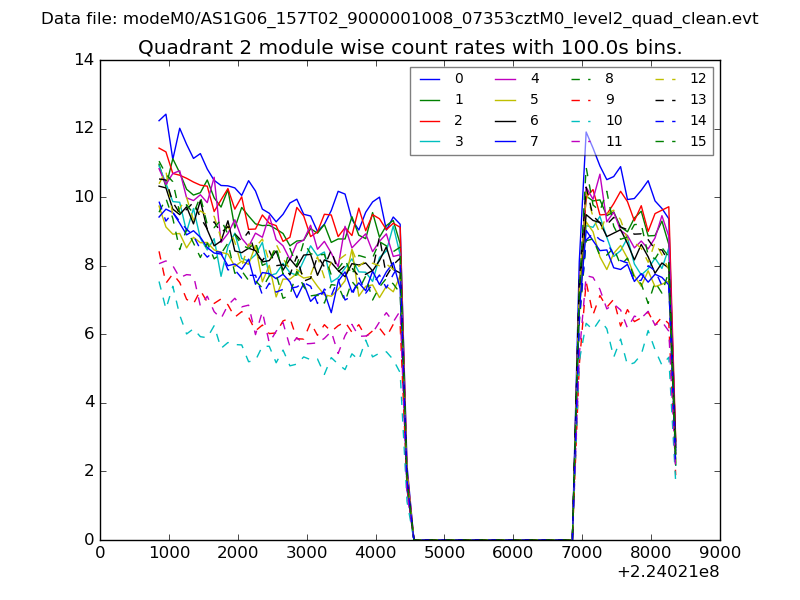
| Module-wise count rates for Quadrant B Data is divided into 100 sec bins |
 |
 |
| Module-wise count rates for Quadrant C Data is divided into 100 sec bins |
 |
 |
| Module-wise count rates for Quadrant D Data is divided into 100 sec bins |
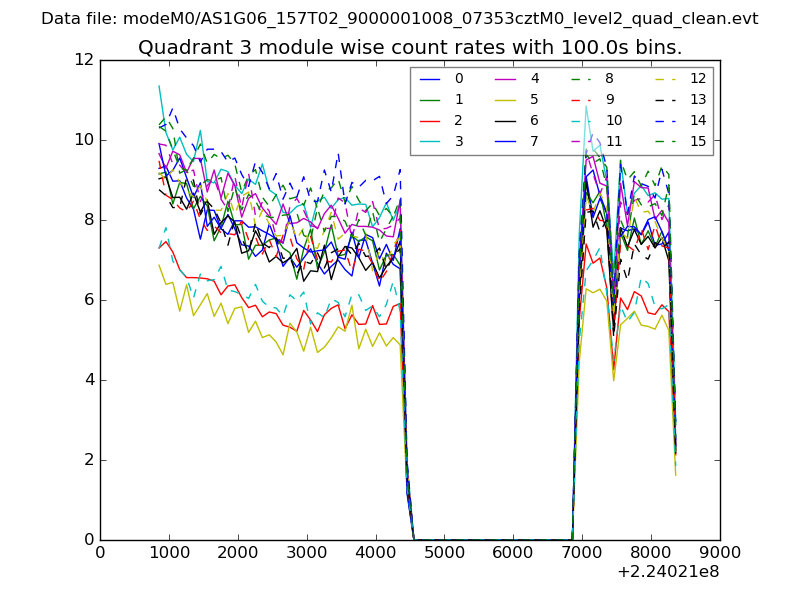 |
 |
| Parameter | Plot |
|---|---|
| CZT HV Monitor | 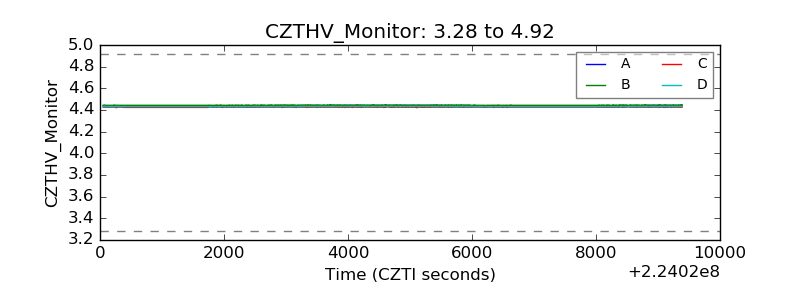 |
| D_VDD | 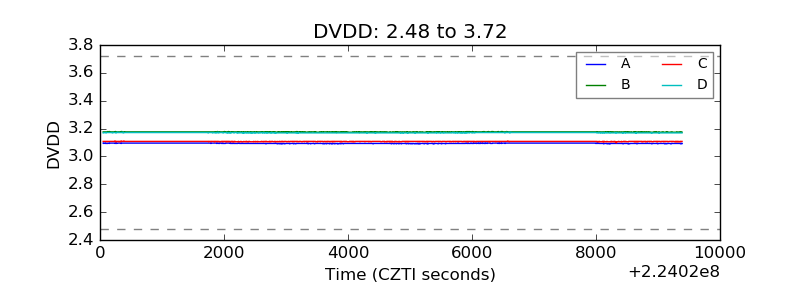 |
| Temperature 1 | 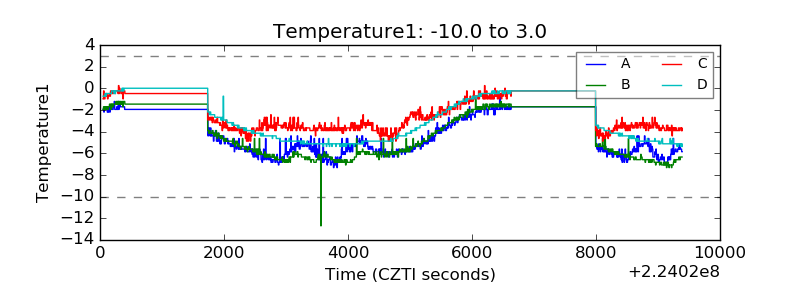 |
| Veto HV Monitor |  |
| Veto LLD | 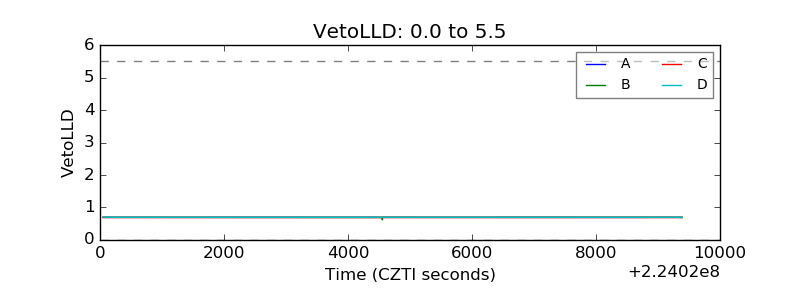 |
| Alpha Counter | 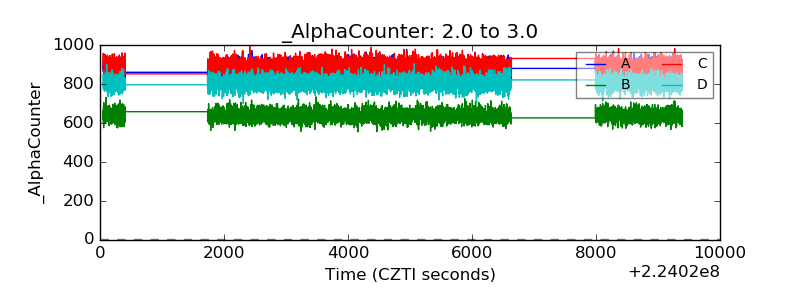 |
| _CPM_Rate | 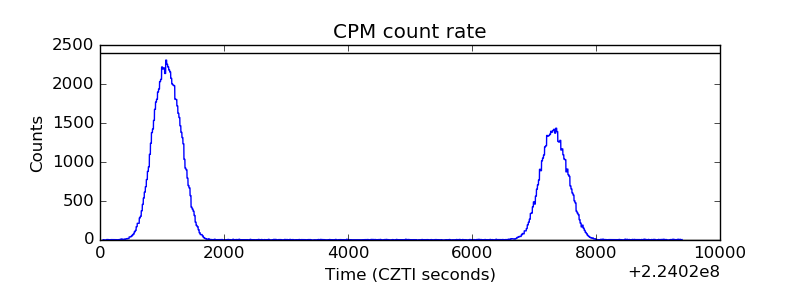 |
| CZT Counter | 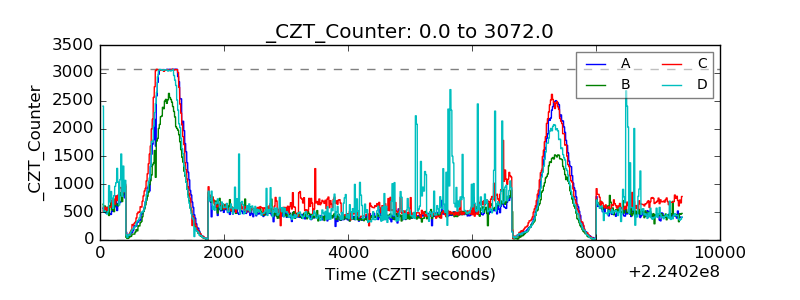 |
| +2.5 Volts monitor |  |
| +5 Volts monitor |  |
| _ROLL_ROT | 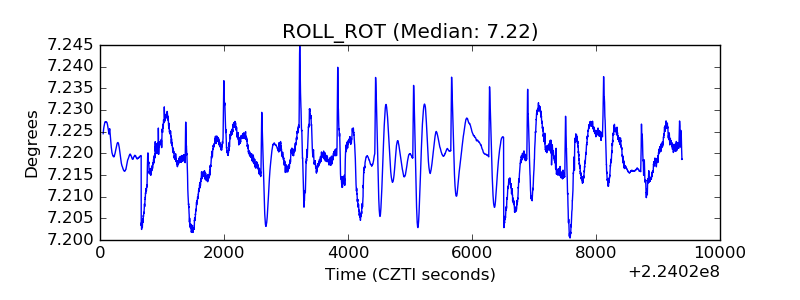 |
| _Roll_DEC | 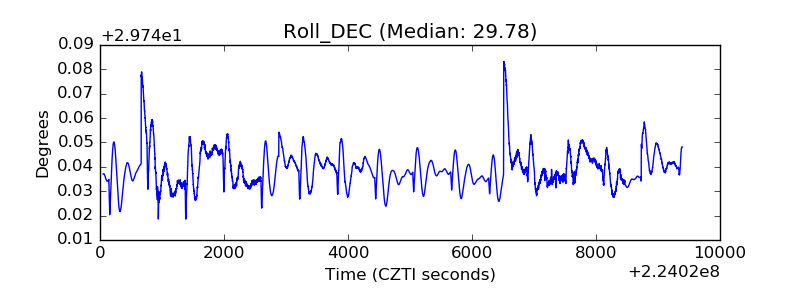 |
| _Roll_RA |  |
| Veto Counter | 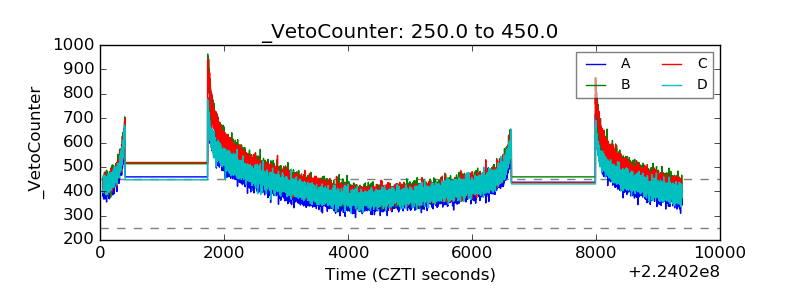 |