| Param | Original file | Final file |
|---|---|---|
| Filename | modeM0/AS1G06_117T01_9000001046_07590cztM0_level2.evt | modeM0/AS1G06_117T01_9000001046_07590cztM0_level2_quad_clean.evt |
| Size (bytes) | 19,592,640 | 3,447,360 |
| Size | 18.7 MB | 3.3 MB |
| Events in quadrant A | 80,327 | 20,667 |
| Events in quadrant B | 76,123 | 21,278 |
| Events in quadrant C | 334,369 | 19,168 |
| Events in quadrant D | 85,430 | 20,590 |
| Mode SS | |||
|---|---|---|---|
| Quadrant | BADHDUFLAG | Total packets | Discarded packets |
| A | 0 | 4 | 0 |
| B | 0 | 4 | 0 |
| C | 0 | 4 | 0 |
| D | 0 | 4 | 0 |
| Mode M0 | |||
|---|---|---|---|
| Quadrant | BADHDUFLAG | Total packets | Discarded packets |
| A | 0 | 397 | 1 |
| B | 0 | 393 | 0 |
| C | 0 | 1135 | 0 |
| D | 0 | 425 | 0 |
| Quadrant | Total seconds | Saturated seconds | Saturation percentage |
|---|---|---|---|
| A | 197 | 0 | 0.000000% |
| B | 197 | 0 | 0.000000% |
| C | 197 | 38 | 19.289340% |
| D | 197 | 0 | 0.000000% |
Noise dominated data is calculated using 1-second bins in cleaned event files. If a bin has >2000 counts, and if more than 50% of those come from <1% of pixels, then it is considered to be noise-dominated and hence unusable.
| Quadrant | # 1 sec bins | Bins with >0 counts | Bins with >2000 counts | High rate bins dominated by noise | Noise dominated (total time) | Noise dominated (detector-on time) | Marked lightcurve |
|---|---|---|---|---|---|---|---|
| A | 197 | 197 | 0 | 0 | 0.00% | 0.00% |  |
| B | 197 | 197 | 0 | 0 | 0.00% | 0.00% |  |
| C | 197 | 197 | 74 | 74 | 37.56% | 37.56% | 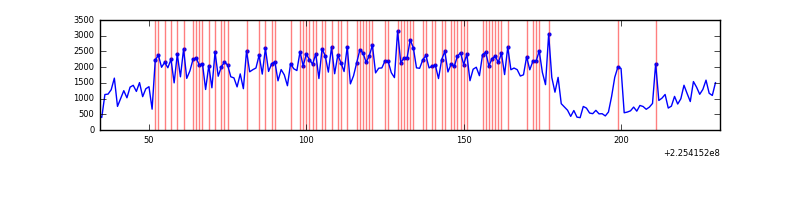 |
| D | 197 | 197 | 0 | 0 | 0.00% | 0.00% | 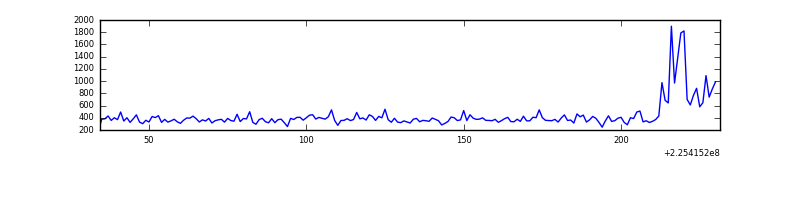 |
Top three noisy pixels from each quadrant. If the there are fewer than three noisy pixels in the level2.evt file, extra rows are filled as -1
| Pixel properties | Quadrant properties | ||||||
|---|---|---|---|---|---|---|---|
| Quadrant | DetID | PixID | Counts | Sigma | Mean | Median | Sigma |
| A | 15 | 239 | 5168 | 875.77 | 19 | 18 | 5.9 |
| A | 13 | 248 | 835 | 138.93 | 19 | 18 | 5.9 |
| A | 0 | 226 | 163 | 24.66 | 19 | 18 | 5.9 |
| B | 12 | 111 | 387 | 63.97 | 19 | 19 | 5.8 |
| B | 11 | 111 | 311 | 50.76 | 19 | 19 | 5.8 |
| B | 14 | 111 | 230 | 36.68 | 19 | 19 | 5.8 |
| C | 9 | 68 | 262330 | 43674.77 | 18 | 18 | 6.0 |
| C | 13 | 61 | 119 | 16.82 | 18 | 18 | 6.0 |
| C | 3 | 202 | 49 | 5.16 | 18 | 18 | 6.0 |
| D | 2 | 14 | 12654 | 1944.22 | 18 | 17 | 6.5 |
| D | 2 | 152 | 1853 | 282.47 | 18 | 17 | 6.5 |
| D | 2 | 234 | 661 | 99.08 | 18 | 17 | 6.5 |
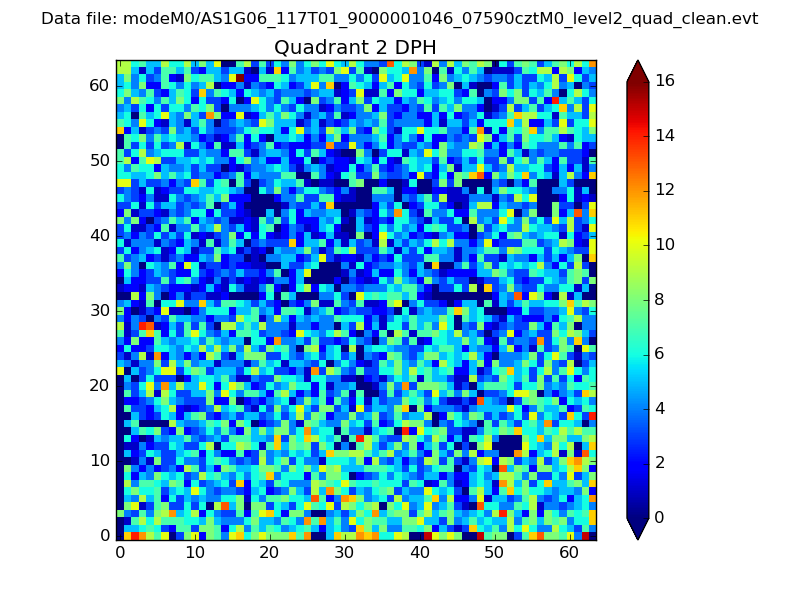
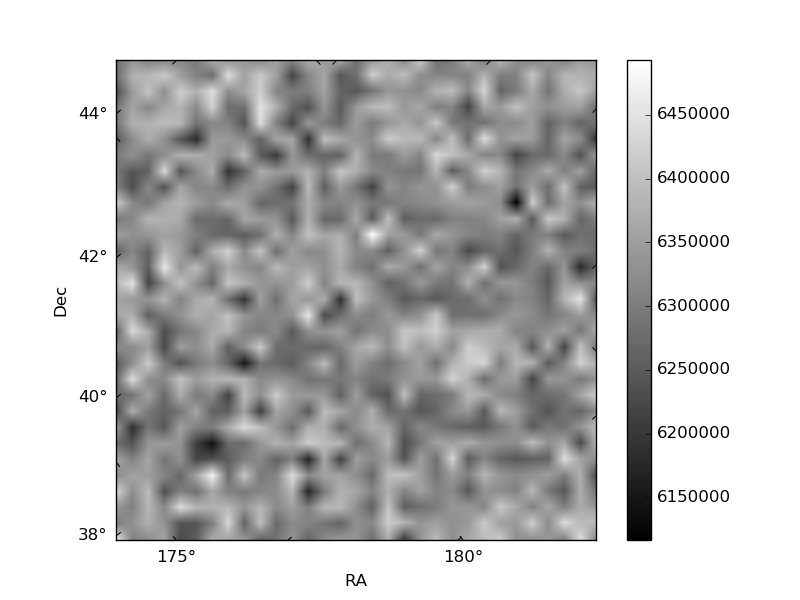
Histogram calculated using DETX and DETY for each event in the final _common_clean file
| Quadrant A | 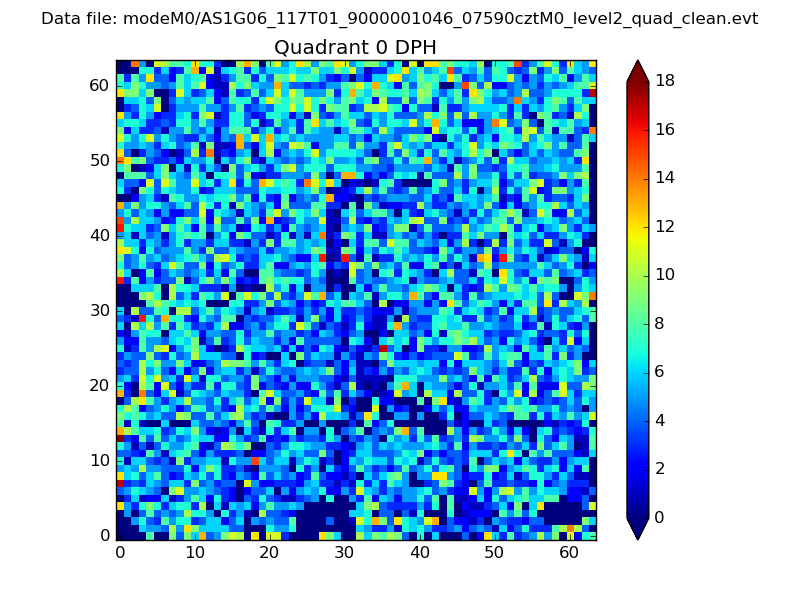 |
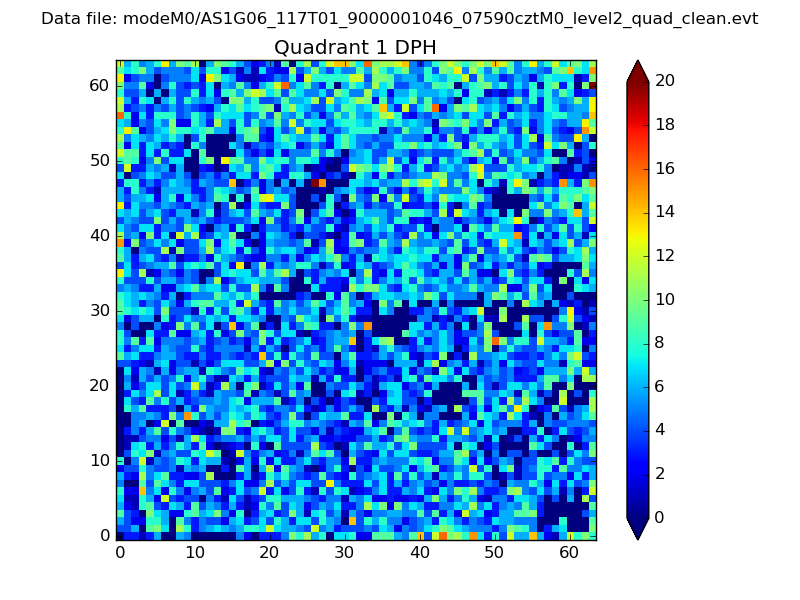 |
Quadrant B |
|---|---|---|---|
| Quadrant D | 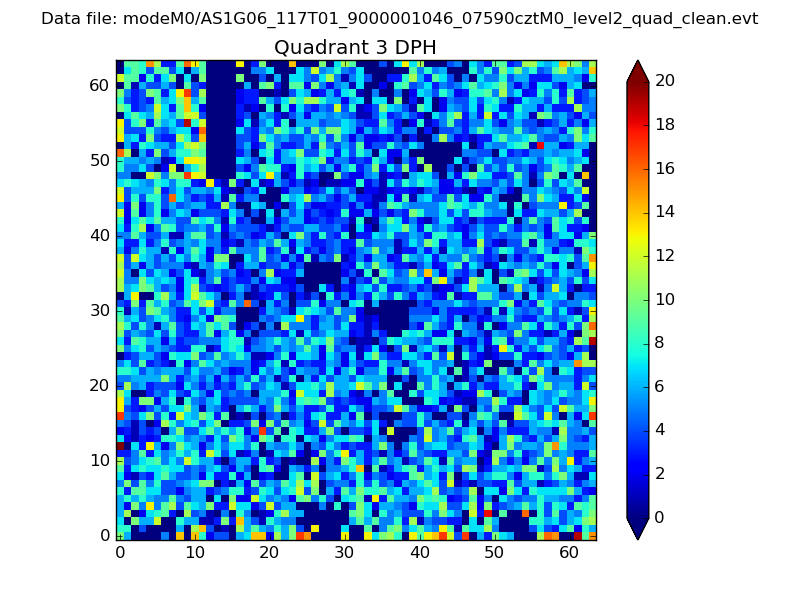 |
 |
Quadrant C |
| Plot type | Count rate plots | Images |
|---|---|---|
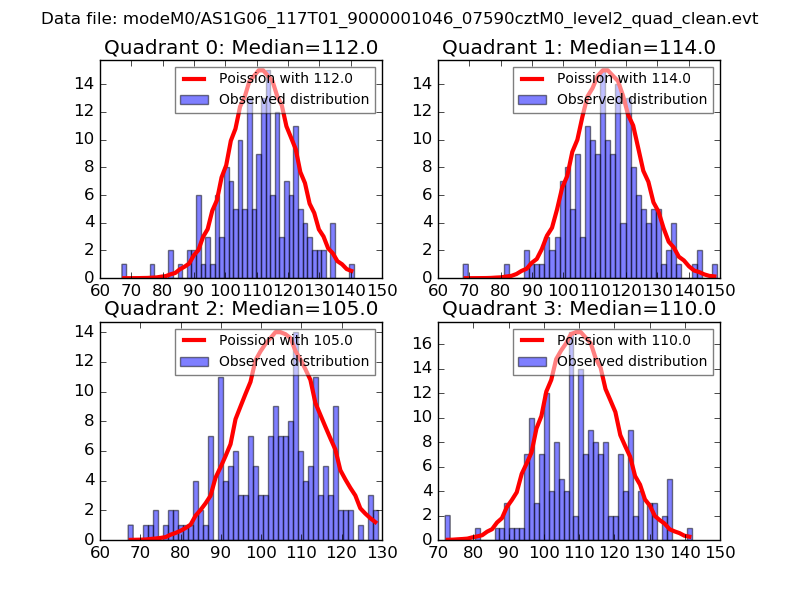
| Comparison with Poisson distribution Blue bars denote a histogram of data divided into 1 sec bins. Red curve is a Poisson curve with rate = median count rate of data. |
 |
 |
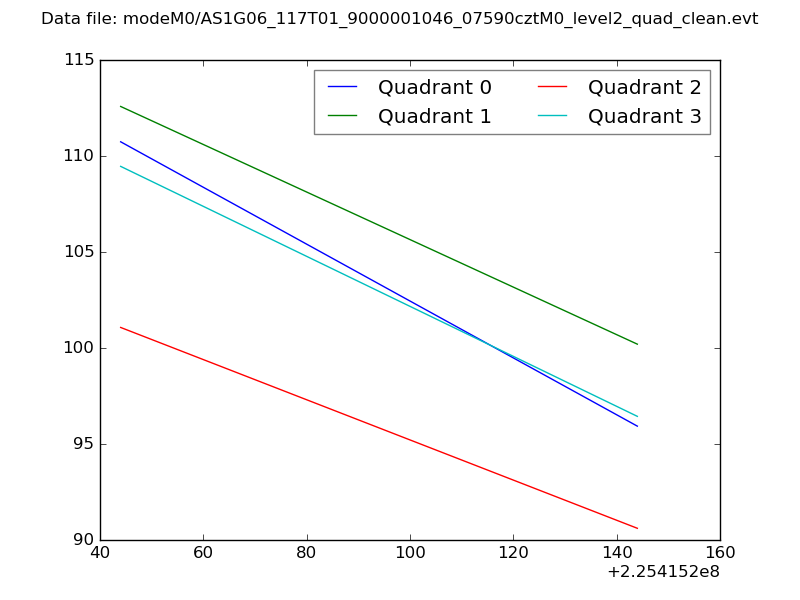
| Quadrant-wise count rates Data is divided into 100 sec bins |
 |
|
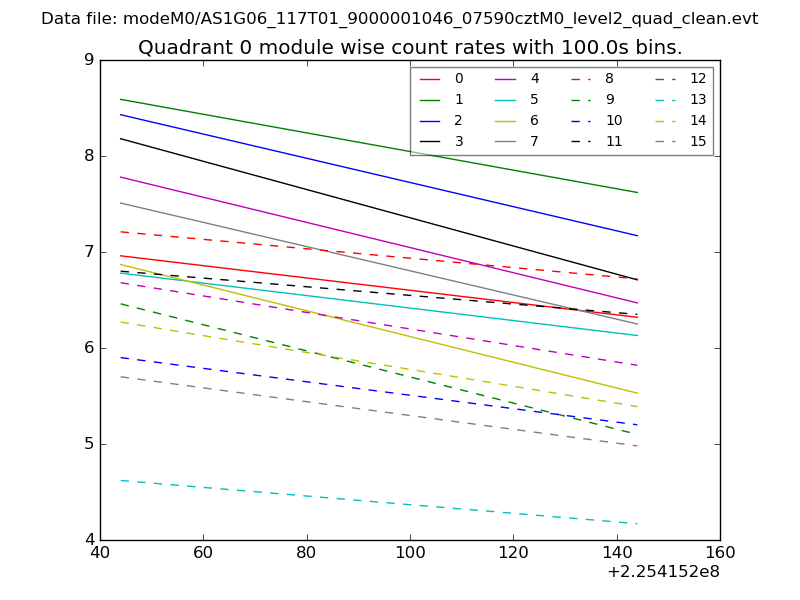
| Module-wise count rates for Quadrant A Data is divided into 100 sec bins |
 |
 |
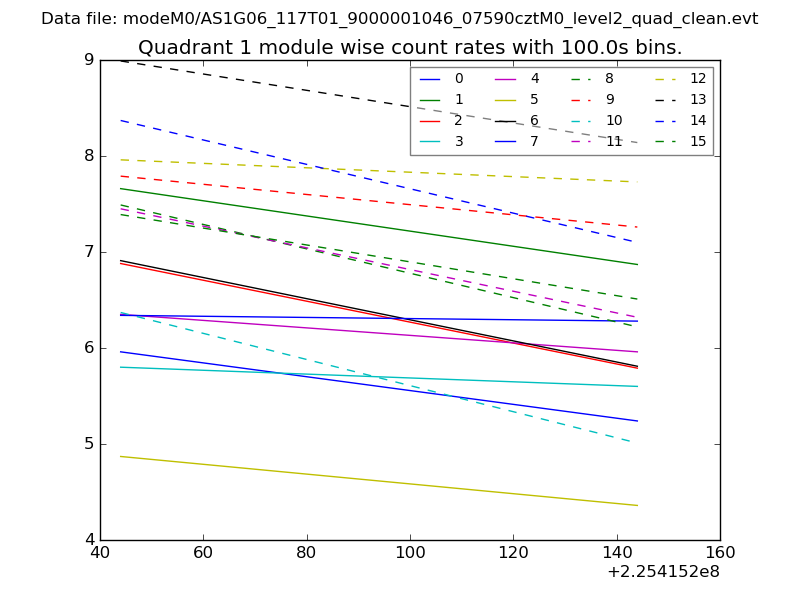
| Module-wise count rates for Quadrant B Data is divided into 100 sec bins |
 |
 |
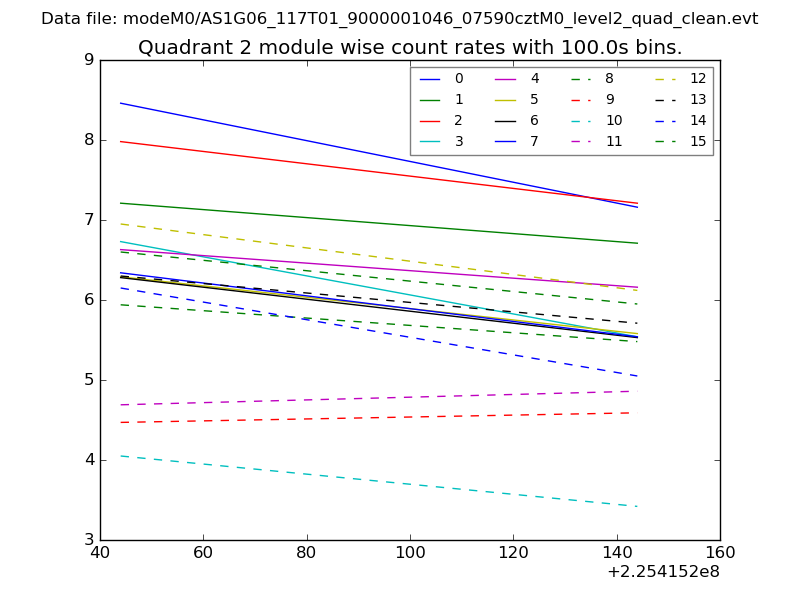
| Module-wise count rates for Quadrant C Data is divided into 100 sec bins |
 |
 |
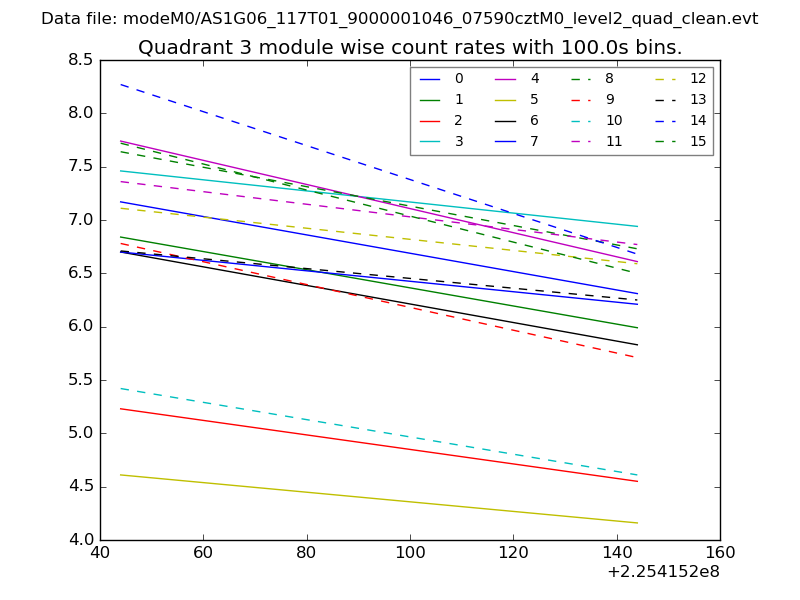
| Module-wise count rates for Quadrant D Data is divided into 100 sec bins |
 |
 |
| Parameter | Plot |
|---|---|
| CZT HV Monitor | 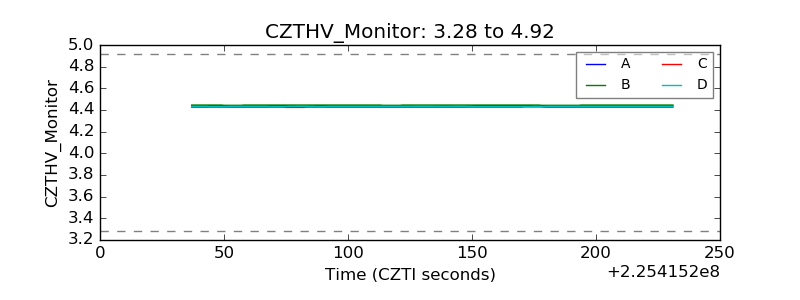 |
| D_VDD | 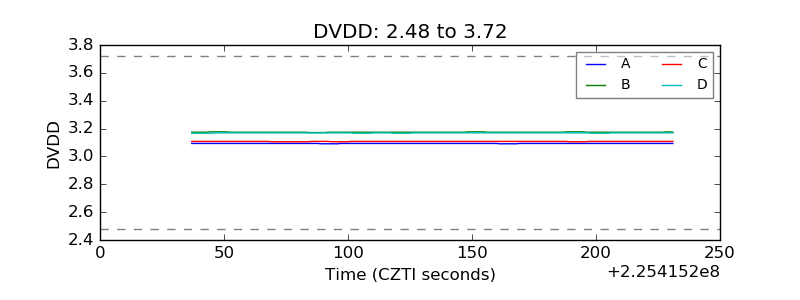 |
| Temperature 1 | 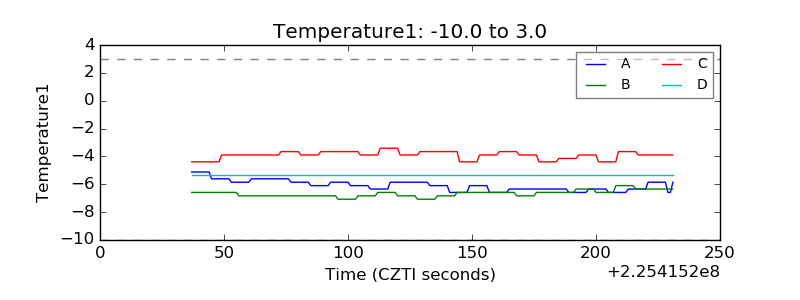 |
| Veto HV Monitor | 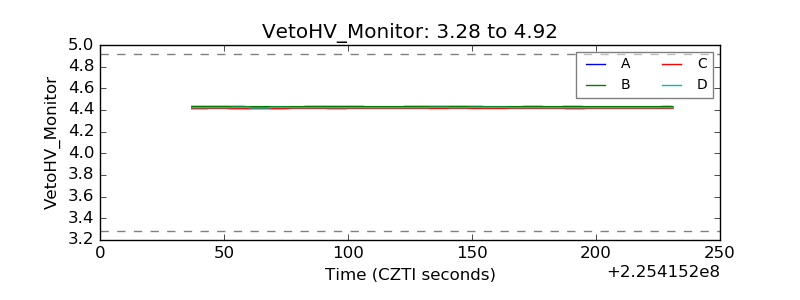 |
| Veto LLD | 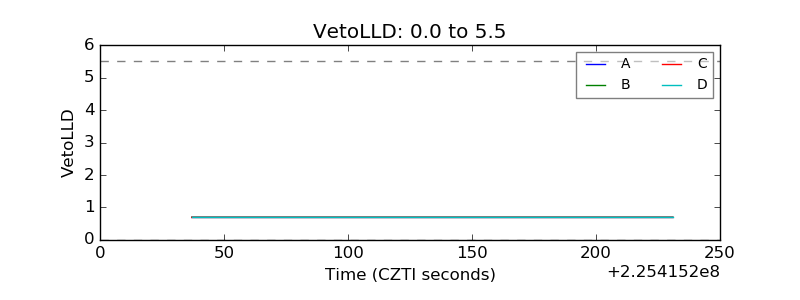 |
| Alpha Counter | 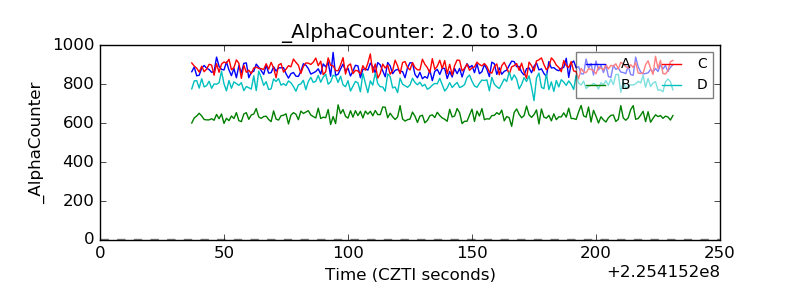 |
| _CPM_Rate | 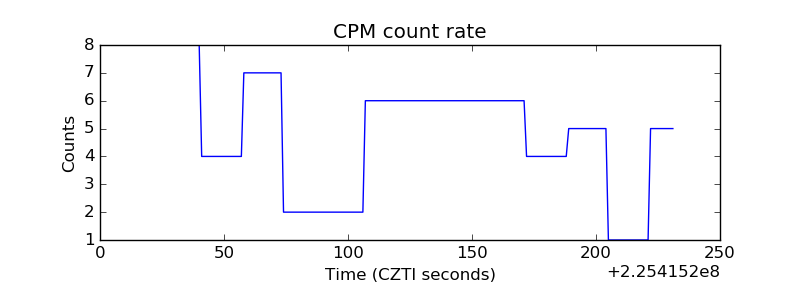 |
| CZT Counter | 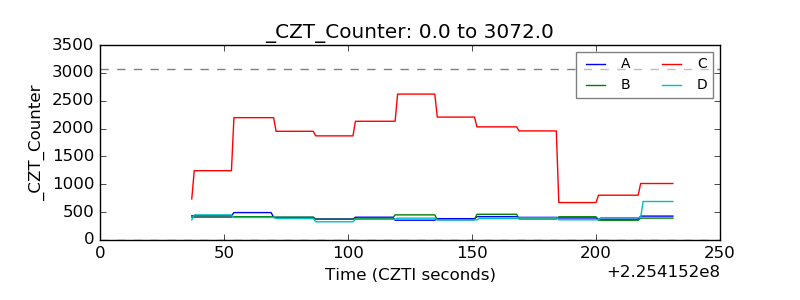 |
| +2.5 Volts monitor |  |
| +5 Volts monitor |  |
| _ROLL_ROT | 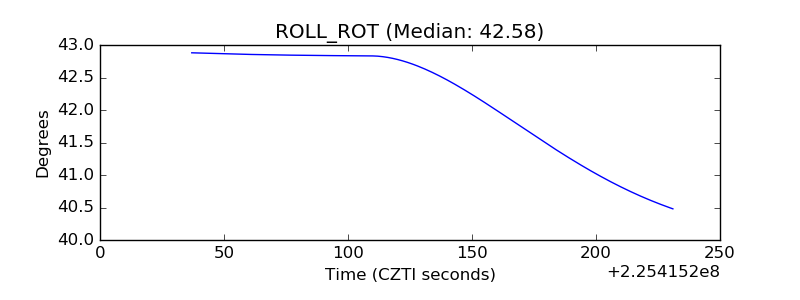 |
| _Roll_DEC | 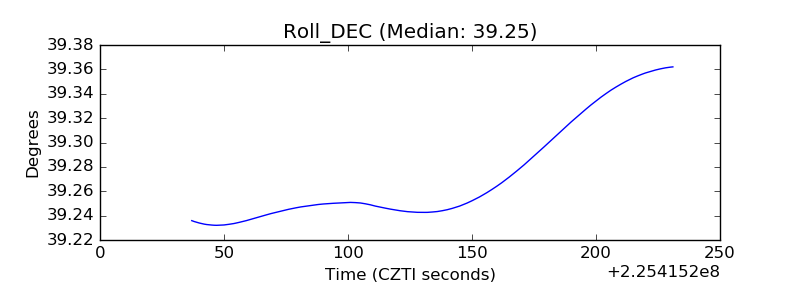 |
| _Roll_RA | 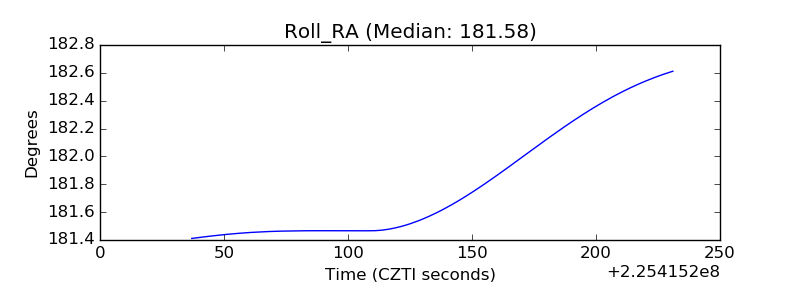 |
| Veto Counter | 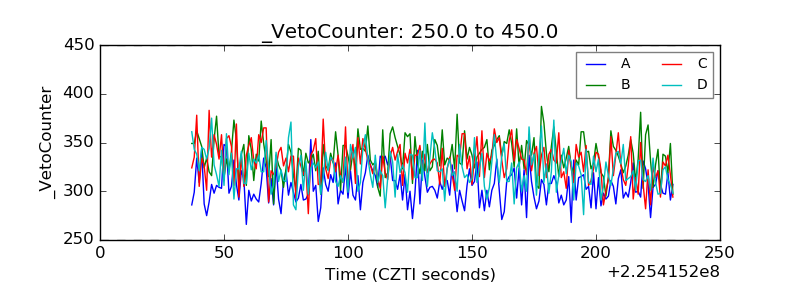 |