| Param | Original file | Final file |
|---|---|---|
| Filename | modeM0/AS1G06_168T20_9000001092_07988cztM0_level2.evt | modeM0/AS1G06_168T20_9000001092_07988cztM0_level2_quad_clean.evt |
| Size (bytes) | 59,281,920 | 4,089,600 |
| Size | 56.5 MB | 3.9 MB |
| Events in quadrant A | 371,082 | 19,469 |
| Events in quadrant B | 460,231 | 18,965 |
| Events in quadrant C | 559,394 | 19,576 |
| Events in quadrant D | 364,144 | 18,831 |
| Mode M0 | |||
|---|---|---|---|
| Quadrant | BADHDUFLAG | Total packets | Discarded packets |
| A | 0 | 1566 | 1 |
| B | 0 | 1801 | 1 |
| C | 0 | 2079 | 1 |
| D | 0 | 1460 | 1 |
| Mode M9 | |||
|---|---|---|---|
| Quadrant | BADHDUFLAG | Total packets | Discarded packets |
| A | 0 | 7 | 0 |
| B | 0 | 7 | 0 |
| C | 0 | 7 | 0 |
| D | 0 | 8 | 0 |
| Mode SS | |||
|---|---|---|---|
| Quadrant | BADHDUFLAG | Total packets | Discarded packets |
| A | 0 | 12 | 0 |
| B | 0 | 12 | 0 |
| C | 0 | 12 | 0 |
| D | 0 | 12 | 0 |
| Quadrant | Total seconds | Saturated seconds | Saturation percentage |
|---|---|---|---|
| A | 547 | 3 | 0.548446% |
| B | 547 | 50 | 9.140768% |
| C | 547 | 29 | 5.301645% |
| D | 547 | 10 | 1.828154% |
Noise dominated data is calculated using 1-second bins in cleaned event files. If a bin has >2000 counts, and if more than 50% of those come from <1% of pixels, then it is considered to be noise-dominated and hence unusable.
| Quadrant | # 1 sec bins | Bins with >0 counts | Bins with >2000 counts | High rate bins dominated by noise | Noise dominated (total time) | Noise dominated (detector-on time) | Marked lightcurve |
|---|---|---|---|---|---|---|---|
| A | 547 | 547 | 0 | 0 | 0.00% | 0.00% | 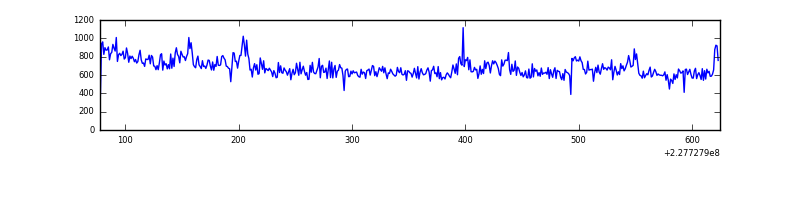 |
| B | 547 | 547 | 14 | 14 | 2.56% | 2.56% | 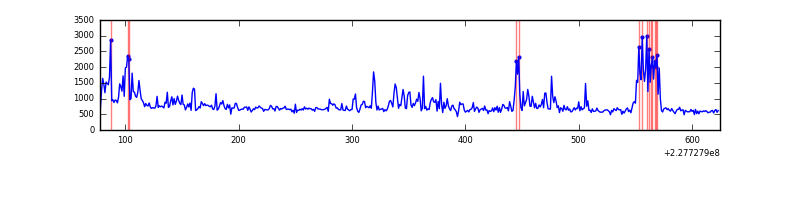 |
| C | 547 | 547 | 4 | 4 | 0.73% | 0.73% | 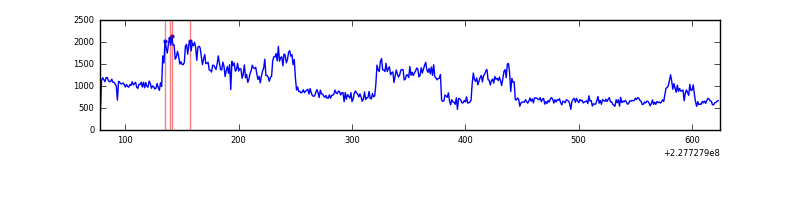 |
| D | 547 | 547 | 5 | 5 | 0.91% | 0.91% | 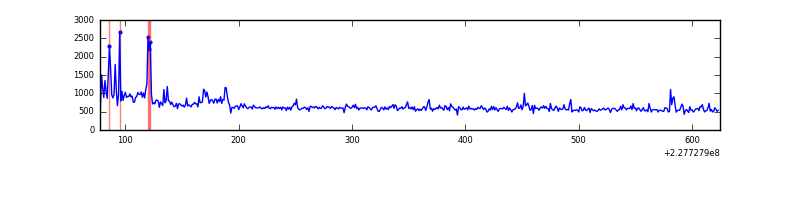 |
Top three noisy pixels from each quadrant. If the there are fewer than three noisy pixels in the level2.evt file, extra rows are filled as -1
| Pixel properties | Quadrant properties | ||||||
|---|---|---|---|---|---|---|---|
| Quadrant | DetID | PixID | Counts | Sigma | Mean | Median | Sigma |
| A | 0 | 128 | 39339 | 2014.91 | 85 | 83 | 19.5 |
| A | 0 | 226 | 843 | 39.01 | 85 | 83 | 19.5 |
| A | 12 | 194 | 778 | 35.67 | 85 | 83 | 19.5 |
| B | 4 | 239 | 61512 | 3355.13 | 85 | 84 | 18.3 |
| B | 0 | 231 | 46971 | 2560.92 | 85 | 84 | 18.3 |
| B | 4 | 173 | 7615 | 411.33 | 85 | 84 | 18.3 |
| C | 1 | 16 | 215022 | 10003.2 | 85 | 85 | 21.5 |
| C | 10 | 22 | 10336 | 477.08 | 85 | 85 | 21.5 |
| C | 13 | 61 | 644 | 26.02 | 85 | 85 | 21.5 |
| D | 1 | 52 | 33271 | 1461.79 | 85 | 81 | 22.7 |
| D | 13 | 169 | 6211 | 269.98 | 85 | 81 | 22.7 |
| D | 12 | 233 | 1562 | 65.23 | 85 | 81 | 22.7 |
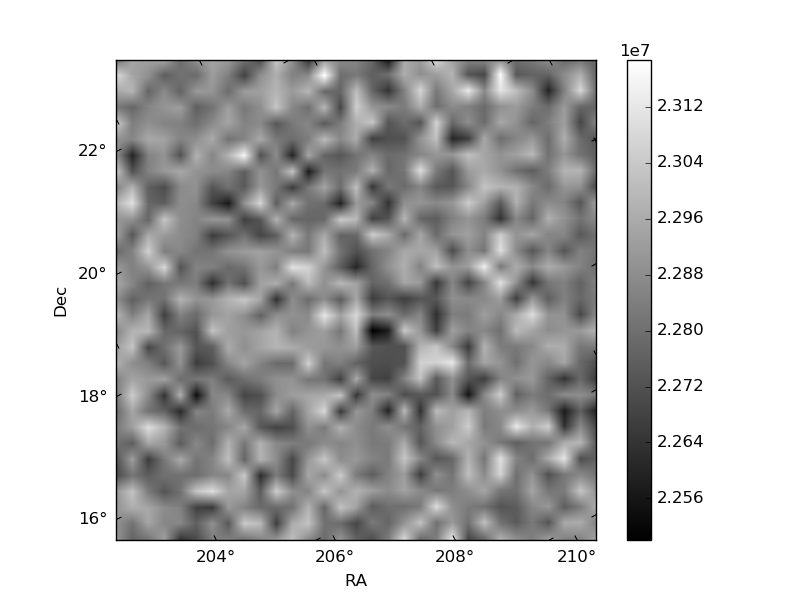
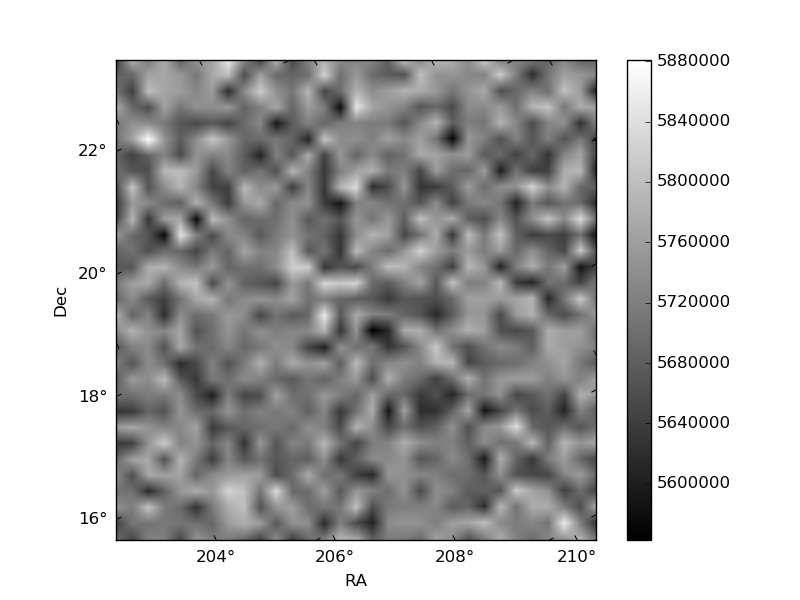
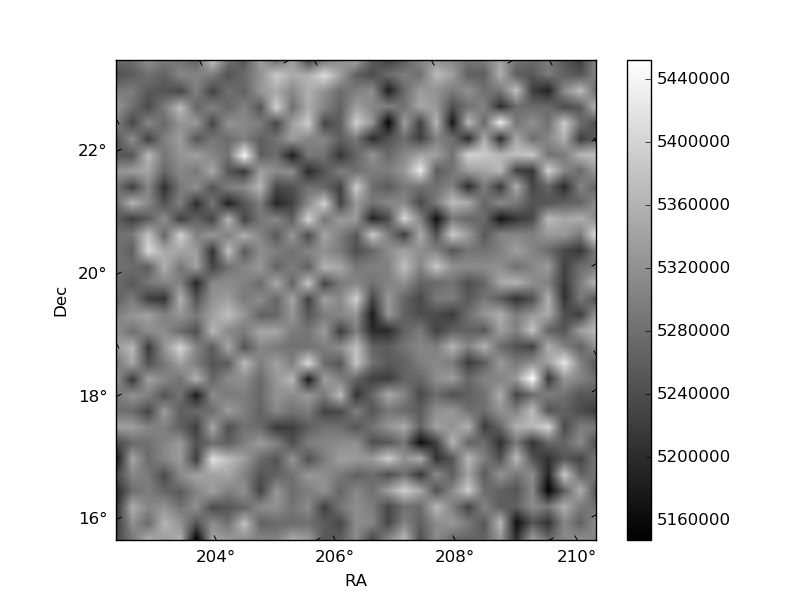
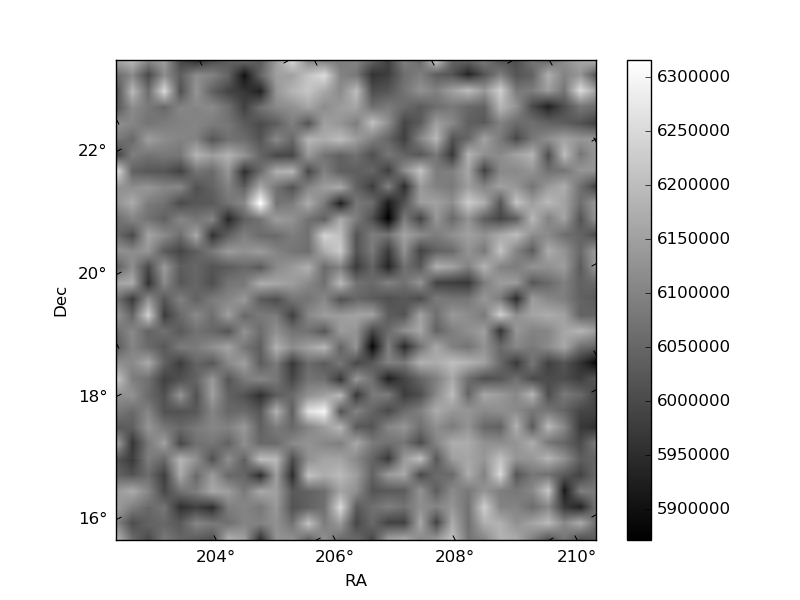
Histogram calculated using DETX and DETY for each event in the final _common_clean file
| Quadrant A | 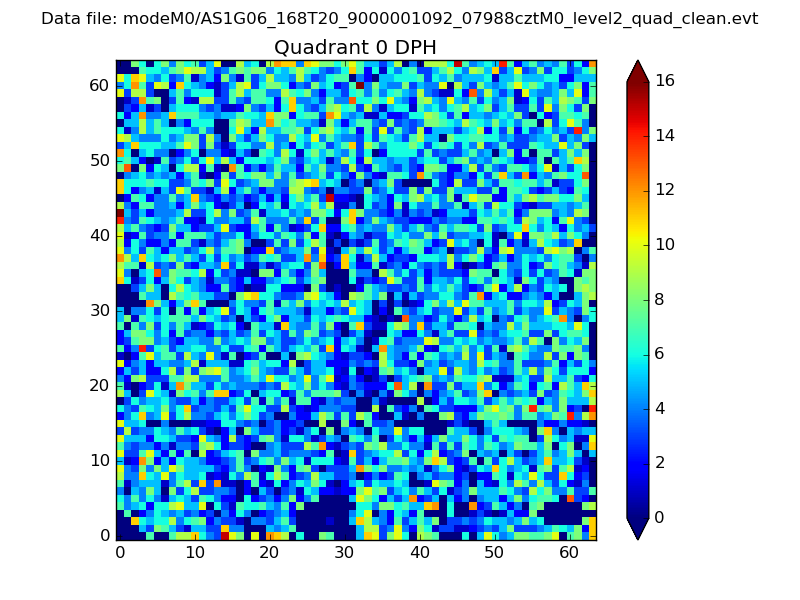 |
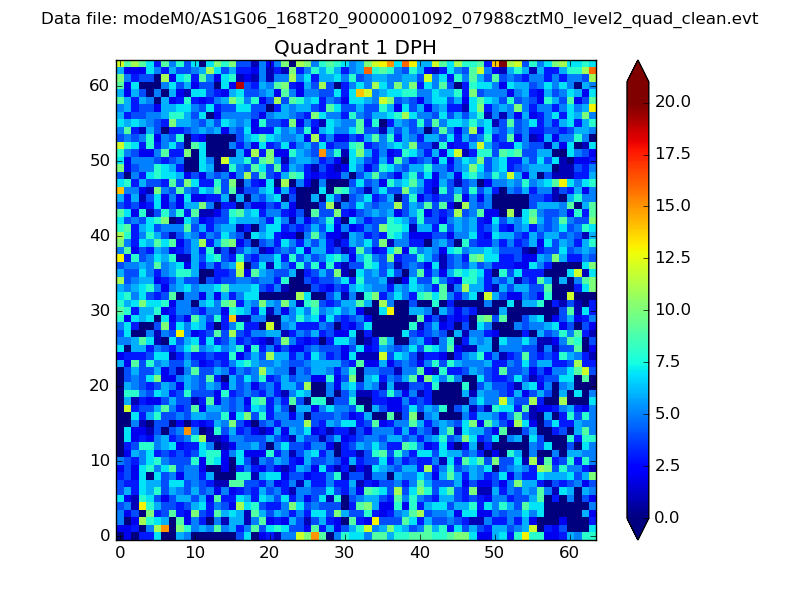 |
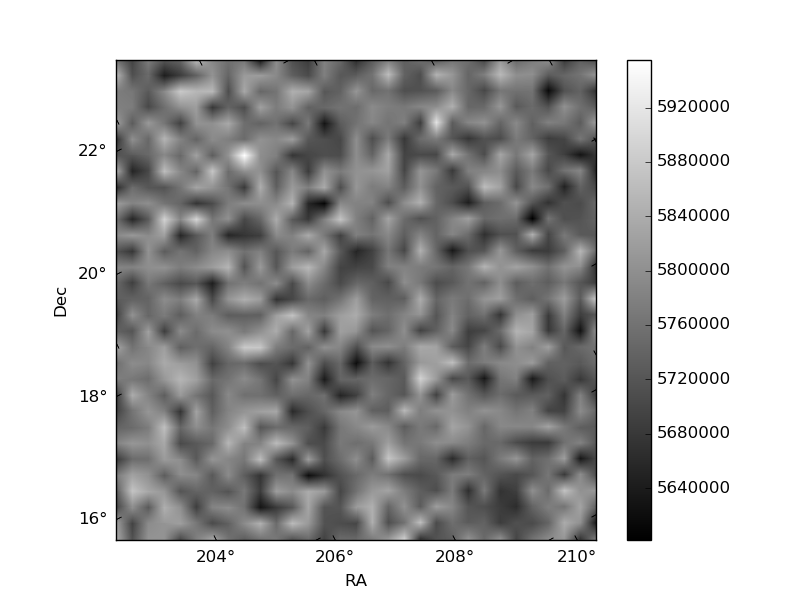
Quadrant B |
|---|---|---|---|
| Quadrant D | 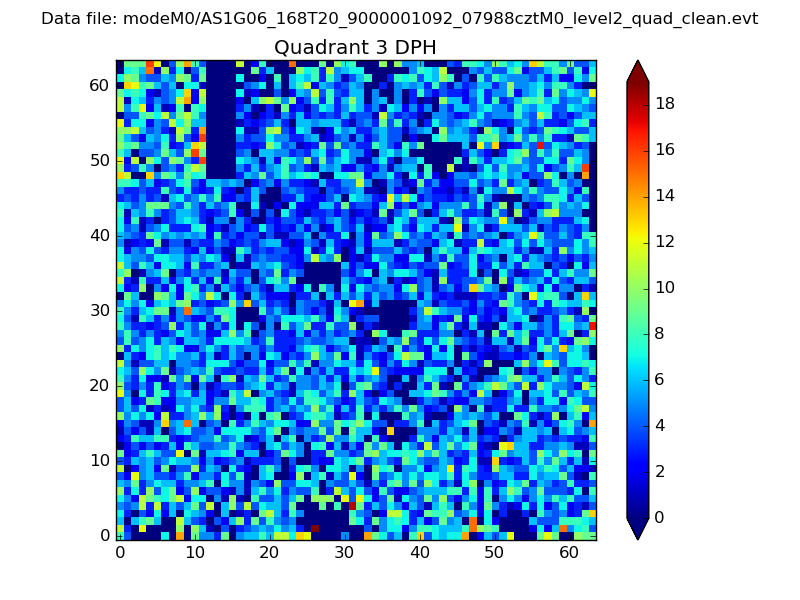 |
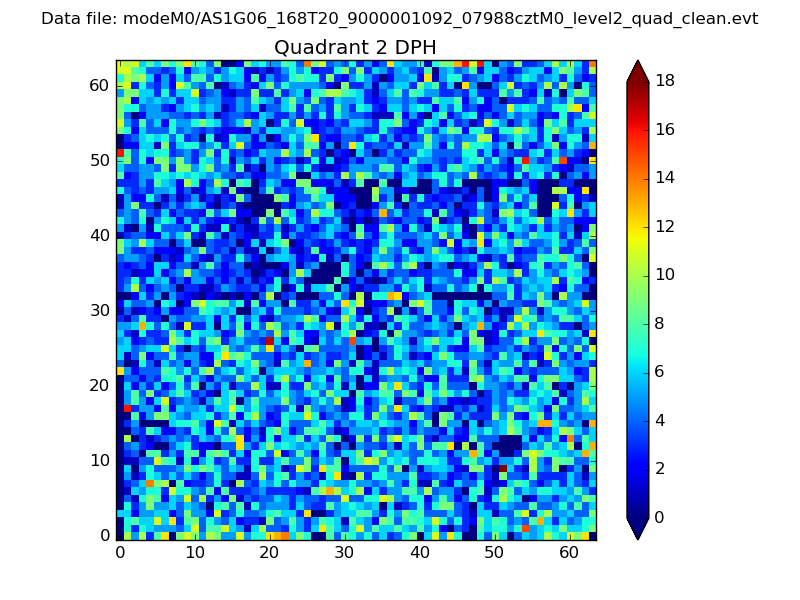 |
Quadrant C |
| Plot type | Count rate plots | Images |
|---|---|---|
| Comparison with Poisson distribution Blue bars denote a histogram of data divided into 1 sec bins. Red curve is a Poisson curve with rate = median count rate of data. |
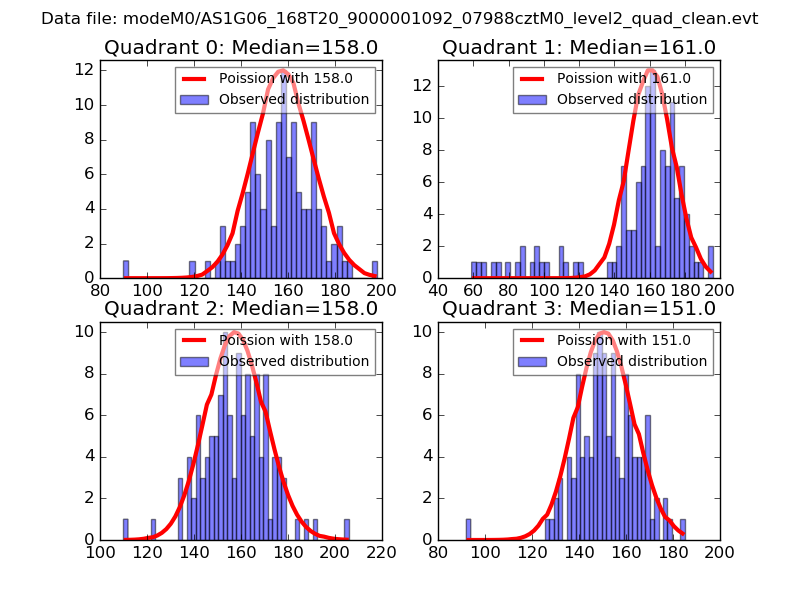 |
 |
| Quadrant-wise count rates Data is divided into 100 sec bins |
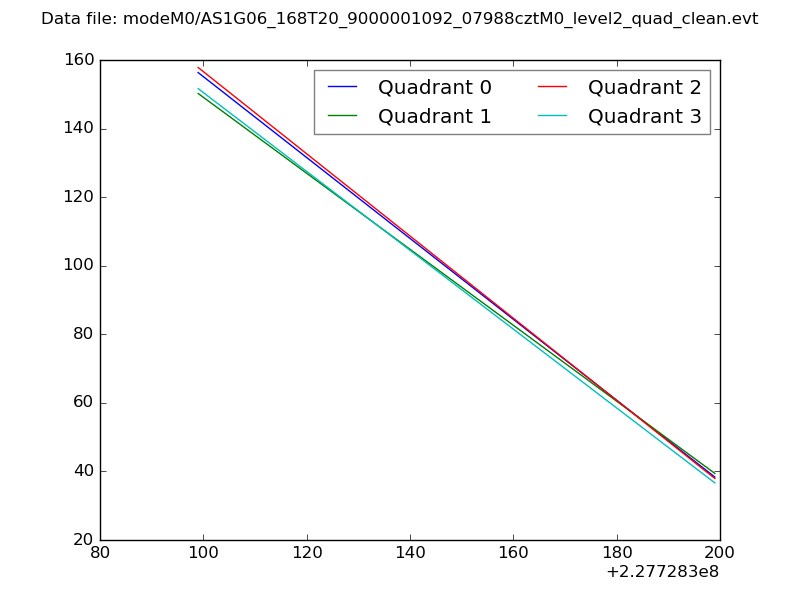 |
|
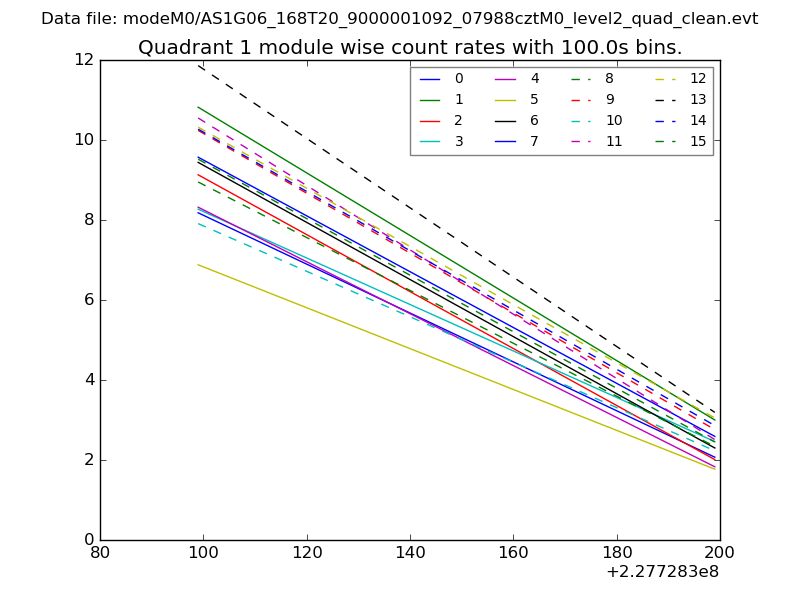
| Module-wise count rates for Quadrant A Data is divided into 100 sec bins |
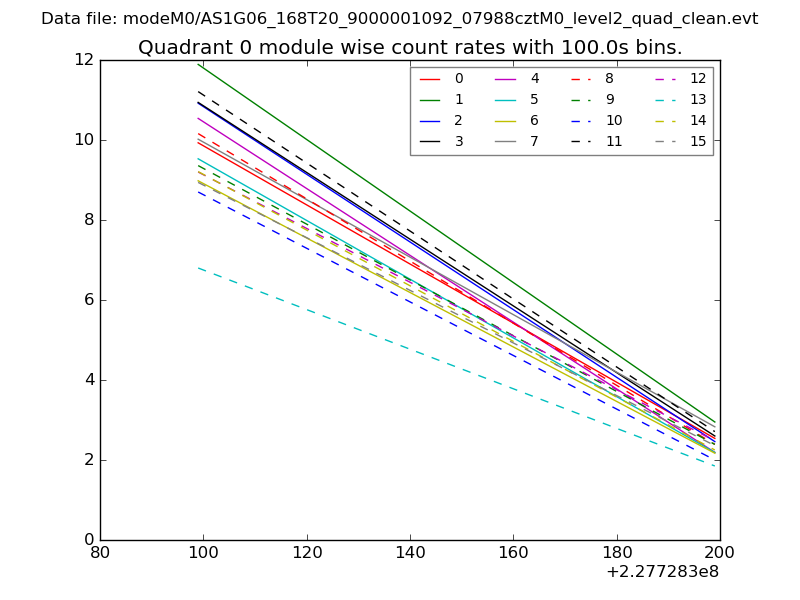 |
 |
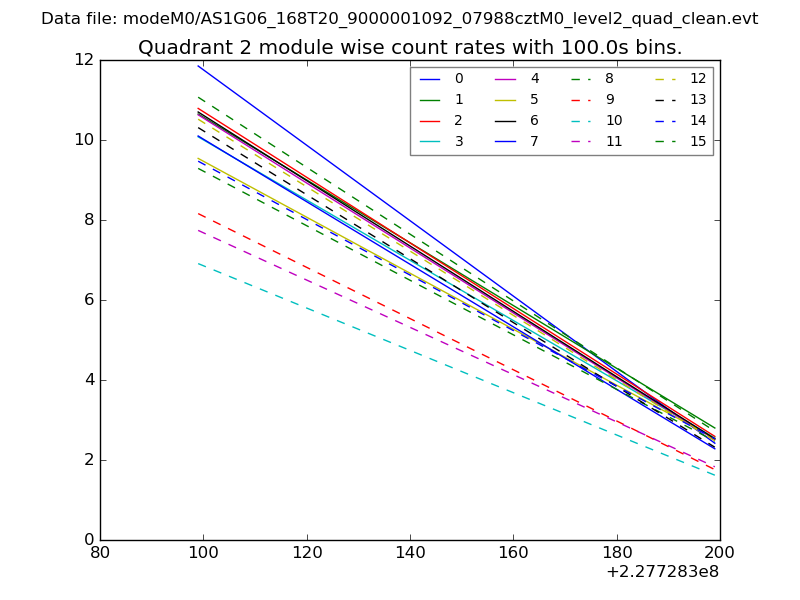
| Module-wise count rates for Quadrant B Data is divided into 100 sec bins |
 |
 |
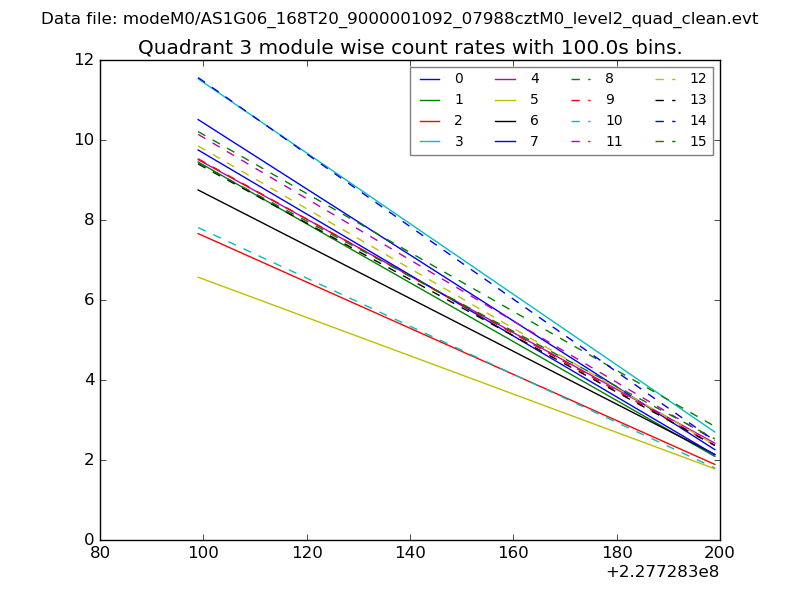
| Module-wise count rates for Quadrant C Data is divided into 100 sec bins |
 |
 |
| Module-wise count rates for Quadrant D Data is divided into 100 sec bins |
 |
 |
| Parameter | Plot |
|---|---|
| CZT HV Monitor | 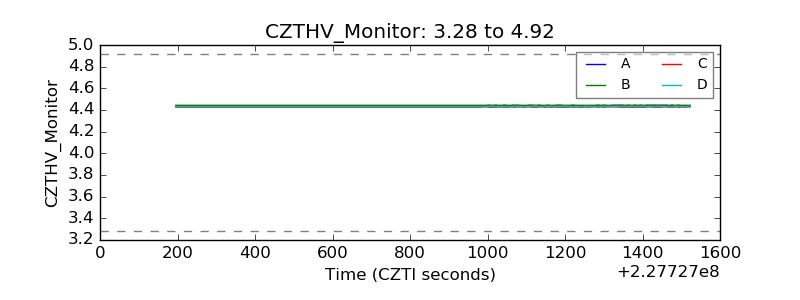 |
| D_VDD | 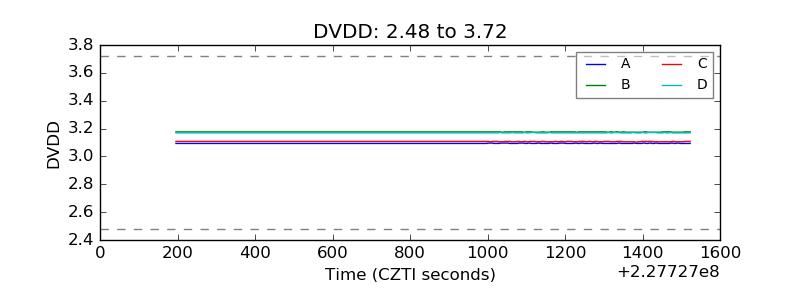 |
| Temperature 1 | 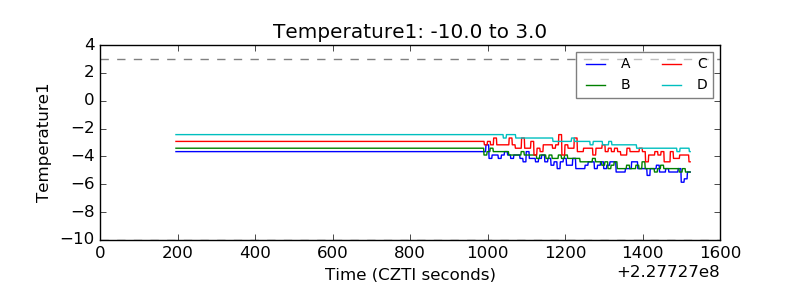 |
| Veto HV Monitor | 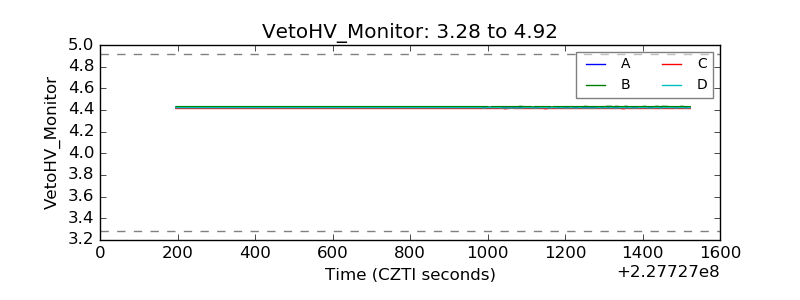 |
| Veto LLD | 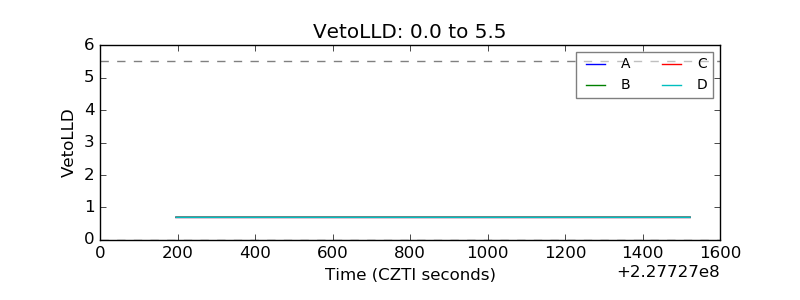 |
| Alpha Counter | 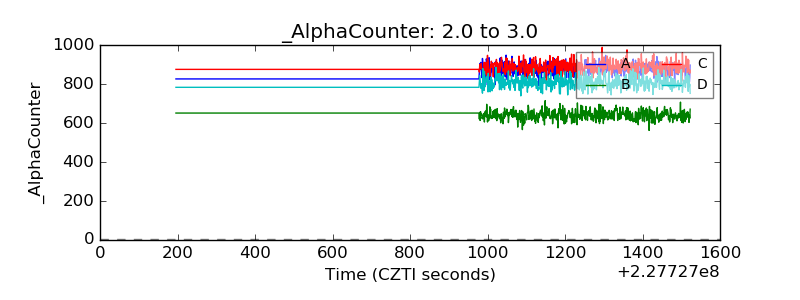 |
| _CPM_Rate | 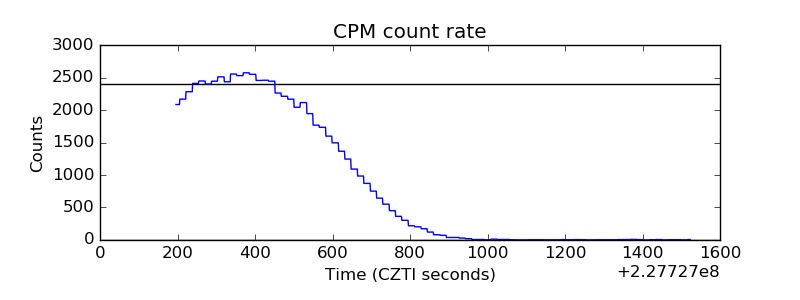 |
| CZT Counter | 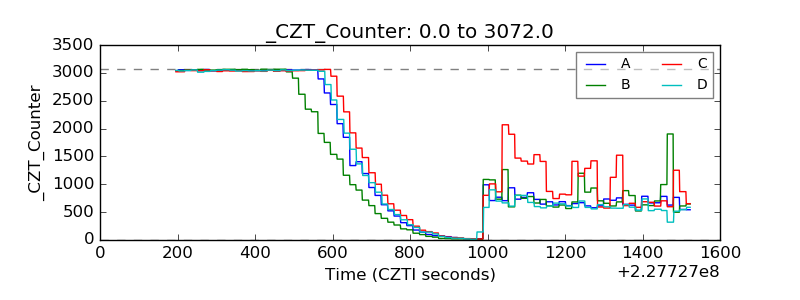 |
| +2.5 Volts monitor |  |
| +5 Volts monitor |  |
| _ROLL_ROT | 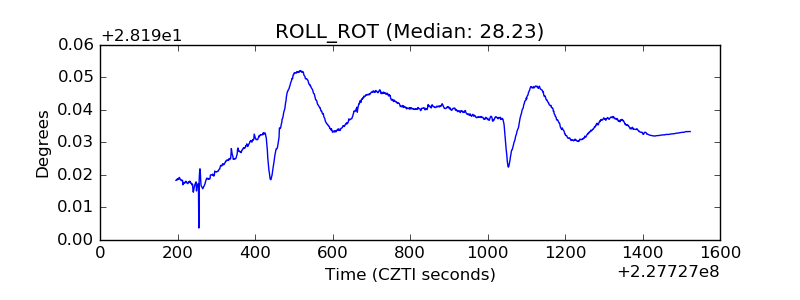 |
| _Roll_DEC | 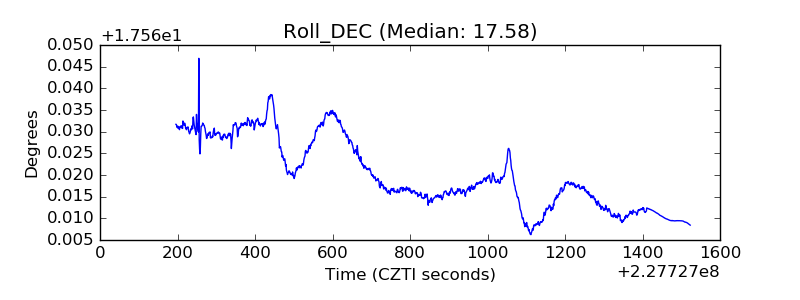 |
| _Roll_RA | 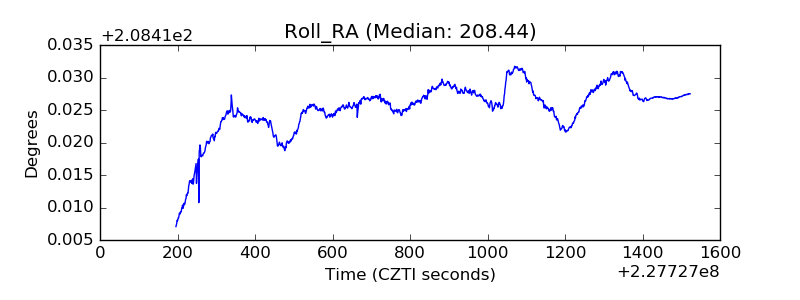 |
| Veto Counter | 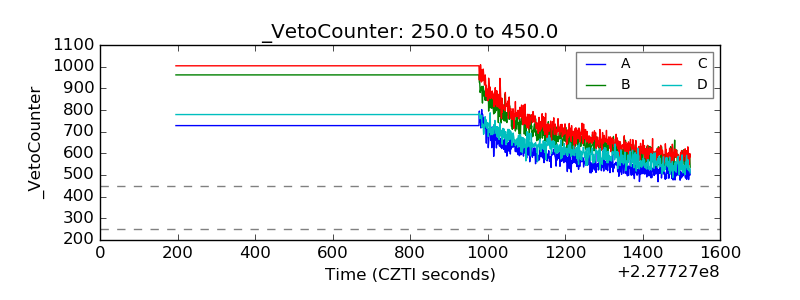 |